
Pays-Bas vs France : exportations de biens et services par année ($ US), 1960–2025
| Année | $ US | |
|---|---|---|
 Pays-Bas |
 France |
|
| 2025 | 1 075 134 885 756 $ US | 1 124 107 902 931 $ US |
| 2024 | 1 001 469 281 570 $ US | 1 071 066 237 472 $ US |
| 2023 | 993 383 113 412 $ US | 1 053 069 574 155 $ US |
| 2022 | 1 009 321 846 482 $ US | 1 023 340 977 697 $ US |
| 2021 | 911 591 180 291 $ US | 928 139 254 791 $ US |
| 2020 | 757 626 674 439 $ US | 756 174 143 647 $ US |
| 2019 | 792 548 771 333 $ US | 895 514 342 479 $ US |
| 2018 | 809 393 154 293 $ US | 915 638 789 627 $ US |
| 2017 | 722 521 486 847 $ US | 836 510 836 278 $ US |
| 2016 | 644 981 374 821 $ US | 778 134 181 664 $ US |
| 2015 | 651 561 445 020 $ US | 774 108 364 253 $ US |
| 2014 | 733 707 070 162 $ US | 879 595 852 391 $ US |
| 2013 | 710 442 214 009 $ US | 861 474 336 499 $ US |
| 2012 | 672 962 028 019 $ US | 814 445 012 228 $ US |
| 2011 | 686 455 260 574 $ US | 847 885 600 685 $ US |
| 2010 | 590 650 523 650 $ US | 736 352 883 613 $ US |
| 2009 | 541 451 746 607 $ US | 698 805 241 357 $ US |
| 2008 | 666 753 754 959 $ US | 854 598 937 578 $ US |
| 2007 | 586 439 887 283 $ US | 766 429 838 942 $ US |
| 2006 | 502 638 809 838 $ US | 670 507 475 708 $ US |
| 2005 | 451 318 628 109 $ US | 617 386 391 344 $ US |
| 2004 | 413 899 788 533 $ US | 580 996 794 039 $ US |
| 2003 | 345 031 067 457 $ US | 497 989 403 586 $ US |
| 2002 | 285 816 678 856 $ US | 428 784 967 659 $ US |
| 2001 | 274 109 208 169 $ US | 403 310 126 489 $ US |
| 2000 | 277 498 466 740 $ US | 404 994 866 620 $ US |
| 1999 | 269 992 081 764 $ US | 404 544 866 221 $ US |
| 1998 | 261 751 832 926 $ US | 407 948 410 051 $ US |
| 1997 | 253 701 152 022 $ US | 385 977 860 193 $ US |
| 1996 | 260 884 967 320 $ US | 385 700 089 755 $ US |
| 1995 | 261 325 830 360 $ US | 377 901 958 207 $ US |
| 1994 | 209 535 513 985 $ US | 315 281 781 664 $ US |
| 1993 | 187 817 236 592 $ US | 286 749 942 089 $ US |
| 1992 | 195 617 498 747 $ US | 311 915 489 467 $ US |
| 1991 | 182 235 627 063 $ US | 282 187 071 271 $ US |
| 1990 | 174 901 597 483 $ US | 276 540 778 219 $ US |
| 1989 | 143 549 099 034 $ US | 231 757 351 429 $ US |
| 1988 | 136 821 844 130 $ US | 216 541 900 672 $ US |
| 1987 | 122 354 540 905 $ US | 191 116 992 251 $ US |
| 1986 | 103 000 590 034 $ US | 163 573 823 279 $ US |
| 1985 | 87 007 504 644 $ US | 133 608 336 984 $ US |
| 1984 | 84 859 203 297 $ US | 130 768 670 720 $ US |
| 1983 | 84 582 826 809 $ US | 129 679 318 358 $ US |
| 1982 | 87 857 010 811 $ US | 129 417 606 548 $ US |
| 1981 | 90 974 239 159 $ US | 140 423 536 512 $ US |
| 1980 | 99 352 813 123 $ US | 152 790 282 521 $ US |
| 1979 | 86 827 436 010 $ US | 132 072 926 303 $ US |
| 1978 | 69 032 180 689 $ US | 106 772 238 372 $ US |
| 1977 | 58 924 320 733 $ US | 86 513 238 834 $ US |
| 1976 | 53 523 223 871 $ US | 75 121 414 914 $ US |
| 1975 | 48 070 418 264 $ US | 70 958 390 699 $ US |
| 1974 | 44 381 674 727 $ US | 61 397 981 451 $ US |
| 1973 | 32 943 078 196 $ US | 48 415 733 648 $ US |
| 1972 | 23 953 249 107 $ US | 35 386 996 099 $ US |
| 1971 | 19 538 182 331 $ US | 28 648 395 880 $ US |
| 1970 | 16 625 163 450 $ US | 24 880 359 041 $ US |
| 1969 | 14 107 826 092 $ US | 21 332 691 446 $ US |
| 1968 | - | 18 545 142 886 $ US |
| 1967 | - | 16 945 727 282 $ US |
| 1966 | - | 15 759 518 400 $ US |
| 1965 | - | 14 511 926 398 $ US |
| 1964 | - | 12 972 299 548 $ US |
| 1963 | - | 11 534 712 171 $ US |
| 1962 | - | 10 480 171 412 $ US |
| 1961 | - | 10 206 604 646 $ US |
| 1960 | - | 9 666 380 037 $ US |
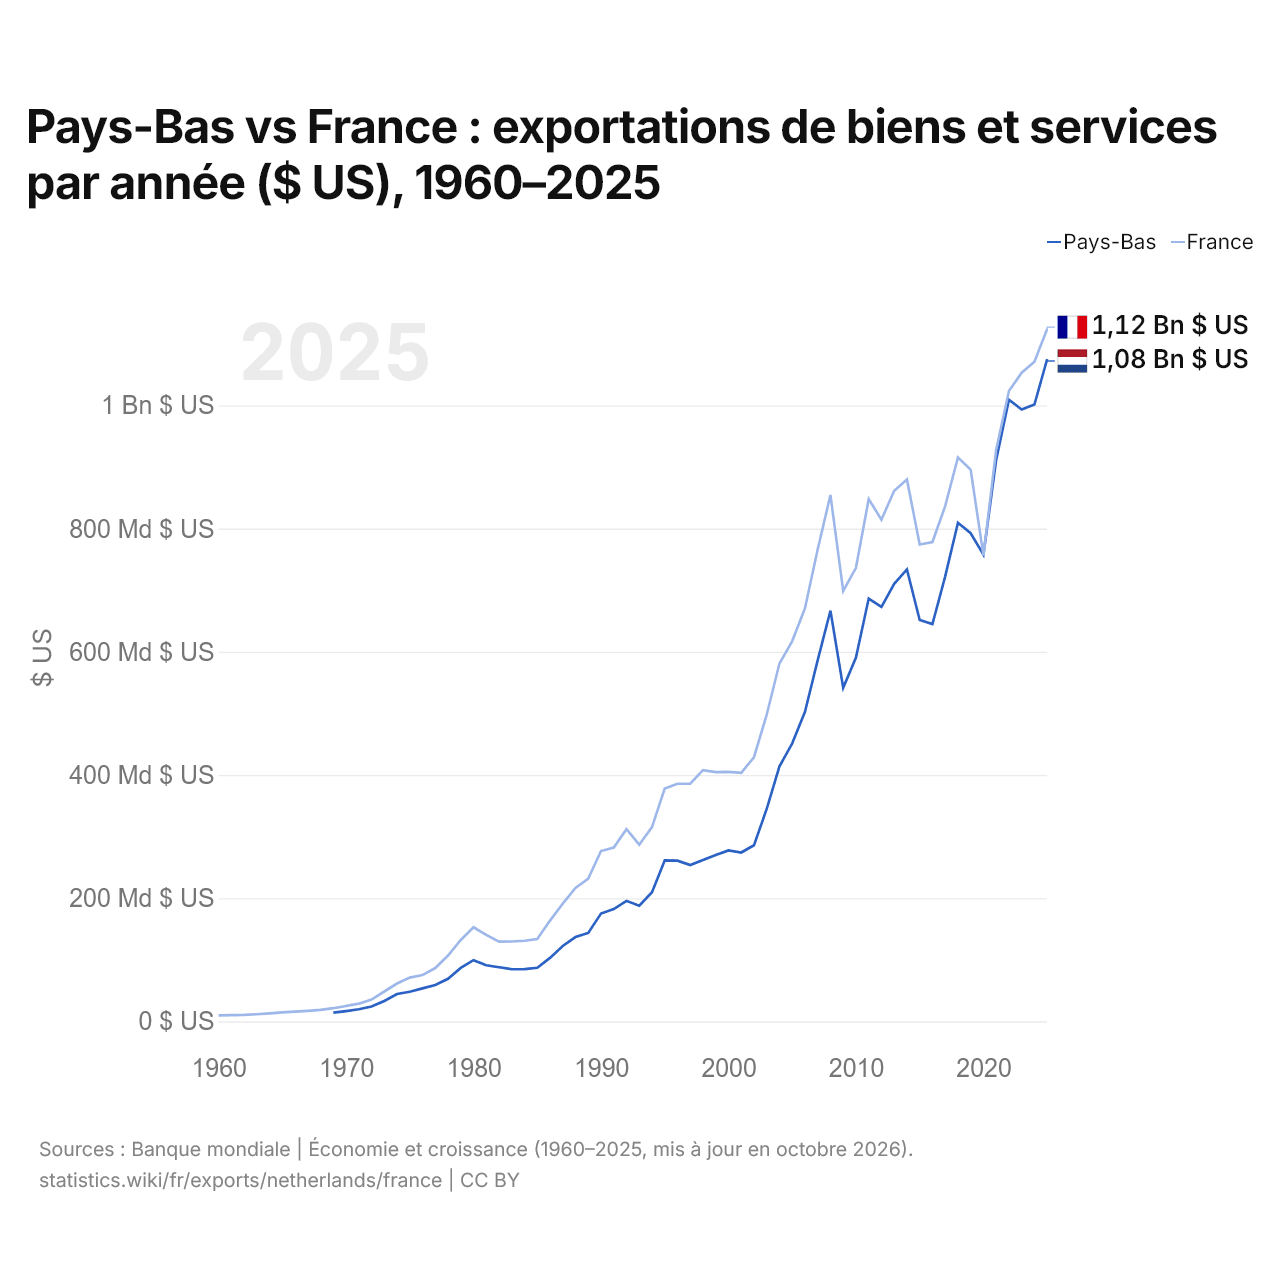
En 2025, les exportations de biens et services des Pays-Bas s'élevaient à 1,08 billion de dollars et celles de la France à 1,12 billion de dollars : celles de la France étaient supérieures de 4,6 %. En 1969, les exportations de la France étaient 1,5 fois plus élevées : 14,1 milliards de dollars pour les Pays-Bas et 21,3 milliards de dollars pour la France.
Les exportations de biens et services de la France sont supérieures à celles des Pays-Bas chaque année depuis 2021.
Exportations de biens entre les Pays-Bas et la France, selon chaque exportateur ($ US), 2001–2025
| Année | $ US | |
|---|---|---|
| Pays-Bas → France | France → Pays-Bas | |
| 2025 | 55 841 308 000 $ US | 26 922 136 000 $ US |
| 2024 | 54 818 644 000 $ US | 24 968 837 000 $ US |
| 2023 | 57 723 266 000 $ US | 24 674 193 000 $ US |
| 2022 | 62 138 394 000 $ US | 25 583 824 000 $ US |
| 2021 | 56 098 787 000 $ US | 23 504 106 000 $ US |
| 2020 | 42 457 426 000 $ US | 18 276 576 000 $ US |
| 2019 | 45 055 085 000 $ US | 19 698 111 000 $ US |
| 2018 | 46 114 179 000 $ US | 20 934 656 000 $ US |
| 2017 | 42 561 133 000 $ US | 19 226 268 000 $ US |
| 2016 | 37 957 926 000 $ US | 17 790 755 000 $ US |
| 2015 | 36 738 248 000 $ US | 19 378 692 000 $ US |
| 2014 | 47 149 109 000 $ US | 23 316 755 000 $ US |
| 2013 | 47 724 948 000 $ US | 23 431 287 000 $ US |
| 2012 | 46 609 439 000 $ US | 23 702 261 000 $ US |
| 2011 | 50 424 792 000 $ US | 25 078 141 000 $ US |
| 2010 | 43 089 328 000 $ US | 21 551 866 000 $ US |
| 2009 | 38 347 761 000 $ US | 19 327 850 000 $ US |
| 2008 | 47 707 807 000 $ US | 25 158 300 000 $ US |
| 2007 | 39 195 282 000 $ US | 22 830 462 000 $ US |
| 2006 | 33 023 335 000 $ US | 20 068 472 000 $ US |
| 2005 | 32 004 652 000 $ US | 18 098 155 000 $ US |
| 2004 | 30 705 348 000 $ US | 16 635 374 000 $ US |
| 2003 | 26 533 338 000 $ US | 14 060 053 000 $ US |
| 2002 | 22 107 628 000 $ US | 12 180 260 000 $ US |
| 2001 | 22 343 514 000 $ US | 11 635 051 000 $ US |
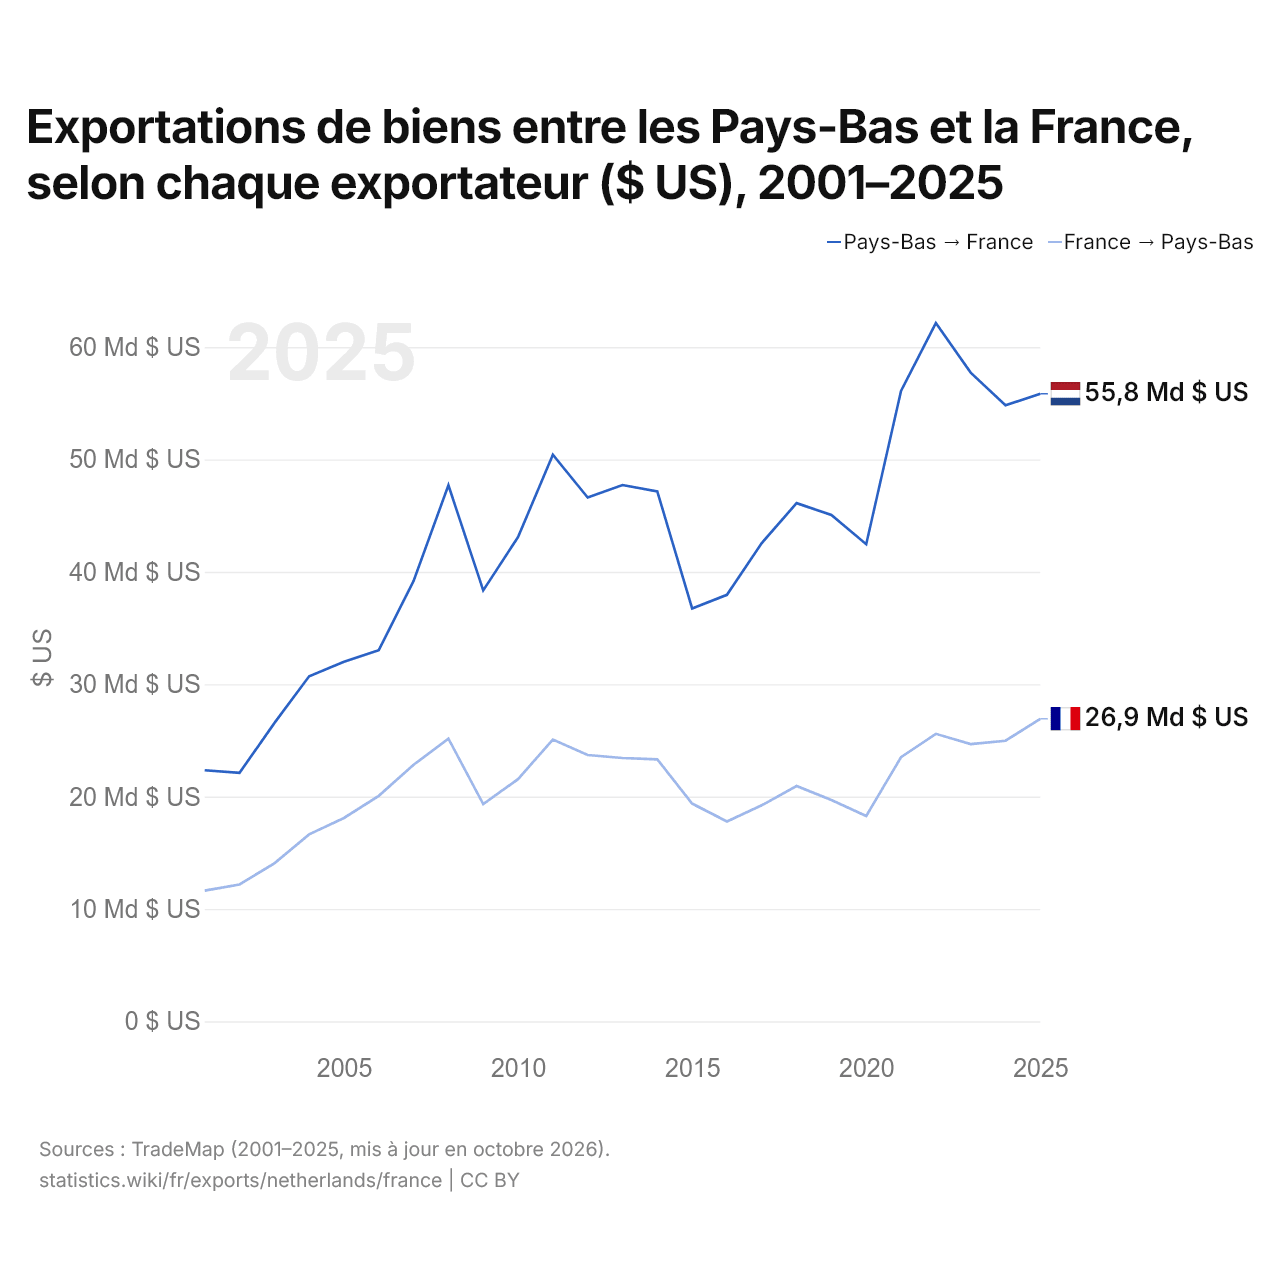
En 2025, les exportations de biens des Pays-Bas vers la France, selon les Pays-Bas, s'élevaient à 55,8 milliards de dollars, et celles de la France vers les Pays-Bas, selon la France, à 26,9 milliards de dollars : 2,1 fois plus pour celles des Pays-Bas. En 2001, elles s'élevaient à 22,3 milliards de dollars pour les Pays-Bas et à 11,6 milliards de dollars pour la France.
Pays-Bas vs France : chiffres des exportations
|
Pays-Bas
|
France
|
|
|---|---|---|
| Exportations | 1,08 Bn $US (2025) | 1,12 Bn $US (2025) |
| Rang mondial | 6/176 | 5/176 |
| Part mondiale | 3,08 % | 3,22 % |
| % du PIB | 80,7 % | 33,4 % |
| Première catégorie de biens | Machines, électronique et véhicules (34,7 %, 2025) | Machines, électronique et véhicules (39,3 %, 2025) |
| Première destination des biens | Allemagne (22,2 %, 2025) | Allemagne (13,5 %, 2025) |
Comparer les exportations de 2 pays au choix
Sources :
- Banque mondiale | Économie et croissance (1960–2025, mis à jour en octobre 2026)
- TradeMap (2001–2025, mis à jour en octobre 2026)
Creative Commons Attribution (CC BY) : vous pouvez copier, partager, adapter et réutiliser ce contenu, y compris à des fins commerciales, à condition de citer statistics.wiki et d’indiquer les modifications apportées. Les sources citées ci-dessus peuvent avoir leurs propres conditions de licence.