
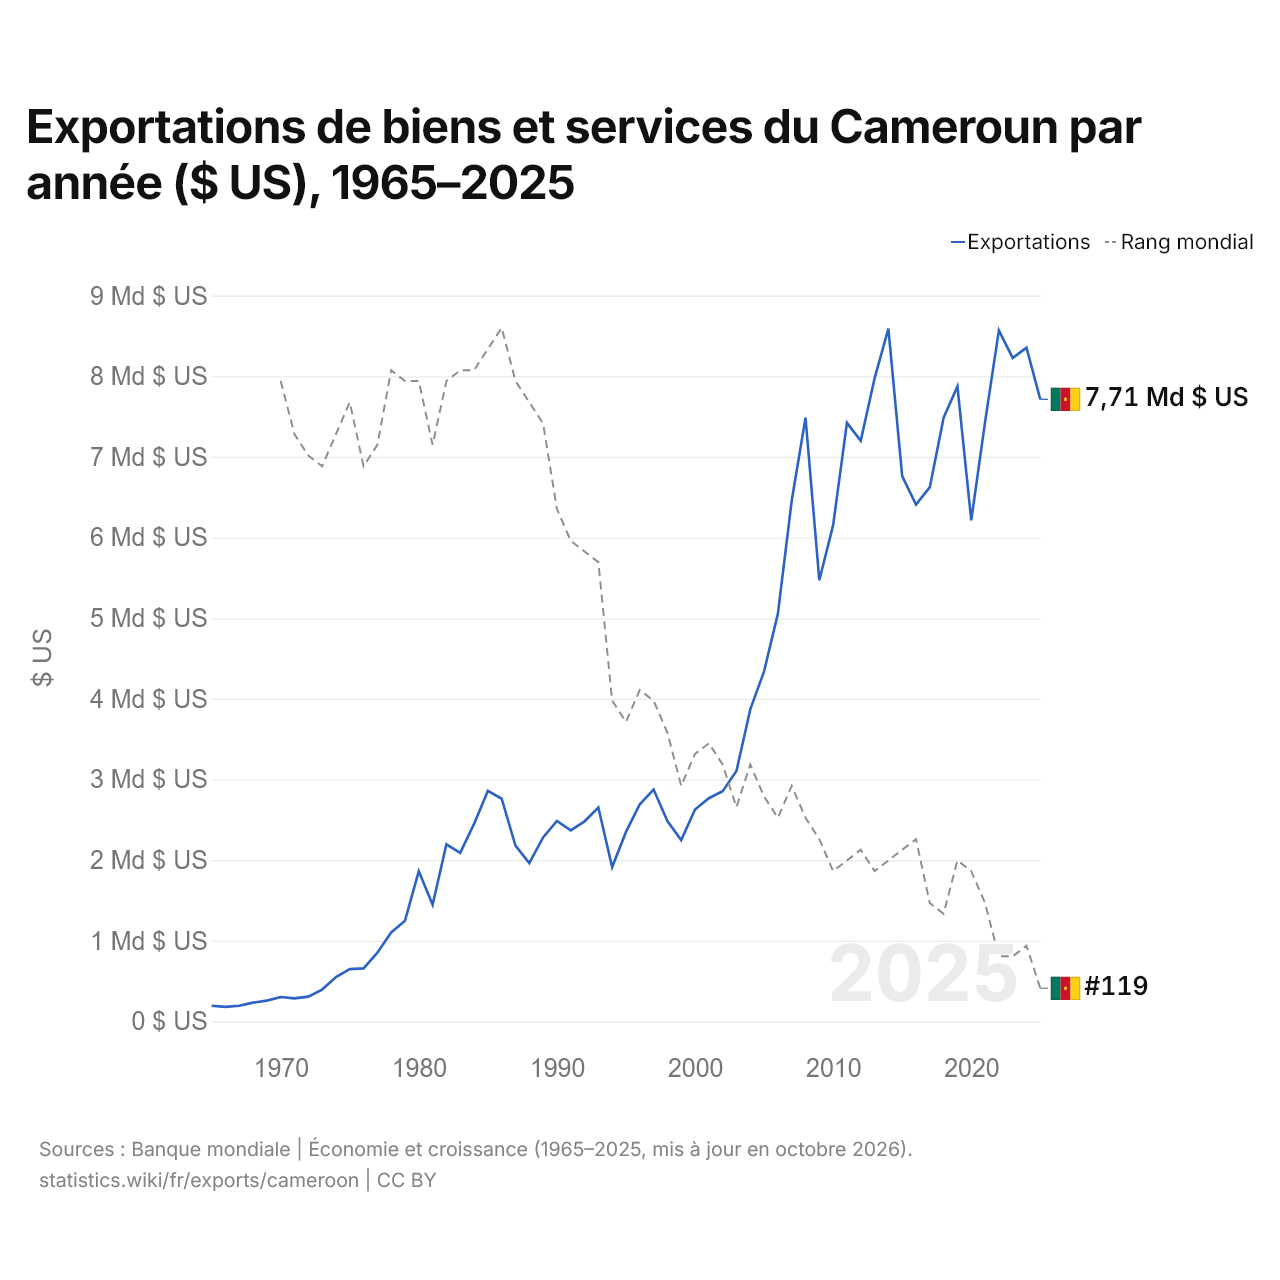
Exportations de biens et services du Cameroun par année ($ US), 1965–2025
| Année | $ US | Rang mondial |
|---|---|---|
| Exportations | Rang mondial | |
| 2025 | 7 713 888 549 $ US | #119 |
| 2024 | 8 353 326 094 $ US | #115 |
| 2023 | 8 226 588 945 $ US | #116 |
| 2022 | 8 568 684 369 $ US | #116 |
| 2021 | 7 430 968 539 $ US | #111 |
| 2020 | 6 212 103 785 $ US | #108 |
| 2019 | 7 874 085 867 $ US | #107 |
| 2018 | 7 486 173 533 $ US | #112 |
| 2017 | 6 624 479 953 $ US | #111 |
| 2016 | 6 407 809 686 $ US | #105 |
| 2015 | 6 760 654 005 $ US | #106 |
| 2014 | 8 590 854 303 $ US | #107 |
| 2013 | 7 973 145 413 $ US | #108 |
| 2012 | 7 200 040 957 $ US | #106 |
| 2011 | 7 421 773 623 $ US | #107 |
| 2010 | 6 153 122 906 $ US | #108 |
| 2009 | 5 469 950 249 $ US | #105 |
| 2008 | 7 485 406 851 $ US | #103 |
| 2007 | 6 455 516 974 $ US | #100 |
| 2006 | 5 055 972 600 $ US | #103 |
| 2005 | 4 340 055 666 $ US | #101 |
| 2004 | 3 868 330 225 $ US | #98 |
| 2003 | 3 104 135 993 $ US | #102 |
| 2002 | 2 854 249 060 $ US | #98 |
| 2001 | 2 766 983 730 $ US | #96 |
| 2000 | 2 626 514 828 $ US | #97 |
| 1999 | 2 247 078 226 $ US | #100 |
| 1998 | 2 483 240 189 $ US | #95 |
| 1997 | 2 875 461 379 $ US | #92 |
| 1996 | 2 691 568 972 $ US | #91 |
| 1995 | 2 348 799 529 $ US | #94 |
| 1994 | 1 912 336 306 $ US | #92 |
| 1993 | 2 652 315 493 $ US | #79 |
| 1992 | 2 480 390 364 $ US | #78 |
| 1991 | 2 367 905 904 $ US | #77 |
| 1990 | 2 485 421 488 $ US | #74 |
| 1989 | 2 280 376 117 $ US | #66 |
| 1988 | 1 961 804 002 $ US | #64 |
| 1987 | 2 178 543 701 $ US | #62 |
| 1986 | 2 760 485 196 $ US | #57 |
| 1985 | 2 858 134 101 $ US | #59 |
| 1984 | 2 447 934 060 $ US | #61 |
| 1983 | 2 088 376 143 $ US | #61 |
| 1982 | 2 195 884 893 $ US | #62 |
| 1981 | 1 445 617 474 $ US | #68 |
| 1980 | 1 861 186 771 $ US | #62 |
| 1979 | 1 247 639 814 $ US | #62 |
| 1978 | 1 103 007 002 $ US | #61 |
| 1977 | 850 701 204 $ US | #68 |
| 1976 | 656 202 836 $ US | #70 |
| 1975 | 648 117 760 $ US | #64 |
| 1974 | 548 805 301 $ US | #67 |
| 1973 | 393 469 131 $ US | #70 |
| 1972 | 305 521 571 $ US | #69 |
| 1971 | 284 721 122 $ US | #67 |
| 1970 | 301 733 187 $ US | #62 |
| 1969 | 257 346 672 $ US | - |
| 1968 | 231 454 655 $ US | - |
| 1967 | 193 088 700 $ US | - |
| 1966 | 178 688 820 $ US | - |
| 1965 | 193 421 238 $ US | - |
En 2025, les exportations de biens et services du Cameroun s'élevaient à 7,71 milliards de dollars, contre 193 millions de dollars en 1965. Le maximum a été de 8,59 milliards de dollars, en 2014. Elles se classaient au 119e rang mondial, en baisse par rapport au 115e rang en 2024. Leur meilleur rang a été le 57e, occupé pour la dernière fois en 1986.
En 2025, les exportations de biens et services du Cameroun étaient les 23es plus élevées de 50 pays situés en Afrique. Les importations de biens et services du Cameroun s'élevaient à 12 milliards de dollars en 2025, au 116e rang mondial. En 2025, les importations du Cameroun dépassaient ses exportations de 4,25 milliards de dollars, soit un déficit commercial.
Exportations de biens du Cameroun par catégorie
Exportations de biens, 2024: 5,36 Md $US
La première catégorie des exportations de biens du Cameroun est « pétrole, gaz, minerais et autres matières premières », avec 45,8 %, suivie de « aliments transformés, huiles, aliments pour animaux, boissons et tabac », avec 32,6 %.
Destinations des exportations de biens du Cameroun : les 10 premières
| Rang | Pays | Exportations de biens | Part | |
|---|---|---|---|---|
| 1 |
 Pays-Bas |
1,03 Md $US | 19,2 % | |
| 2 |
 Chine |
883 M $US | 16,5 % | |
| 3 |
 Inde |
540 M $US | 10,1 % | |
| 4 |
 Italie |
341 M $US | 6,36 % | |
| 5 |
 France |
308 M $US | 5,75 % | vs France |
| 6 |
 Bangladesh |
270 M $US | 5,03 % | |
| 7 |
 Belgique |
269 M $US | 5,01 % | |
| 8 |
 Tchad |
229 M $US | 4,27 % | |
| 9 |
 États-Unis |
199 M $US | 3,7 % | |
| 10 |
 Turquie |
166 M $US | 3,1 % | |
| Autres partenaires et non précisés | 1,13 Md $US | 21,1 % |
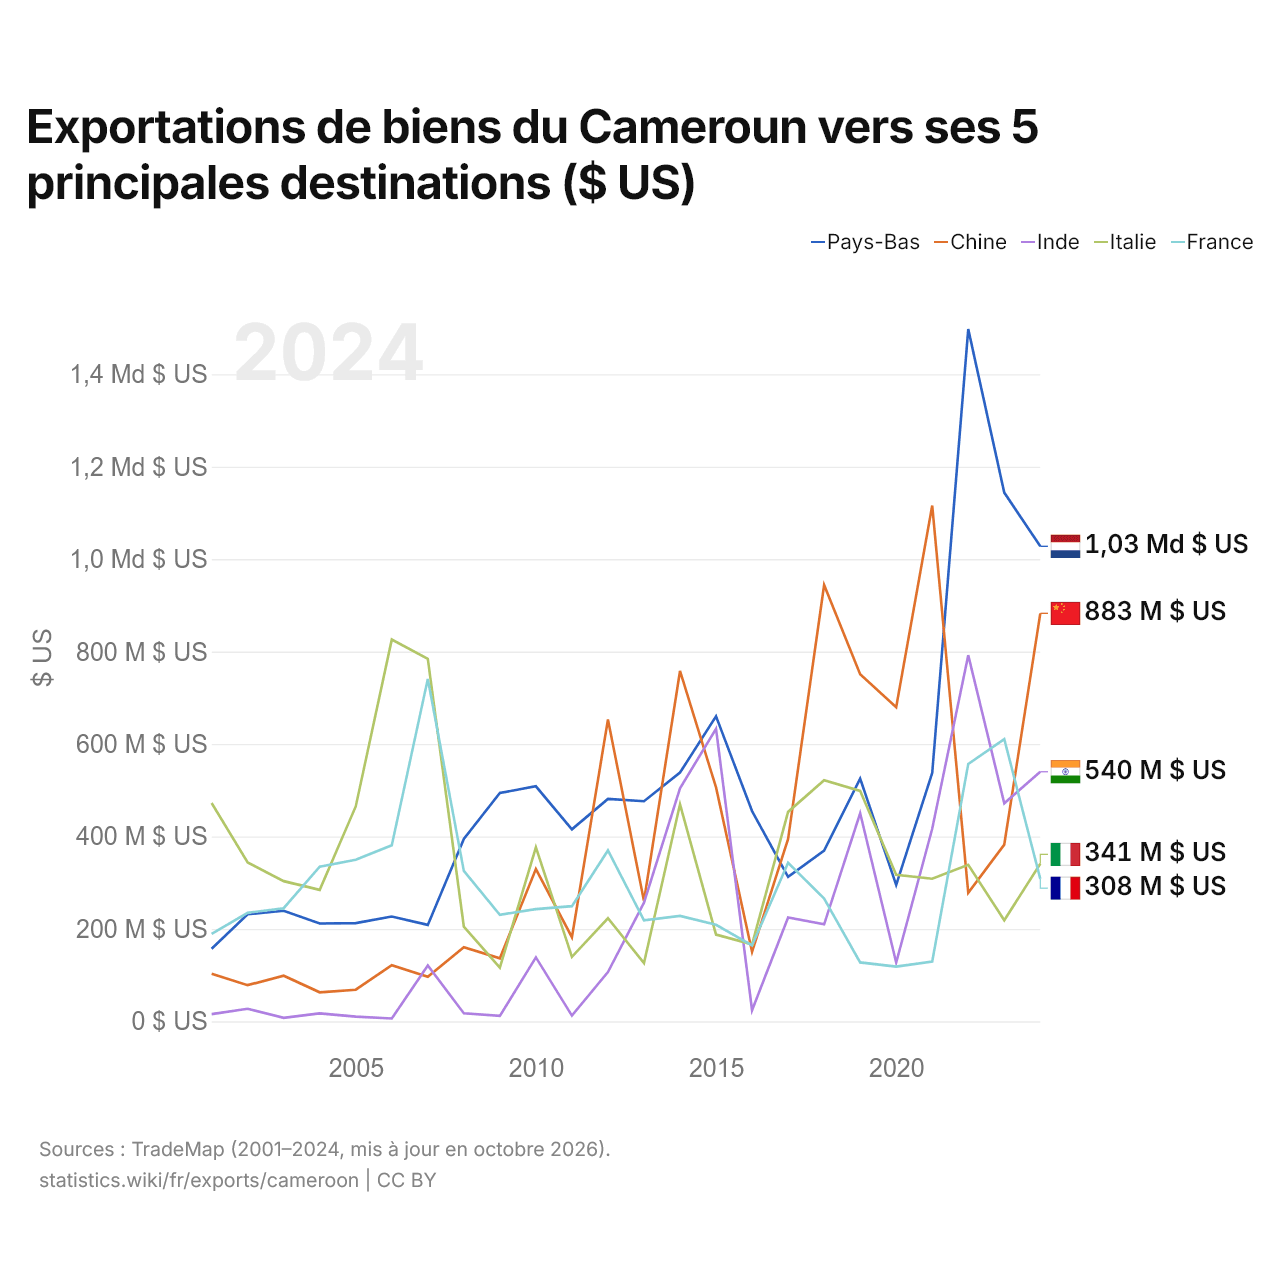
Exportations de biens du Cameroun vers ses 5 principales destinations ($ US)
| Année | $ US | ||||
|---|---|---|---|---|---|
| Pays-Bas | Chine | Inde | Italie | France | |
| 2024 | 1 027 704 000 $ US | 882 636 000 $ US | 540 027 000 $ US | 341 110 000 $ US | 308 209 000 $ US |
| 2023 | 1 143 831 000 $ US | 382 390 000 $ US | 471 742 000 $ US | 218 532 000 $ US | 610 700 000 $ US |
| 2022 | 1 497 522 000 $ US | 278 267 000 $ US | 792 176 000 $ US | 338 502 000 $ US | 556 824 000 $ US |
| 2021 | 537 150 000 $ US | 1 115 802 000 $ US | 416 616 000 $ US | 308 475 000 $ US | 129 560 000 $ US |
| 2020 | 294 933 000 $ US | 679 747 000 $ US | 127 211 000 $ US | 316 911 000 $ US | 118 373 000 $ US |
| 2019 | 525 070 000 $ US | 750 888 000 $ US | 450 229 000 $ US | 498 413 000 $ US | 127 391 000 $ US |
| 2018 | 369 533 000 $ US | 944 105 000 $ US | 209 866 000 $ US | 521 564 000 $ US | 265 699 000 $ US |
| 2017 | 312 626 000 $ US | 394 519 000 $ US | 224 702 000 $ US | 453 181 000 $ US | 343 156 000 $ US |
| 2016 | 454 878 000 $ US | 150 646 000 $ US | 24 038 000 $ US | 166 416 000 $ US | 164 135 000 $ US |
| 2015 | 659 766 000 $ US | 506 027 000 $ US | 632 743 000 $ US | 187 599 000 $ US | 208 922 000 $ US |
| 2014 | 538 135 000 $ US | 758 100 000 $ US | 504 195 000 $ US | 469 569 000 $ US | 227 957 000 $ US |
| 2013 | 476 229 000 $ US | 260 400 000 $ US | 256 858 000 $ US | 126 162 000 $ US | 218 496 000 $ US |
| 2012 | 481 267 000 $ US | 652 972 000 $ US | 106 630 000 $ US | 223 057 000 $ US | 369 826 000 $ US |
| 2011 | 415 321 000 $ US | 181 886 000 $ US | 12 324 000 $ US | 139 507 000 $ US | 249 243 000 $ US |
| 2010 | 508 555 000 $ US | 329 561 000 $ US | 138 373 000 $ US | 376 611 000 $ US | 242 690 000 $ US |
| 2009 | 493 933 000 $ US | 136 276 000 $ US | 11 768 000 $ US | 116 108 000 $ US | 230 496 000 $ US |
| 2008 | 394 770 000 $ US | 160 229 000 $ US | 17 442 000 $ US | 205 054 000 $ US | 325 425 000 $ US |
| 2007 | 208 605 000 $ US | 96 485 000 $ US | 120 939 000 $ US | 784 134 000 $ US | 740 566 000 $ US |
| 2006 | 226 775 000 $ US | 121 535 000 $ US | 6 129 000 $ US | 825 886 000 $ US | 380 859 000 $ US |
| 2005 | 212 432 000 $ US | 68 365 000 $ US | 10 021 000 $ US | 464 928 000 $ US | 349 704 000 $ US |
| 2004 | 211 573 000 $ US | 62 830 000 $ US | 17 245 000 $ US | 284 332 000 $ US | 334 563 000 $ US |
| 2003 | 239 195 000 $ US | 98 585 000 $ US | 7 668 000 $ US | 303 236 000 $ US | 244 744 000 $ US |
| 2002 | 231 720 000 $ US | 78 266 000 $ US | 27 171 000 $ US | 343 773 000 $ US | 234 790 000 $ US |
| 2001 | 156 985 000 $ US | 102 973 000 $ US | 15 656 000 $ US | 472 405 000 $ US | 189 116 000 $ US |
Les exportations de biens s'élèvent à 1,03 milliard de dollars vers les Pays-Bas (2024), 883 millions de dollars vers la Chine (2024), 540 millions de dollars vers l'Inde (2024), 341 millions de dollars vers l'Italie (2024) et 308 millions de dollars vers la France (2024). Le premier rang des cinq destinations du Cameroun est occupé par les Pays-Bas depuis 2022. Le changement le plus récent dans leur ordre remonte à 2024, quand les exportations du Cameroun vers la Chine ont dépassé celles vers l'Inde.
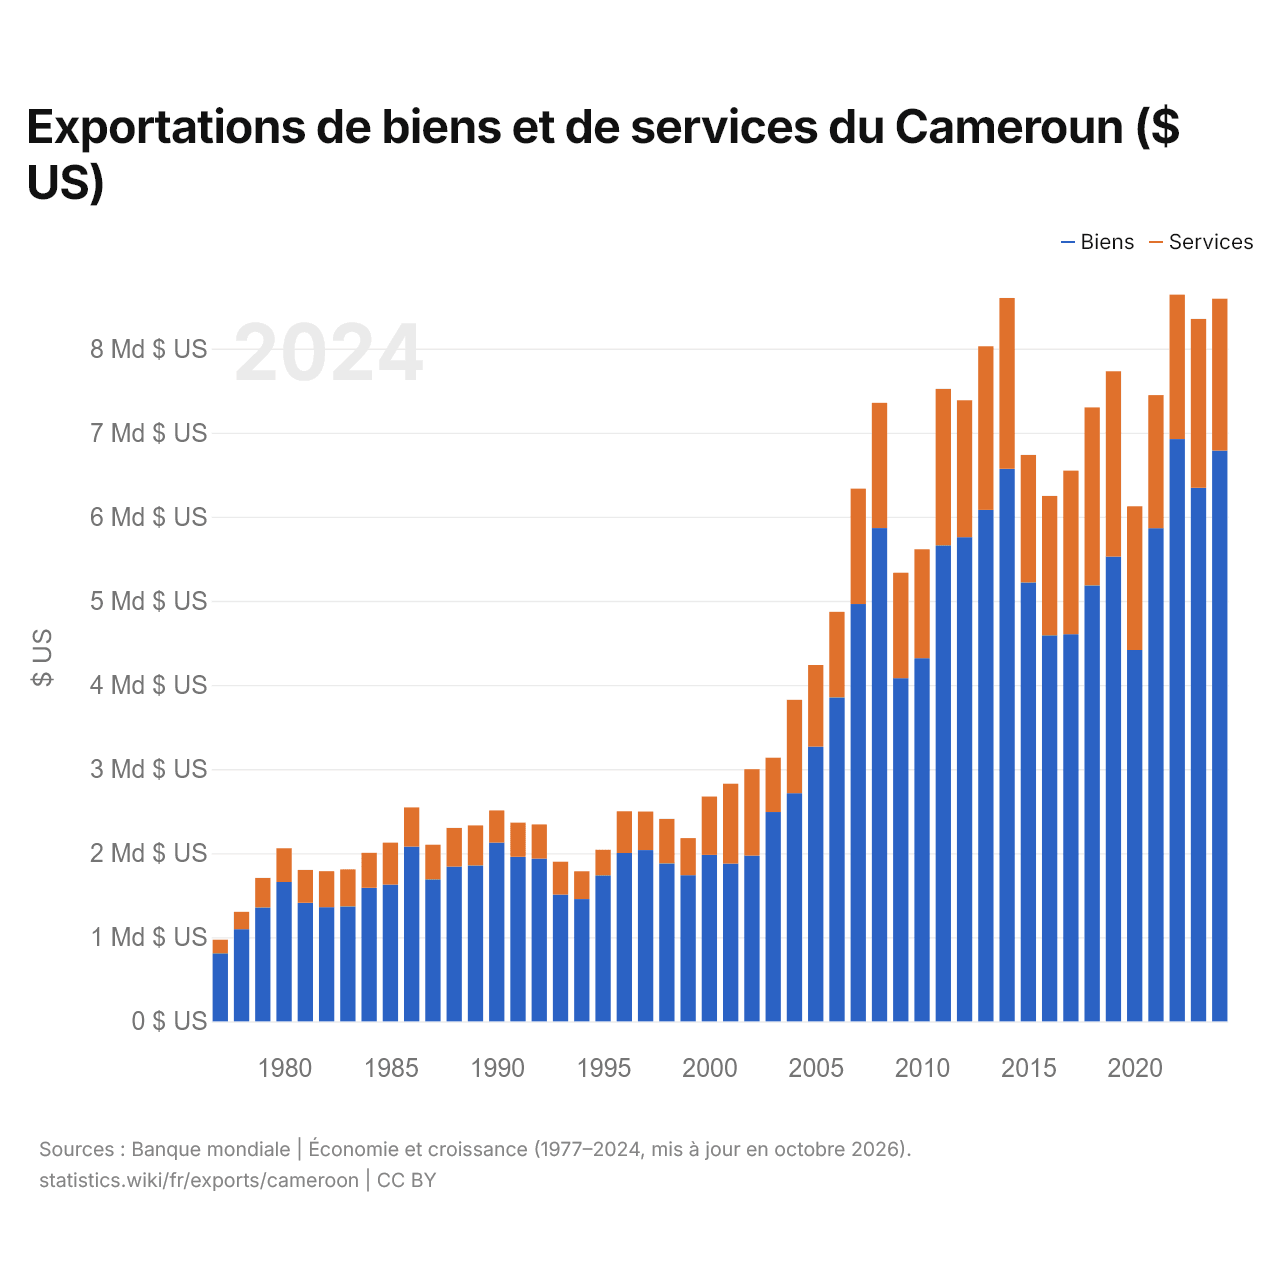
Exportations de biens et de services du Cameroun ($ US)
| Année | $ US | |
|---|---|---|
| Biens | Services | |
| 2024 | 6 788 329 550 $ US | 1 805 072 605 $ US |
| 2023 | 6 344 110 343 $ US | 2 008 496 192 $ US |
| 2022 | 6 924 245 462 $ US | 1 717 094 413 $ US |
| 2021 | 5 864 489 193 $ US | 1 582 034 836 $ US |
| 2020 | 4 415 761 477 $ US | 1 708 683 309 $ US |
| 2019 | 5 525 592 952 $ US | 2 205 210 167 $ US |
| 2018 | 5 184 326 571 $ US | 2 116 751 593 $ US |
| 2017 | 4 603 426 012 $ US | 1 945 173 995 $ US |
| 2016 | 4 590 922 014 $ US | 1 656 915 978 $ US |
| 2015 | 5 219 111 886 $ US | 1 516 546 447 $ US |
| 2014 | 6 571 041 691 $ US | 2 031 078 709 $ US |
| 2013 | 6 081 523 886 $ US | 1 946 390 978 $ US |
| 2012 | 5 756 784 861 $ US | 1 628 104 359 $ US |
| 2011 | 5 660 319 955 $ US | 1 860 521 076 $ US |
| 2010 | 4 317 471 246 $ US | 1 295 766 845 $ US |
| 2009 | 4 080 607 775 $ US | 1 253 932 058 $ US |
| 2008 | 5 865 264 029 $ US | 1 489 656 812 $ US |
| 2007 | 4 962 602 734 $ US | 1 371 777 572 $ US |
| 2006 | 3 852 066 025 $ US | 1 017 434 779 $ US |
| 2005 | 3 266 523 818 $ US | 970 315 572 $ US |
| 2004 | 2 713 046 684 $ US | 1 110 805 146 $ US |
| 2003 | 2 489 016 048 $ US | 646 050 634 $ US |
| 2002 | 1 971 419 814 $ US | 1 027 157 582 $ US |
| 2001 | 1 876 726 282 $ US | 948 464 074 $ US |
| 2000 | 1 979 110 409 $ US | 694 258 887 $ US |
| 1999 | 1 738 499 321 $ US | 440 074 782 $ US |
| 1998 | 1 878 073 849 $ US | 529 217 494 $ US |
| 1997 | 2 036 426 882 $ US | 458 530 656 $ US |
| 1996 | 2 002 277 654 $ US | 495 380 307 $ US |
| 1995 | 1 735 916 523 $ US | 304 378 402 $ US |
| 1994 | 1 454 166 376 $ US | 330 832 937 $ US |
| 1993 | 1 507 720 408 $ US | 390 941 487 $ US |
| 1992 | 1 934 060 664 $ US | 407 455 009 $ US |
| 1991 | 1 957 449 402 $ US | 405 980 841 $ US |
| 1990 | 2 125 357 467 $ US | 382 164 733 $ US |
| 1989 | 1 853 807 568 $ US | 475 724 300 $ US |
| 1988 | 1 841 206 243 $ US | 458 925 021 $ US |
| 1987 | 1 688 646 453 $ US | 411 397 532 $ US |
| 1986 | 2 076 949 866 $ US | 467 188 108 $ US |
| 1985 | 1 626 330 369 $ US | 498 683 441 $ US |
| 1984 | 1 588 944 750 $ US | 414 663 545 $ US |
| 1983 | 1 366 692 255 $ US | 440 763 501 $ US |
| 1982 | 1 357 886 517 $ US | 427 319 927 $ US |
| 1981 | 1 410 583 856 $ US | 389 539 006 $ US |
| 1980 | 1 657 472 250 $ US | 400 985 319 $ US |
| 1979 | 1 354 117 025 $ US | 351 492 206 $ US |
| 1978 | 1 095 827 956 $ US | 206 464 835 $ US |
| 1977 | 809 061 599 $ US | 161 796 038 $ US |
Les exportations de biens du Cameroun s'élèvent à 6,79 milliards de dollars (2024) et celles de services à 1,81 milliard de dollars ; les services représentent 21,0 % du total, contre 16,7 % en 1977.
Le Cameroun dans le classement mondial des exportations, 2025
| Rang | Pays | Exportations | Part mondiale | |
|---|---|---|---|---|
| 116 |
 Zambie |
8,85 Md $US (2024) | 0,03 % | |
| 117 |
 Cuba |
8,77 Md $US (2020) | 0,04 % | |
| 118 |
 Congo-Brazza |
7,83 Md $US | 0,02 % | |
| 119 |
 Cameroun |
7,71 Md $US | 0,02 % | |
| 120 |
 Zimbabwe |
7,50 Md $US (2024) | 0,02 % | |
| 121 |
 Turkménistan |
7,21 Md $US | 0,02 % | |
| 122 |
 Namibie |
6,74 Md $US | 0,02 % |
Exportations de biens et services du Cameroun, % du PIB, 1965–2025
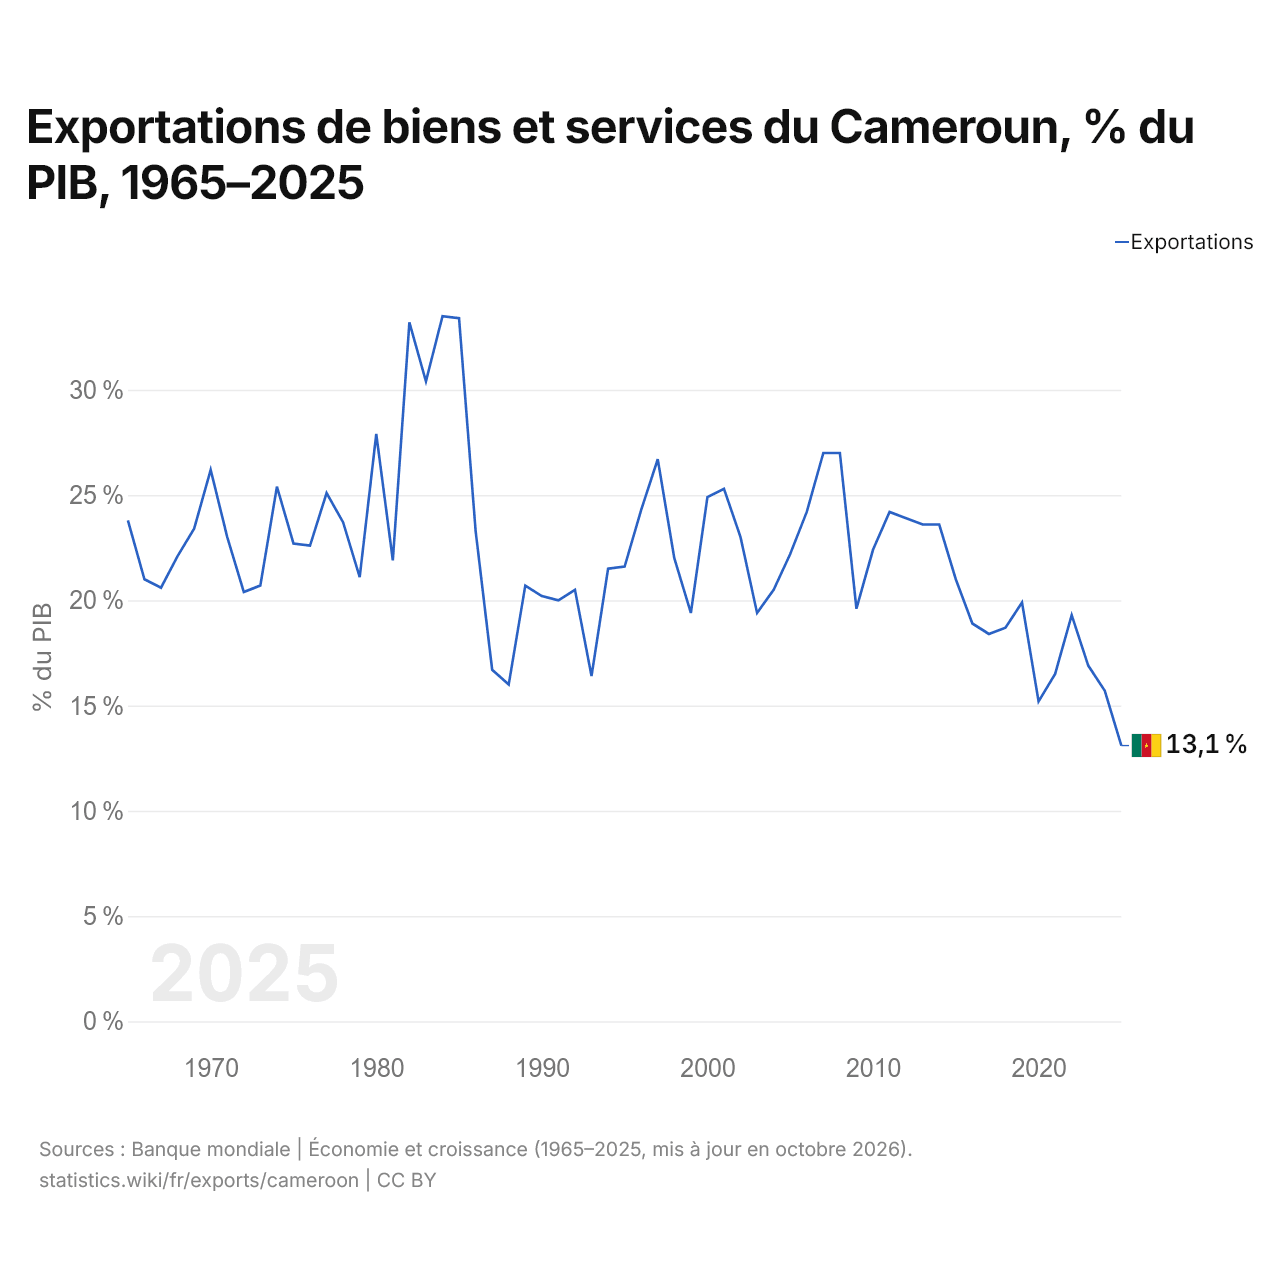
En 2025, les exportations de biens et services du Cameroun équivalaient à 13,1 % de son PIB, contre 23,8 % en 1965. La part la plus élevée a été de 33,5 %, en 1984.
Comparer les exportations du Cameroun avec celles d'autres pays
Sources :
- Banque mondiale | Économie et croissance (1965–2025, mis à jour en octobre 2026)
- TradeMap (2001–2024, mis à jour en octobre 2026)
Creative Commons Attribution (CC BY) : vous pouvez copier, partager, adapter et réutiliser ce contenu, y compris à des fins commerciales, à condition de citer statistics.wiki et d’indiquer les modifications apportées. Les sources citées ci-dessus peuvent avoir leurs propres conditions de licence.