
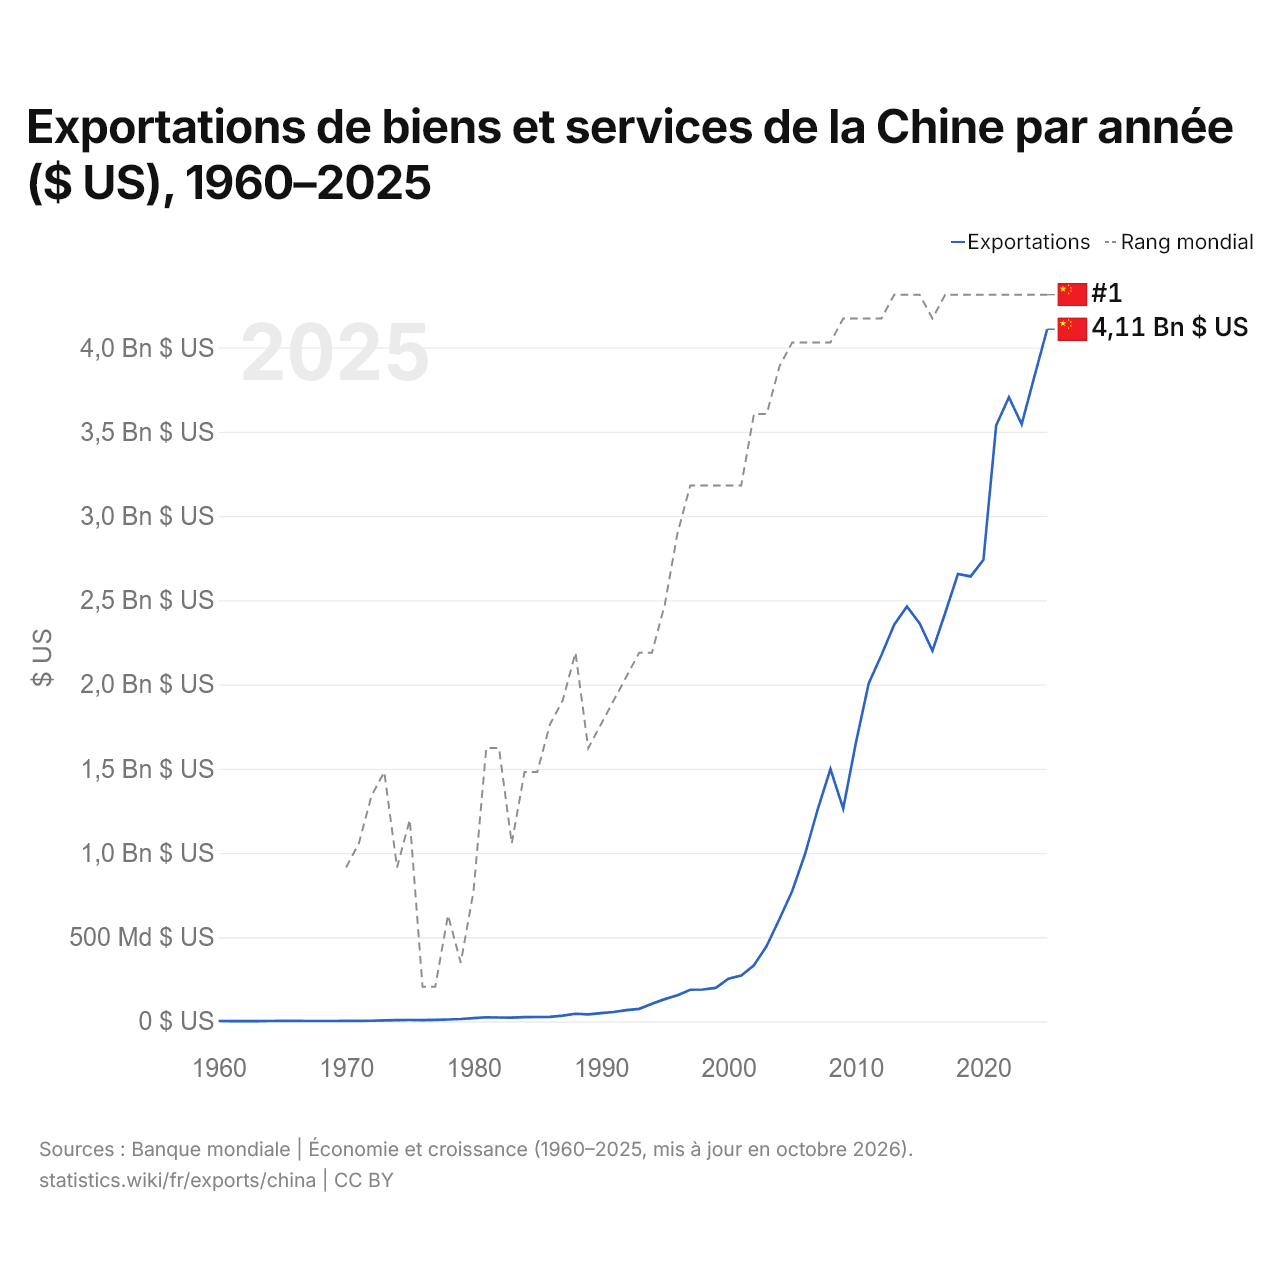
Exportations de biens et services de la Chine par année ($ US), 1960–2025
| Année | $ US | Rang mondial |
|---|---|---|
| Exportations | Rang mondial | |
| 2025 | 4 108 470 555 118 $ US | #1 |
| 2024 | 3 828 873 971 972 $ US | #1 |
| 2023 | 3 544 871 083 631 $ US | #1 |
| 2022 | 3 705 070 541 733 $ US | #1 |
| 2021 | 3 537 510 275 664 $ US | #1 |
| 2020 | 2 739 785 089 628 $ US | #1 |
| 2019 | 2 641 188 436 776 $ US | #1 |
| 2018 | 2 655 609 176 087 $ US | #1 |
| 2017 | 2 424 216 052 098 $ US | #1 |
| 2016 | 2 199 974 853 570 $ US | #2 |
| 2015 | 2 362 097 053 275 $ US | #1 |
| 2014 | 2 462 825 804 851 $ US | #1 |
| 2013 | 2 354 264 539 609 $ US | #1 |
| 2012 | 2 175 069 254 664 $ US | #2 |
| 2011 | 2 006 308 960 976 $ US | #2 |
| 2010 | 1 654 823 329 664 $ US | #2 |
| 2009 | 1 262 664 161 020 $ US | #2 |
| 2008 | 1 497 868 782 940 $ US | #3 |
| 2007 | 1 258 056 795 941 $ US | #3 |
| 2006 | 991 731 387 761 $ US | #3 |
| 2005 | 773 339 005 397 $ US | #3 |
| 2004 | 607 356 934 125 $ US | #4 |
| 2003 | 447 958 253 782 $ US | #6 |
| 2002 | 333 002 310 923 $ US | #6 |
| 2001 | 272 060 010 516 $ US | #9 |
| 2000 | 253 092 089 737 $ US | #9 |
| 1999 | 198 699 399 635 $ US | #9 |
| 1998 | 188 750 394 176 $ US | #9 |
| 1997 | 187 447 040 000 $ US | #9 |
| 1996 | 154 811 877 000 $ US | #11 |
| 1995 | 131 858 826 000 $ US | #14 |
| 1994 | 104 607 445 198 $ US | #16 |
| 1993 | 74 280 328 750 $ US | #16 |
| 1992 | 66 847 400 129 $ US | #17 |
| 1991 | 55 542 659 170 $ US | #18 |
| 1990 | 49 129 758 920 $ US | #19 |
| 1989 | 41 190 793 490 $ US | #20 |
| 1988 | 44 923 701 330 $ US | #16 |
| 1987 | 34 072 853 910 $ US | #18 |
| 1986 | 26 202 580 690 $ US | #19 |
| 1985 | 25 801 403 274 $ US | #21 |
| 1984 | 24 764 305 081 $ US | #21 |
| 1983 | 21 956 304 449 $ US | #24 |
| 1982 | 22 600 124 795 $ US | #20 |
| 1981 | 24 369 970 000 $ US | #20 |
| 1980 | 19 405 720 000 $ US | #26 |
| 1979 | 13 962 640 000 $ US | #29 |
| 1978 | 10 801 140 000 $ US | #27 |
| 1977 | 8 271 070 000 $ US | #30 |
| 1976 | 7 440 600 000 $ US | #30 |
| 1975 | 7 974 570 000 $ US | #23 |
| 1974 | 7 213 067 000 $ US | #25 |
| 1973 | 5 959 279 000 $ US | #21 |
| 1972 | 3 537 210 000 $ US | #22 |
| 1971 | 2 710 416 000 $ US | #24 |
| 1970 | 2 274 220 000 $ US | #25 |
| 1969 | 2 214 390 000 $ US | - |
| 1968 | 2 114 700 000 $ US | - |
| 1967 | 2 155 880 000 $ US | - |
| 1966 | 2 370 600 000 $ US | - |
| 1965 | 2 246 600 000 $ US | - |
| 1964 | 1 938 860 000 $ US | - |
| 1963 | 1 666 350 000 $ US | - |
| 1962 | 1 505 370 000 $ US | - |
| 1961 | 1 505 610 000 $ US | - |
| 1960 | 1 883 060 000 $ US | - |
En 2025, les exportations de biens et services de la Chine s'élevaient à 4,11 billions de dollars, contre 1,88 milliard de dollars en 1960. Le minimum a été de 1,51 milliard de dollars, en 1962. Elles étaient les plus élevées du monde, un rang qu'elles occupent depuis 2017.
En 2025, les exportations de biens et services de la Chine étaient les plus élevées de 44 pays situés en Asie. Les importations de biens et services de la Chine s'élevaient à 3,29 billions de dollars en 2025, au 2e rang mondial. En 2025, les exportations de la Chine dépassaient ses importations de 816 milliards de dollars, soit un excédent commercial.
Exportations de biens de la Chine par catégorie, 2025
Exportations de biens, 2025: 3,78 Bn $US
En 2025, la première catégorie des exportations de biens de la Chine était « machines, électronique et véhicules », avec 53,9 %, suivie de « textiles, vêtements, chaussures, meubles et jouets », avec 17,4 %.
Destinations des exportations de biens de la Chine : les 10 premières, 2025
| Rang | Pays | Exportations de biens | Part | |
|---|---|---|---|---|
| 1 |
 États-Unis |
421 Md $US | 11,1 % | vs USA |
| 2 |
 Vietnam |
199 Md $US | 5,26 % | vs Vietnam |
| 3 |
 Japon |
157 Md $US | 4,17 % | vs Japon |
| 4 |
 Corée du Sud |
145 Md $US | 3,83 % | vs Corée du Sud |
| 5 |
 Inde |
136 Md $US | 3,6 % | vs Inde |
| 6 |
 Allemagne |
118 Md $US | 3,13 % | vs Allemagne |
| 7 |
 Malaisie |
104 Md $US | 2,75 % | vs Malaisie |
| 8 |
 Thaïlande |
104 Md $US | 2,74 % | vs Thaïlande |
| 9 |
 Russie |
103 Md $US | 2,74 % | vs Russie |
| 10 |
 Pays-Bas |
93,9 Md $US | 2,49 % | |
| Autres partenaires et non précisés | 2,20 Bn $US | 58,1 % |
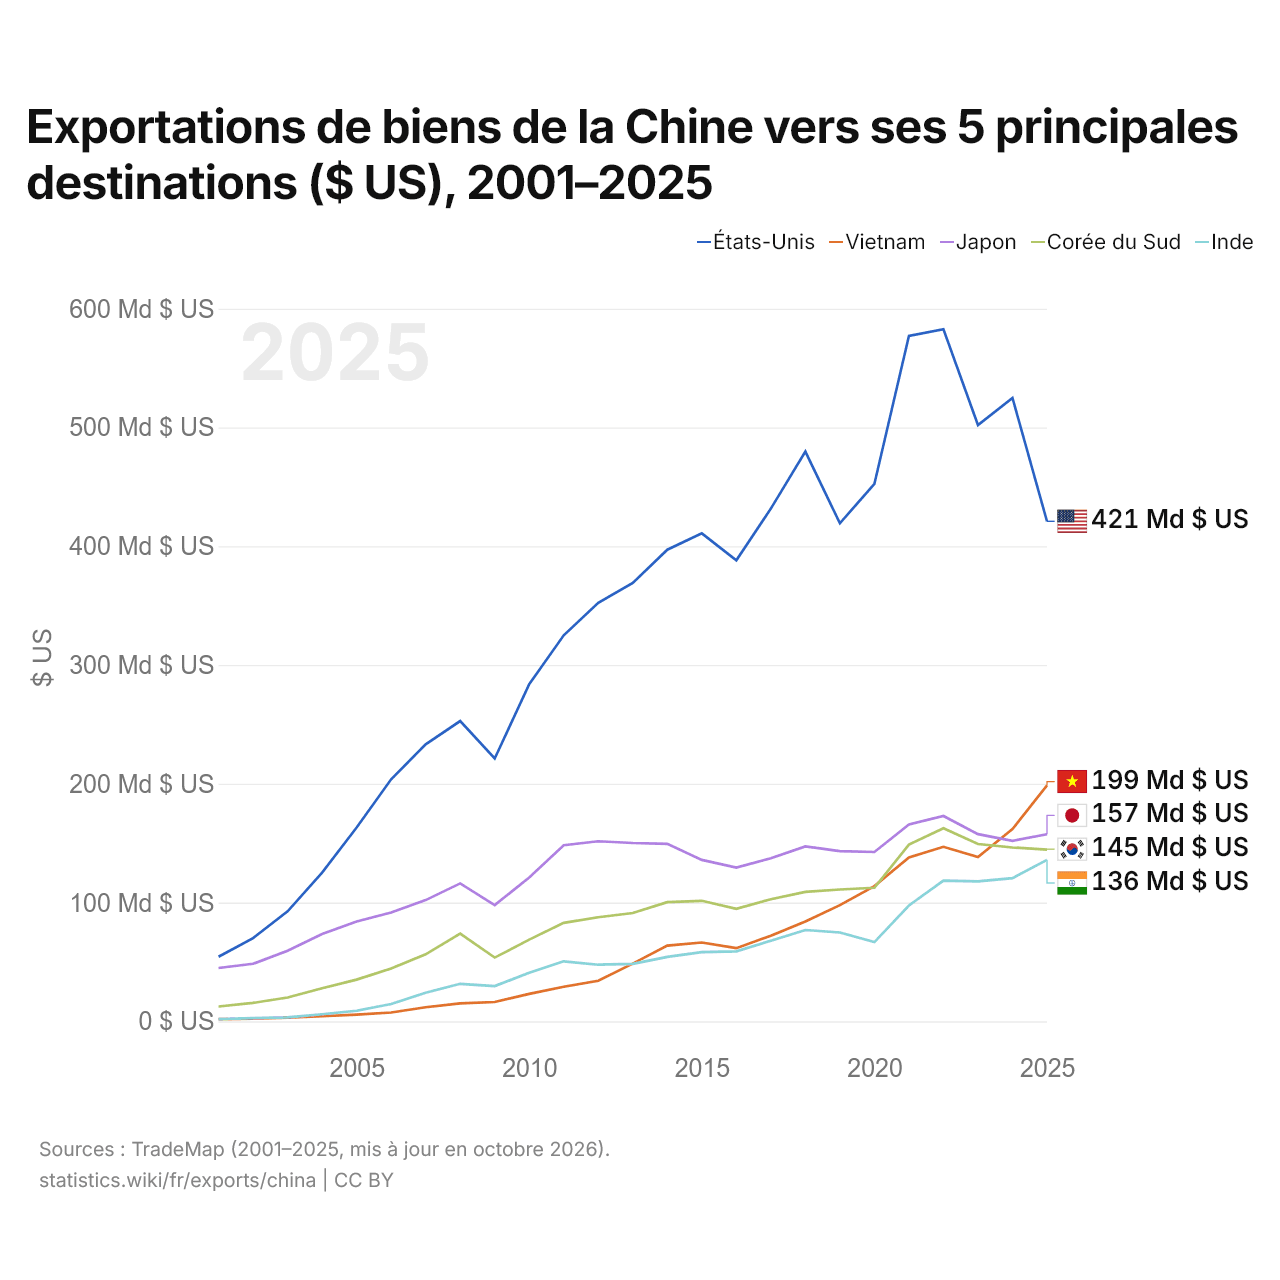
Exportations de biens de la Chine vers ses 5 principales destinations ($ US), 2001–2025
| Année | $ US | ||||
|---|---|---|---|---|---|
| États-Unis | Vietnam | Japon | Corée du Sud | Inde | |
| 2025 | 420 987 792 000 $ US | 198 629 477 000 $ US | 157 475 022 000 $ US | 144 518 988 000 $ US | 135 963 516 000 $ US |
| 2024 | 524 882 933 000 $ US | 161 848 357 000 $ US | 151 988 752 000 $ US | 146 381 517 000 $ US | 120 514 513 000 $ US |
| 2023 | 502 003 682 000 $ US | 138 244 768 000 $ US | 157 584 021 000 $ US | 149 257 115 000 $ US | 117 821 289 000 $ US |
| 2022 | 582 756 120 000 $ US | 146 959 900 000 $ US | 172 927 436 000 $ US | 162 621 428 000 $ US | 118 501 523 000 $ US |
| 2021 | 577 125 500 000 $ US | 137 904 870 000 $ US | 165 822 965 000 $ US | 148 847 027 000 $ US | 97 510 656 000 $ US |
| 2020 | 452 492 932 000 $ US | 113 815 239 000 $ US | 142 596 625 000 $ US | 112 476 216 000 $ US | 66 719 472 000 $ US |
| 2019 | 419 322 837 000 $ US | 97 868 882 000 $ US | 143 244 518 000 $ US | 110 974 410 000 $ US | 74 825 299 000 $ US |
| 2018 | 479 701 581 000 $ US | 84 015 799 000 $ US | 147 235 099 000 $ US | 109 028 749 000 $ US | 76 880 637 000 $ US |
| 2017 | 431 664 273 000 $ US | 72 117 144 000 $ US | 137 368 622 000 $ US | 102 834 413 000 $ US | 67 925 121 000 $ US |
| 2016 | 388 145 454 000 $ US | 61 585 175 000 $ US | 129 450 377 000 $ US | 94 659 513 000 $ US | 58 920 648 000 $ US |
| 2015 | 410 804 880 000 $ US | 66 381 154 000 $ US | 135 896 918 000 $ US | 101 474 642 000 $ US | 58 262 004 000 $ US |
| 2014 | 397 099 250 000 $ US | 63 730 014 000 $ US | 149 391 340 000 $ US | 100 333 451 000 $ US | 54 217 422 000 $ US |
| 2013 | 369 063 859 000 $ US | 48 586 298 000 $ US | 150 132 589 000 $ US | 91 164 951 000 $ US | 48 432 411 000 $ US |
| 2012 | 352 438 221 000 $ US | 34 212 587 000 $ US | 151 626 581 000 $ US | 87 673 764 000 $ US | 47 677 452 000 $ US |
| 2011 | 325 010 988 000 $ US | 29 091 568 000 $ US | 148 268 708 000 $ US | 82 920 308 000 $ US | 50 536 416 000 $ US |
| 2010 | 283 780 323 000 $ US | 23 101 556 000 $ US | 121 043 965 000 $ US | 68 766 311 000 $ US | 40 913 958 000 $ US |
| 2009 | 221 295 020 000 $ US | 16 300 914 000 $ US | 97 910 966 000 $ US | 53 679 877 000 $ US | 29 666 560 000 $ US |
| 2008 | 252 843 531 000 $ US | 15 122 133 000 $ US | 116 132 455 000 $ US | 73 931 990 000 $ US | 31 585 381 000 $ US |
| 2007 | 233 168 790 000 $ US | 11 894 984 000 $ US | 102 062 496 000 $ US | 56 432 016 000 $ US | 24 051 380 000 $ US |
| 2006 | 203 801 046 000 $ US | 7 463 355 000 $ US | 91 622 673 000 $ US | 44 522 207 000 $ US | 14 581 297 000 $ US |
| 2005 | 163 180 459 000 $ US | 5 643 899 000 $ US | 83 986 277 000 $ US | 35 107 776 000 $ US | 8 934 277 000 $ US |
| 2004 | 125 148 956 000 $ US | 4 260 028 000 $ US | 73 509 042 000 $ US | 27 811 560 000 $ US | 5 936 008 000 $ US |
| 2003 | 92 626 296 000 $ US | 3 182 739 000 $ US | 59 408 698 000 $ US | 20 094 765 000 $ US | 3 343 225 000 $ US |
| 2002 | 70 050 092 000 $ US | 2 148 380 000 $ US | 48 433 840 000 $ US | 15 534 561 000 $ US | 2 671 164 000 $ US |
| 2001 | 54 355 080 000 $ US | 1 797 775 000 $ US | 44 940 524 000 $ US | 12 518 778 000 $ US | 1 895 833 000 $ US |
En 2025, les exportations de biens s'élevaient à 421 milliards de dollars vers les États-Unis, 199 milliards de dollars vers le Vietnam, 157 milliards de dollars vers le Japon, 145 milliards de dollars vers la Corée du Sud et 136 milliards de dollars vers l'Inde. Le premier rang des cinq destinations de la Chine est occupé par les États-Unis chaque année depuis 2001. Le changement le plus récent dans leur ordre remonte à 2024, quand les exportations de la Chine vers le Vietnam ont dépassé celles vers le Japon.
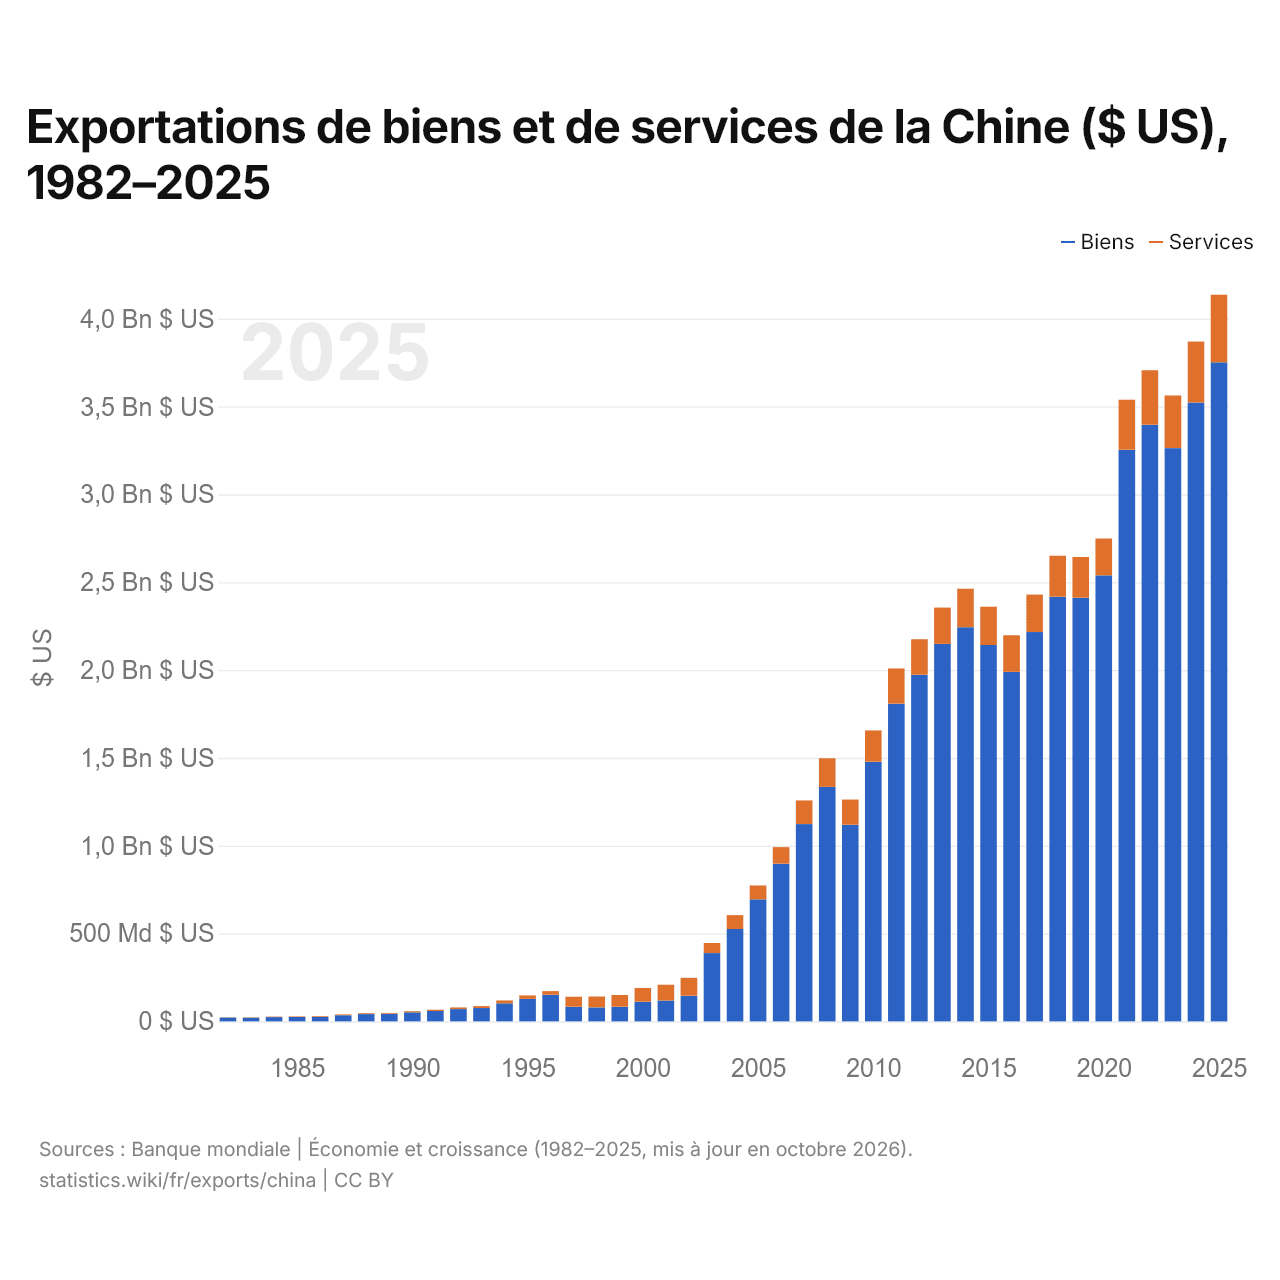
Exportations de biens et de services de la Chine ($ US), 1982–2025
| Année | $ US | |
|---|---|---|
| Biens | Services | |
| 2025 | 3 752 156 909 425 $ US | 384 679 024 469 $ US |
| 2024 | 3 522 642 145 861 $ US | 346 955 325 467 $ US |
| 2023 | 3 263 012 478 022 $ US | 299 866 943 722 $ US |
| 2022 | 3 396 583 884 371 $ US | 309 548 543 966 $ US |
| 2021 | 3 254 767 649 567 $ US | 283 812 561 563 $ US |
| 2020 | 2 539 045 673 400 $ US | 209 687 027 927 $ US |
| 2019 | 2 411 556 213 437 $ US | 231 723 976 284 $ US |
| 2018 | 2 417 442 805 606 $ US | 233 566 796 563 $ US |
| 2017 | 2 216 213 798 035 $ US | 213 063 558 171 $ US |
| 2016 | 1 989 518 638 922 $ US | 208 403 830 208 $ US |
| 2015 | 2 142 753 416 452 $ US | 217 399 035 857 $ US |
| 2014 | 2 243 761 278 997 $ US | 219 140 751 664 $ US |
| 2013 | 2 148 588 935 109 $ US | 207 005 802 689 $ US |
| 2012 | 1 973 516 412 824 $ US | 201 575 599 552 $ US |
| 2011 | 1 807 805 443 489 $ US | 201 047 004 999 $ US |
| 2010 | 1 478 072 761 421 $ US | 178 338 897 361 $ US |
| 2009 | 1 119 090 663 055 $ US | 143 573 497 965 $ US |
| 2008 | 1 334 555 205 547 $ US | 163 313 577 393 $ US |
| 2007 | 1 122 737 097 487 $ US | 135 319 698 454 $ US |
| 2006 | 897 660 405 046 $ US | 94 070 982 714 $ US |
| 2005 | 694 870 272 888 $ US | 78 468 732 509 $ US |
| 2004 | 525 615 268 321 $ US | 79 159 444 759 $ US |
| 2003 | 388 297 641 441 $ US | 57 678 564 819 $ US |
| 2002 | 145 460 205 585 $ US | 102 166 250 960 $ US |
| 2001 | 118 463 000 000 $ US | 90 109 000 000 $ US |
| 2000 | 111 331 687 000 $ US | 78 707 697 000 $ US |
| 1999 | 83 794 000 000 $ US | 66 090 000 000 $ US |
| 1998 | 78 985 000 000 $ US | 62 379 000 000 $ US |
| 1997 | 82 983 000 000 $ US | 57 550 000 000 $ US |
| 1996 | 151 077 000 000 $ US | 20 601 000 000 $ US |
| 1995 | 128 109 690 000 $ US | 19 130 300 000 $ US |
| 1994 | 102 561 000 000 $ US | 16 620 000 000 $ US |
| 1993 | 75 659 000 000 $ US | 11 193 000 000 $ US |
| 1992 | 69 568 000 000 $ US | 9 249 000 000 $ US |
| 1991 | 58 919 000 000 $ US | 6 979 000 000 $ US |
| 1990 | 51 519 000 000 $ US | 5 855 000 000 $ US |
| 1989 | 43 220 000 000 $ US | 4 603 000 000 $ US |
| 1988 | 41 054 000 000 $ US | 4 858 000 000 $ US |
| 1987 | 34 734 000 000 $ US | 4 437 000 000 $ US |
| 1986 | 25 756 000 000 $ US | 3 827 000 000 $ US |
| 1985 | 25 108 000 000 $ US | 3 055 000 000 $ US |
| 1984 | 23 905 000 000 $ US | 2 811 000 000 $ US |
| 1983 | 20 707 000 000 $ US | 2 479 000 000 $ US |
| 1982 | 21 125 000 000 $ US | 2 512 000 000 $ US |
En 2025, les exportations de biens de la Chine s'élevaient à 3,75 billions de dollars et celles de services à 385 milliards de dollars ; les services représentaient 9,3 % du total, contre 10,6 % en 1982.
La Chine dans le classement mondial des exportations, 2025
| Rang | Pays | Exportations | Part mondiale | |
|---|---|---|---|---|
| 1 |
 Chine |
4,11 Bn $US | 11,8 % | |
| 2 |
États-Unis
|
3,43 Bn $US | 9,83 % | vs USA |
| 3 |
Allemagne
|
2,04 Bn $US | 5,85 % | vs Allemagne |
| 4 |
 Royaume-Uni |
1,22 Bn $US | 3,51 % | vs R.-U. |
| 5 |
 France |
1,12 Bn $US | 3,22 % | vs France |
| 6 |
Pays-Bas
|
1,08 Bn $US | 3,08 % | |
| 7 |
 Singapour |
1,07 Bn $US | 3,08 % | vs Singapour |
Exportations de biens et services de la Chine, % du PIB, 1960–2025
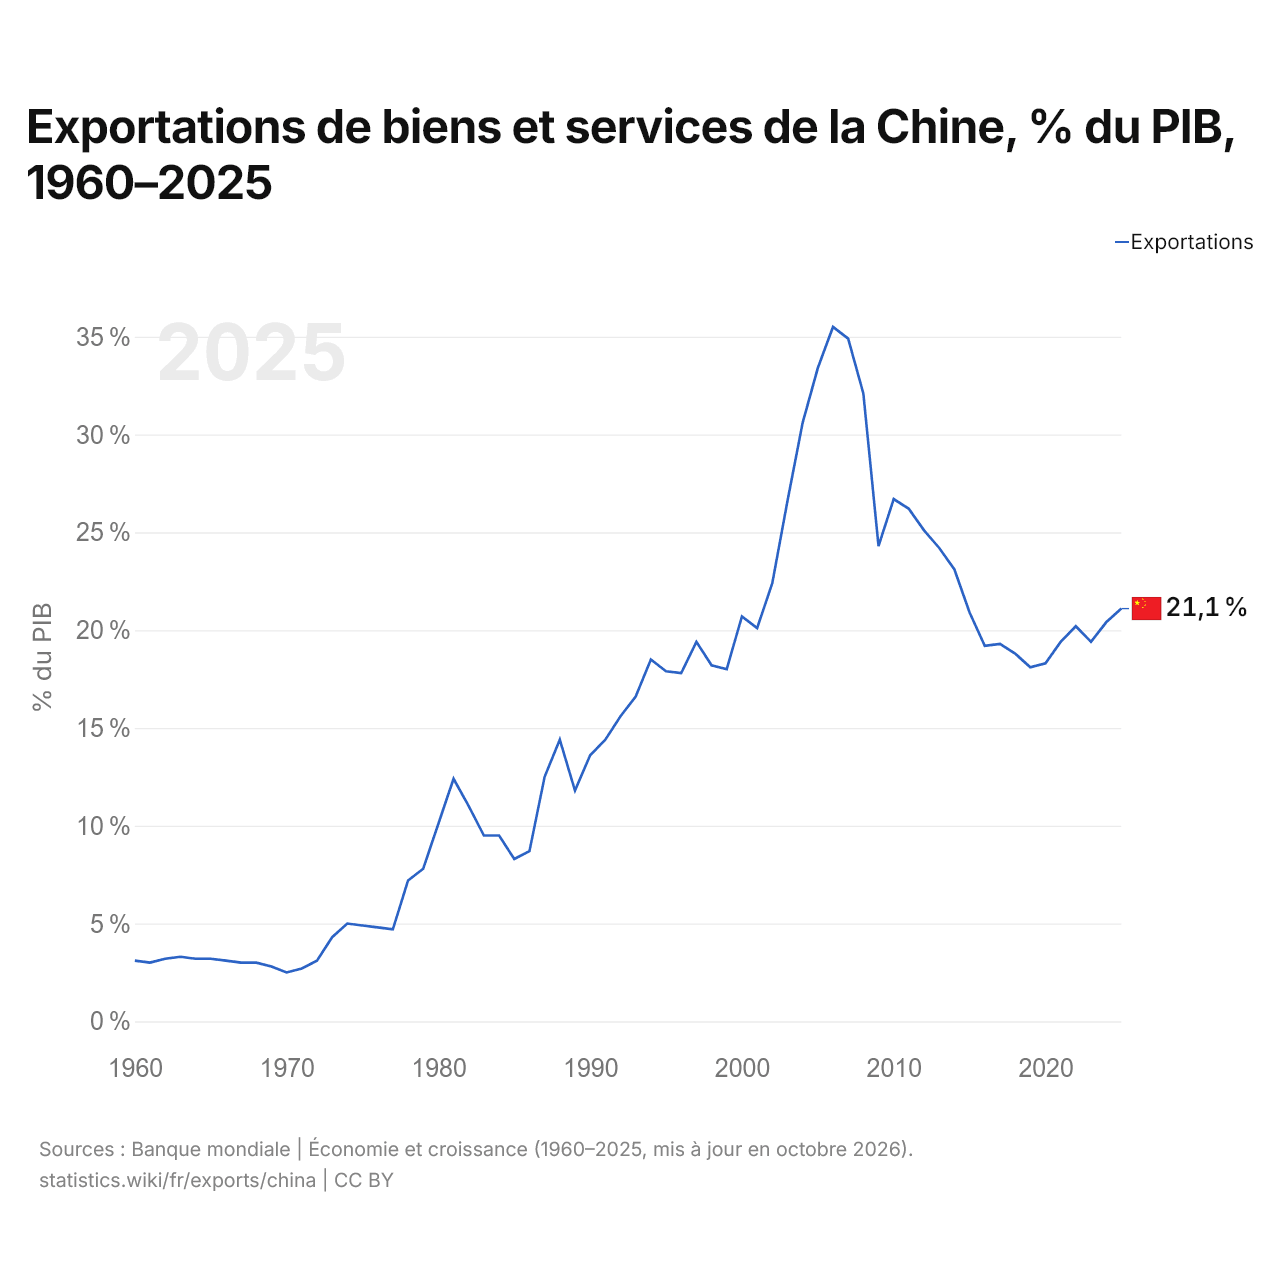
En 2025, les exportations de biens et services de la Chine équivalaient à 21,1 % de son PIB, contre 3,1 % en 1960. La part la plus élevée a été de 35,5 %, en 2006.
Comparer les exportations de la Chine avec celles d'autres pays
Sources :
- TradeMap (2001–2025, mis à jour en octobre 2026)
- Banque mondiale | Économie et croissance (1960–2025, mis à jour en octobre 2026)
Creative Commons Attribution (CC BY) : vous pouvez copier, partager, adapter et réutiliser ce contenu, y compris à des fins commerciales, à condition de citer statistics.wiki et d’indiquer les modifications apportées. Les sources citées ci-dessus peuvent avoir leurs propres conditions de licence.