
Exportations de biens et services de la France par année ($ US), 1960–2025
| Année | $ US | Rang mondial |
|---|---|---|
| Exportations | Rang mondial | |
| 2025 | 1 124 107 902 931 $ US | #5 |
| 2024 | 1 071 066 237 472 $ US | #5 |
| 2023 | 1 053 069 574 155 $ US | #5 |
| 2022 | 1 023 340 977 697 $ US | #5 |
| 2021 | 928 139 254 791 $ US | #5 |
| 2020 | 756 174 143 647 $ US | #7 |
| 2019 | 895 514 342 479 $ US | #5 |
| 2018 | 915 638 789 627 $ US | #6 |
| 2017 | 836 510 836 278 $ US | #5 |
| 2016 | 778 134 181 664 $ US | #6 |
| 2015 | 774 108 364 253 $ US | #6 |
| 2014 | 879 595 852 391 $ US | #5 |
| 2013 | 861 474 336 499 $ US | #4 |
| 2012 | 814 445 012 228 $ US | #6 |
| 2011 | 847 885 600 685 $ US | #5 |
| 2010 | 736 352 883 613 $ US | #5 |
| 2009 | 698 805 241 357 $ US | #4 |
| 2008 | 854 598 937 578 $ US | #5 |
| 2007 | 766 429 838 942 $ US | #6 |
| 2006 | 670 507 475 708 $ US | #6 |
| 2005 | 617 386 391 344 $ US | #6 |
| 2004 | 580 996 794 039 $ US | #6 |
| 2003 | 497 989 403 586 $ US | #4 |
| 2002 | 428 784 967 659 $ US | #5 |
| 2001 | 403 310 126 489 $ US | #5 |
| 2000 | 404 994 866 620 $ US | #5 |
| 1999 | 404 544 866 221 $ US | #5 |
| 1998 | 407 948 410 051 $ US | #4 |
| 1997 | 385 977 860 193 $ US | #5 |
| 1996 | 385 700 089 755 $ US | #4 |
| 1995 | 377 901 958 207 $ US | #4 |
| 1994 | 315 281 781 664 $ US | #4 |
| 1993 | 286 749 942 089 $ US | #4 |
| 1992 | 311 915 489 467 $ US | #4 |
| 1991 | 282 187 071 271 $ US | #4 |
| 1990 | 276 540 778 219 $ US | #4 |
| 1989 | 231 757 351 429 $ US | #4 |
| 1988 | 216 541 900 672 $ US | #4 |
| 1987 | 191 116 992 251 $ US | #4 |
| 1986 | 163 573 823 279 $ US | #4 |
| 1985 | 133 608 336 984 $ US | #5 |
| 1984 | 130 768 670 720 $ US | #4 |
| 1983 | 129 679 318 358 $ US | #4 |
| 1982 | 129 417 606 548 $ US | #5 |
| 1981 | 140 423 536 512 $ US | #5 |
| 1980 | 152 790 282 521 $ US | #3 |
| 1979 | 132 072 926 303 $ US | #3 |
| 1978 | 106 772 238 372 $ US | #4 |
| 1977 | 86 513 238 834 $ US | #4 |
| 1976 | 75 121 414 914 $ US | #4 |
| 1975 | 70 958 390 699 $ US | #3 |
| 1974 | 61 397 981 451 $ US | #4 |
| 1973 | 48 415 733 648 $ US | #3 |
| 1972 | 35 386 996 099 $ US | #4 |
| 1971 | 28 648 395 880 $ US | #4 |
| 1970 | 24 880 359 041 $ US | #4 |
| 1969 | 21 332 691 446 $ US | - |
| 1968 | 18 545 142 886 $ US | - |
| 1967 | 16 945 727 282 $ US | - |
| 1966 | 15 759 518 400 $ US | - |
| 1965 | 14 511 926 398 $ US | - |
| 1964 | 12 972 299 548 $ US | - |
| 1963 | 11 534 712 171 $ US | - |
| 1962 | 10 480 171 412 $ US | - |
| 1961 | 10 206 604 646 $ US | - |
| 1960 | 9 666 380 037 $ US | - |
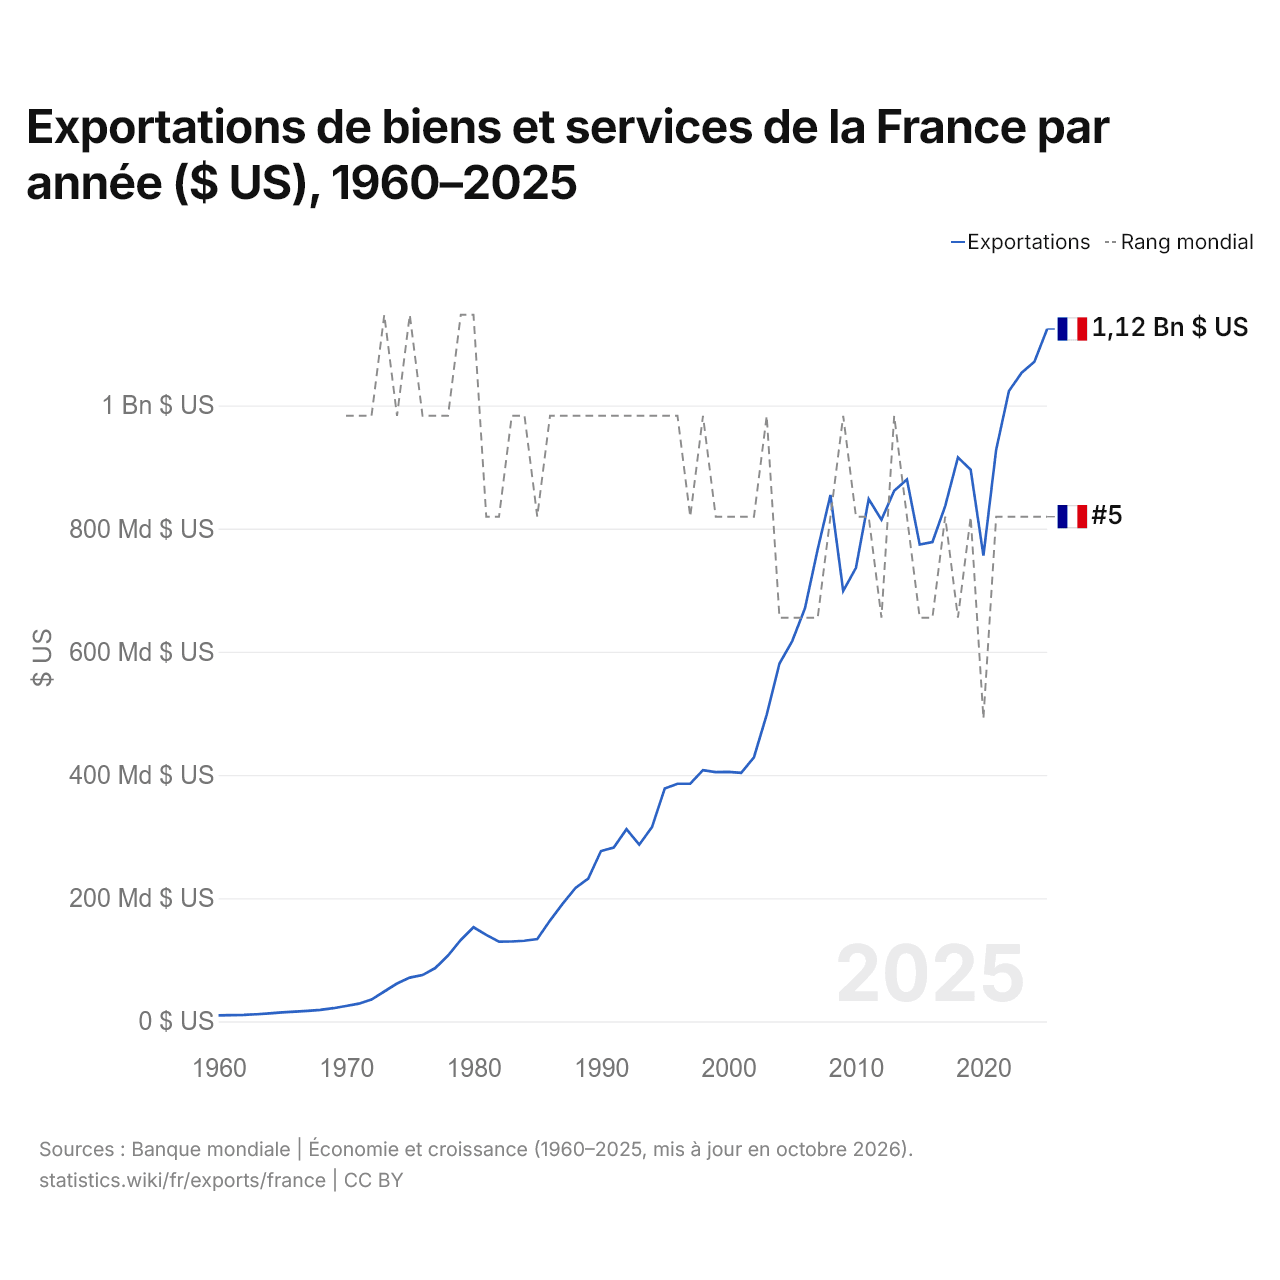
En 2025, les exportations de biens et services de la France s'élevaient à 1,12 billion de dollars, contre 9,67 milliards de dollars en 1960. Elles se classaient au 5e rang mondial, un rang qu'elles occupent depuis 2021. Leur meilleur rang a été le 3e, occupé pour la dernière fois en 1980.
En 2025, les exportations de biens et services de la France étaient les 3es plus élevées de 41 pays situés en Europe, après celles de l'Allemagne et du Royaume-Uni. Les importations de biens et services de la France s'élevaient à 1,14 billion de dollars en 2025, au 5e rang mondial. En 2025, les importations de la France dépassaient ses exportations de 13,7 milliards de dollars, soit un déficit commercial.
Exportations de biens de la France par catégorie, 2025
Exportations de biens, 2025: 671 Md $US
En 2025, la première catégorie des exportations de biens de la France était « machines, électronique et véhicules », avec 39,3 %, suivie de « produits chimiques, pharmaceutiques et plastiques », avec 19,8 %.
Destinations des exportations de biens de la France : les 10 premières, 2025
| Rang | Pays | Exportations de biens | Part | |
|---|---|---|---|---|
| 1 |
 Allemagne |
90,7 Md $US | 13,5 % | vs Allemagne |
| 2 |
 Italie |
54,0 Md $US | 8,05 % | vs Italie |
| 3 |
 États-Unis |
52,8 Md $US | 7,87 % | vs USA |
| 4 |
 Espagne |
50,9 Md $US | 7,59 % | vs Espagne |
| 5 |
 Belgique |
50,5 Md $US | 7,53 % | vs Belgique |
| 6 |
 Royaume-Uni |
44,2 Md $US | 6,59 % | vs R.-U. |
| 7 |
 Pays-Bas |
26,9 Md $US | 4,02 % | vs Pays-Bas |
| 8 |
 Suisse |
26,7 Md $US | 3,98 % | vs Suisse |
| 9 |
 Chine |
26,5 Md $US | 3,96 % | vs Chine |
| 10 |
 Pologne |
18,2 Md $US | 2,71 % | vs Pologne |
| Autres partenaires et non précisés | 229 Md $US | 34,2 % |
Exportations de biens de la France vers ses 5 principales destinations ($ US), 2001–2025
| Année | $ US | ||||
|---|---|---|---|---|---|
| Allemagne | Italie | États-Unis | Espagne | Belgique | |
| 2025 | 90 735 855 000 $ US | 53 996 708 000 $ US | 52 794 111 000 $ US | 50 925 658 000 $ US | 50 496 011 000 $ US |
| 2024 | 84 150 205 000 $ US | 52 364 318 000 $ US | 51 119 550 000 $ US | 47 511 943 000 $ US | 48 936 636 000 $ US |
| 2023 | 89 211 739 000 $ US | 57 343 181 000 $ US | 47 500 583 000 $ US | 48 605 860 000 $ US | 51 893 923 000 $ US |
| 2022 | 86 742 615 000 $ US | 57 237 718 000 $ US | 49 115 231 000 $ US | 46 986 938 000 $ US | 47 976 035 000 $ US |
| 2021 | 82 891 122 000 $ US | 46 373 695 000 $ US | 41 326 105 000 $ US | 44 027 523 000 $ US | 44 000 382 000 $ US |
| 2020 | 70 513 749 000 $ US | 36 845 630 000 $ US | 37 024 993 000 $ US | 35 408 679 000 $ US | 35 297 110 000 $ US |
| 2019 | 78 319 630 000 $ US | 42 133 185 000 $ US | 47 031 801 000 $ US | 41 983 324 000 $ US | 38 416 230 000 $ US |
| 2018 | 83 523 213 000 $ US | 42 852 916 000 $ US | 45 275 665 000 $ US | 44 499 241 000 $ US | 40 433 118 000 $ US |
| 2017 | 77 789 754 000 $ US | 39 808 773 000 $ US | 38 374 871 000 $ US | 40 301 621 000 $ US | 36 562 398 000 $ US |
| 2016 | 79 206 637 000 $ US | 35 841 062 000 $ US | 36 146 087 000 $ US | 36 847 303 000 $ US | 33 362 312 000 $ US |
| 2015 | 79 412 158 000 $ US | 35 517 659 000 $ US | 36 216 096 000 $ US | 36 212 500 000 $ US | 33 730 061 000 $ US |
| 2014 | 94 443 337 000 $ US | 41 257 372 000 $ US | 36 433 613 000 $ US | 40 578 872 000 $ US | 41 487 795 000 $ US |
| 2013 | 93 751 489 000 $ US | 40 455 742 000 $ US | 35 770 720 000 $ US | 38 686 212 000 $ US | 43 697 362 000 $ US |
| 2012 | 92 418 924 000 $ US | 41 271 982 000 $ US | 34 127 755 000 $ US | 37 854 339 000 $ US | 41 006 132 000 $ US |
| 2011 | 97 993 985 000 $ US | 47 604 870 000 $ US | 32 553 291 000 $ US | 42 583 356 000 $ US | 42 259 295 000 $ US |
| 2010 | 84 968 841 000 $ US | 41 887 717 000 $ US | 29 372 020 000 $ US | 38 701 532 000 $ US | 38 863 878 000 $ US |
| 2009 | 77 987 149 000 $ US | 39 681 791 000 $ US | 27 402 136 000 $ US | 37 754 985 000 $ US | 35 798 453 000 $ US |
| 2008 | 97 519 936 000 $ US | 53 063 547 000 $ US | 35 309 756 000 $ US | 50 462 661 000 $ US | 45 905 270 000 $ US |
| 2007 | 85 571 178 000 $ US | 49 882 418 000 $ US | 34 280 082 000 $ US | 52 002 770 000 $ US | 41 138 887 000 $ US |
| 2006 | 77 231 899 000 $ US | 44 173 439 000 $ US | 33 071 276 000 $ US | 47 828 816 000 $ US | 36 141 474 000 $ US |
| 2005 | 68 617 564 000 $ US | 40 509 336 000 $ US | 31 079 787 000 $ US | 44 920 503 000 $ US | 33 405 802 000 $ US |
| 2004 | 62 969 258 000 $ US | 39 095 759 000 $ US | 28 752 597 000 $ US | 42 077 068 000 $ US | 32 307 002 000 $ US |
| 2003 | 53 413 851 000 $ US | 33 195 095 000 $ US | 24 876 423 000 $ US | 36 547 701 000 $ US | 27 477 416 000 $ US |
| 2002 | 44 216 500 000 $ US | 27 620 714 000 $ US | 24 665 977 000 $ US | 29 564 997 000 $ US | 22 019 008 000 $ US |
| 2001 | 41 519 873 000 $ US | 25 427 013 000 $ US | 25 615 806 000 $ US | 27 908 577 000 $ US | 20 429 047 000 $ US |
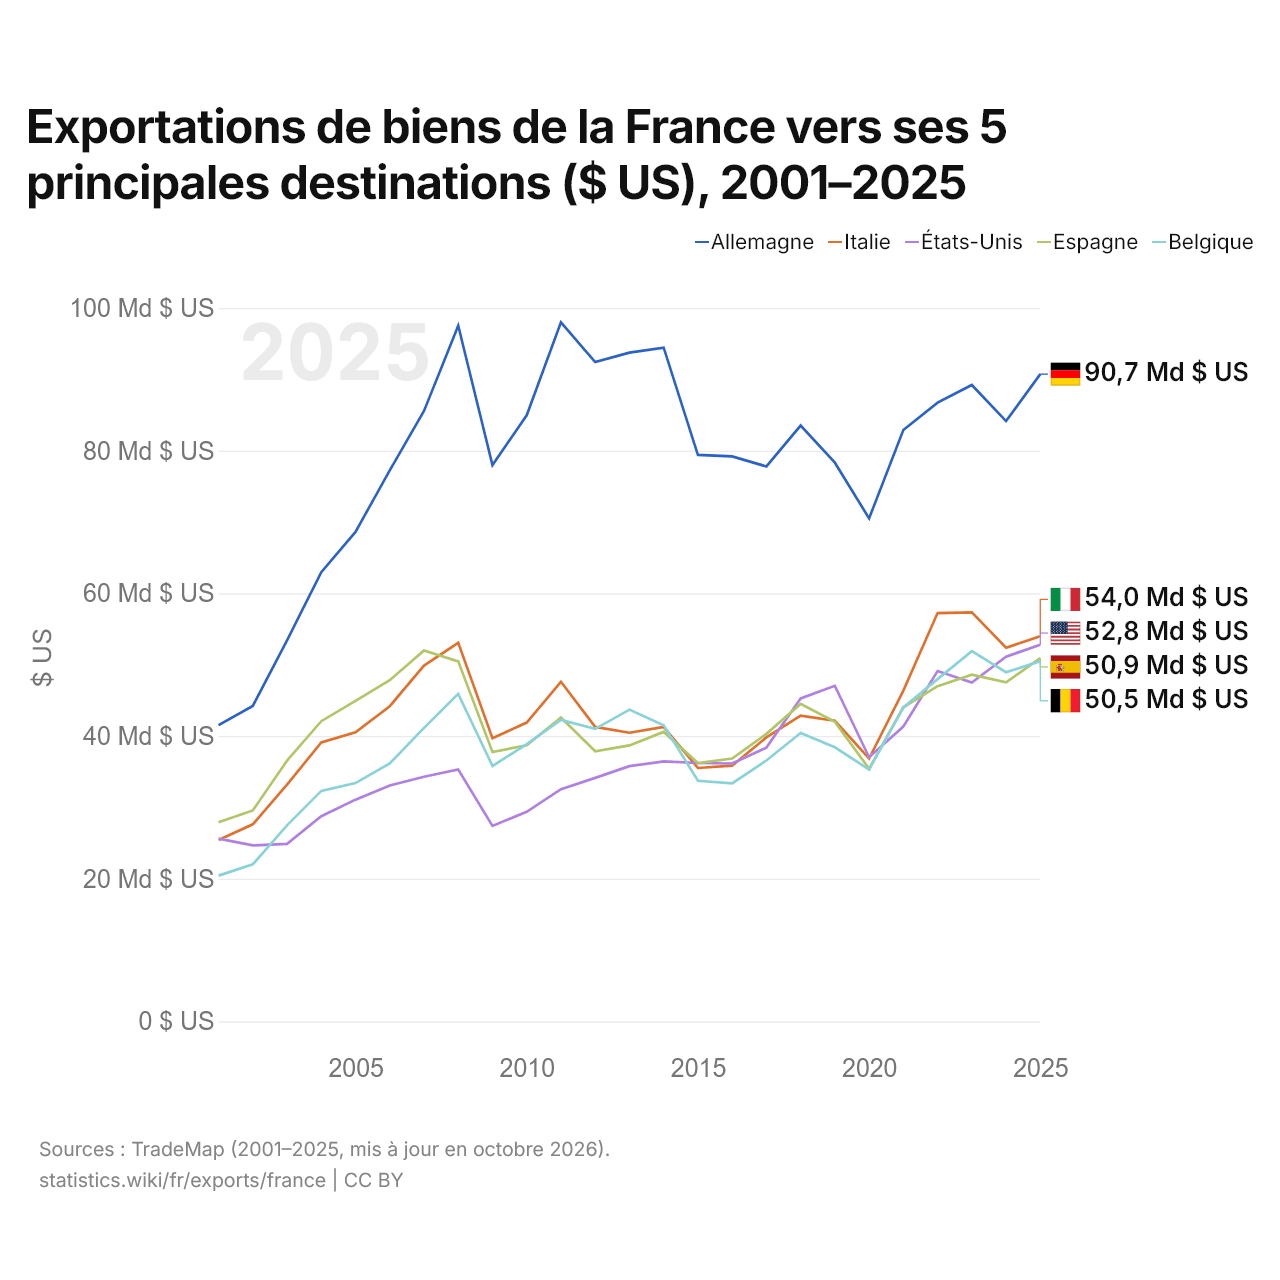
En 2025, les exportations de biens s'élevaient à 90,7 milliards de dollars vers l'Allemagne, 54 milliards de dollars vers l'Italie, 52,8 milliards de dollars vers les États-Unis, 50,9 milliards de dollars vers l'Espagne et 50,5 milliards de dollars vers la Belgique. Le premier rang des cinq destinations de la France est occupé par l'Allemagne chaque année depuis 2001.
Exportations de biens et de services de la France ($ US), 1975–2025
| Année | $ US | |
|---|---|---|
| Biens | Services | |
| 2025 | 705 820 554 321 $ US | 430 502 773 088 $ US |
| 2024 | 666 462 078 222 $ US | 406 931 129 820 $ US |
| 2023 | 677 617 922 536 $ US | 376 571 534 112 $ US |
| 2022 | 659 033 529 675 $ US | 363 169 277 716 $ US |
| 2021 | 611 009 873 536 $ US | 315 752 540 479 $ US |
| 2020 | 498 103 633 177 $ US | 250 391 089 450 $ US |
| 2019 | 587 097 525 044 $ US | 298 901 798 953 $ US |
| 2018 | 601 812 926 601 $ US | 301 583 765 544 $ US |
| 2017 | 550 419 912 757 $ US | 275 524 469 789 $ US |
| 2016 | 509 795 994 479 $ US | 259 174 447 852 $ US |
| 2015 | 515 810 730 688 $ US | 253 518 615 082 $ US |
| 2014 | 585 543 703 397 $ US | 284 720 990 502 $ US |
| 2013 | 583 427 198 820 $ US | 268 324 092 777 $ US |
| 2012 | 560 945 162 396 $ US | 234 313 852 176 $ US |
| 2011 | 586 877 089 234 $ US | 236 833 911 049 $ US |
| 2010 | 507 694 913 963 $ US | 201 658 281 671 $ US |
| 2009 | 471 024 855 362 $ US | 194 161 149 697 $ US |
| 2008 | 603 017 980 307 $ US | 224 346 403 997 $ US |
| 2007 | 544 317 055 319 $ US | 196 787 484 664 $ US |
| 2006 | 485 050 114 198 $ US | 165 492 602 565 $ US |
| 2005 | 439 682 814 150 $ US | 153 205 010 587 $ US |
| 2004 | 416 747 018 805 $ US | 142 859 251 267 $ US |
| 2003 | 359 538 130 319 $ US | 126 072 423 662 $ US |
| 2002 | 305 728 559 510 $ US | 112 976 590 988 $ US |
| 2001 | 291 429 405 978 $ US | 100 368 469 818 $ US |
| 2000 | 293 575 962 152 $ US | 96 662 707 583 $ US |
| 1999 | 296 888 441 562 $ US | 106 289 799 099 $ US |
| 1998 | 297 937 402 621 $ US | 90 045 569 037 $ US |
| 1997 | 282 080 806 733 $ US | 84 780 430 292 $ US |
| 1996 | 274 325 727 602 $ US | 91 049 750 466 $ US |
| 1995 | 270 595 648 090 $ US | 92 121 393 152 $ US |
| 1994 | 224 509 589 368 $ US | 81 821 906 804 $ US |
| 1993 | 199 239 762 515 $ US | 86 181 288 172 $ US |
| 1992 | 226 870 276 572 $ US | 92 337 232 507 $ US |
| 1991 | 208 616 818 435 $ US | 80 654 843 522 $ US |
| 1990 | 207 665 874 441 $ US | 77 669 037 038 $ US |
| 1989 | 171 543 341 410 $ US | 60 472 611 153 $ US |
| 1988 | 160 223 610 884 $ US | 55 449 421 827 $ US |
| 1987 | 141 121 810 766 $ US | 52 321 945 162 $ US |
| 1986 | 118 751 644 653 $ US | 44 847 023 603 $ US |
| 1985 | 95 969 397 582 $ US | 36 539 648 674 $ US |
| 1984 | 92 636 176 310 $ US | 34 749 401 646 $ US |
| 1983 | 89 883 912 826 $ US | 35 328 977 529 $ US |
| 1982 | 91 745 655 500 $ US | 36 681 211 087 $ US |
| 1981 | 100 652 293 434 $ US | 42 281 496 240 $ US |
| 1980 | 107 886 461 275 $ US | 43 731 255 853 $ US |
| 1979 | 95 367 765 892 $ US | 35 524 734 285 $ US |
| 1978 | 75 223 478 834 $ US | 29 738 059 494 $ US |
| 1977 | 61 762 929 556 $ US | 22 550 188 451 $ US |
| 1976 | 54 049 128 455 $ US | 18 924 354 508 $ US |
| 1975 | 50 277 985 062 $ US | 17 970 392 378 $ US |
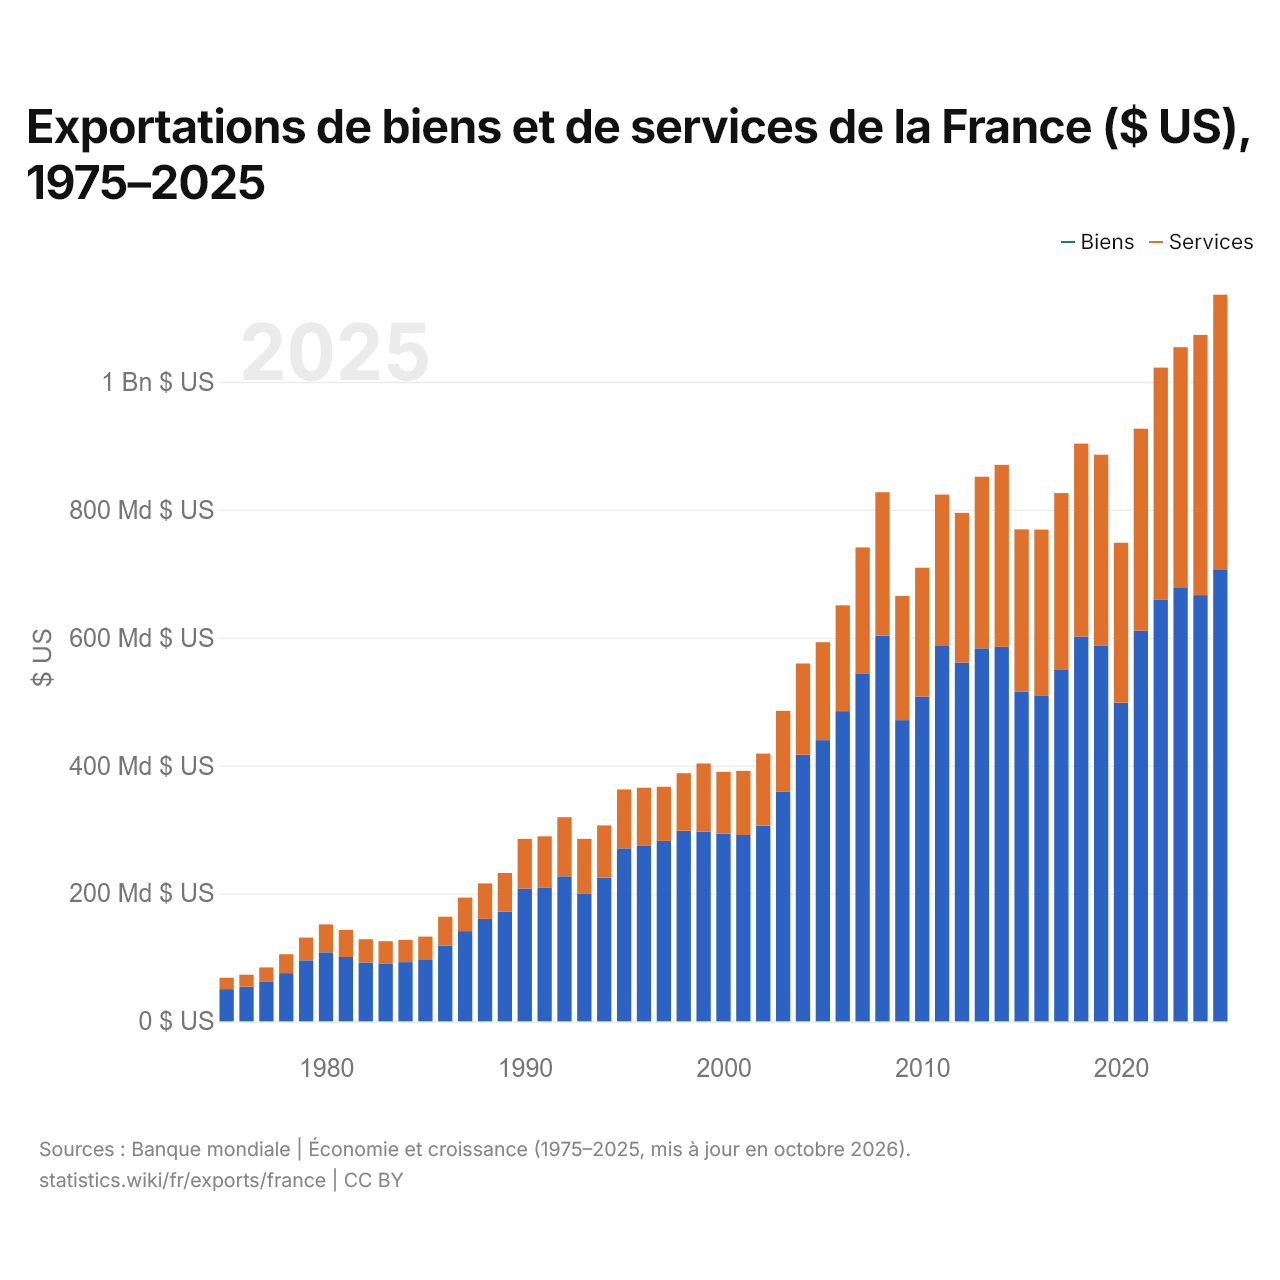
En 2025, les exportations de biens de la France s'élevaient à 706 milliards de dollars et celles de services à 431 milliards de dollars ; les services représentaient 37,9 % du total, contre 26,3 % en 1975.
La France dans le classement mondial des exportations, 2025
| Rang | Pays | Exportations | Part mondiale | |
|---|---|---|---|---|
| 2 |
États-Unis
|
3,43 Bn $US | 9,83 % | vs USA |
| 3 |
Allemagne
|
2,04 Bn $US | 5,85 % | vs Allemagne |
| 4 |
Royaume-Uni
|
1,22 Bn $US | 3,51 % | vs R.-U. |
| 5 |
 France |
1,12 Bn $US | 3,22 % | |
| 6 |
Pays-Bas
|
1,08 Bn $US | 3,08 % | vs Pays-Bas |
| 7 |
 Singapour |
1,07 Bn $US | 3,08 % | vs Singapour |
| 8 |
 Irlande |
1,01 Bn $US | 2,9 % | vs Irlande |
Exportations de biens et services de la France, % du PIB, 1960–2025
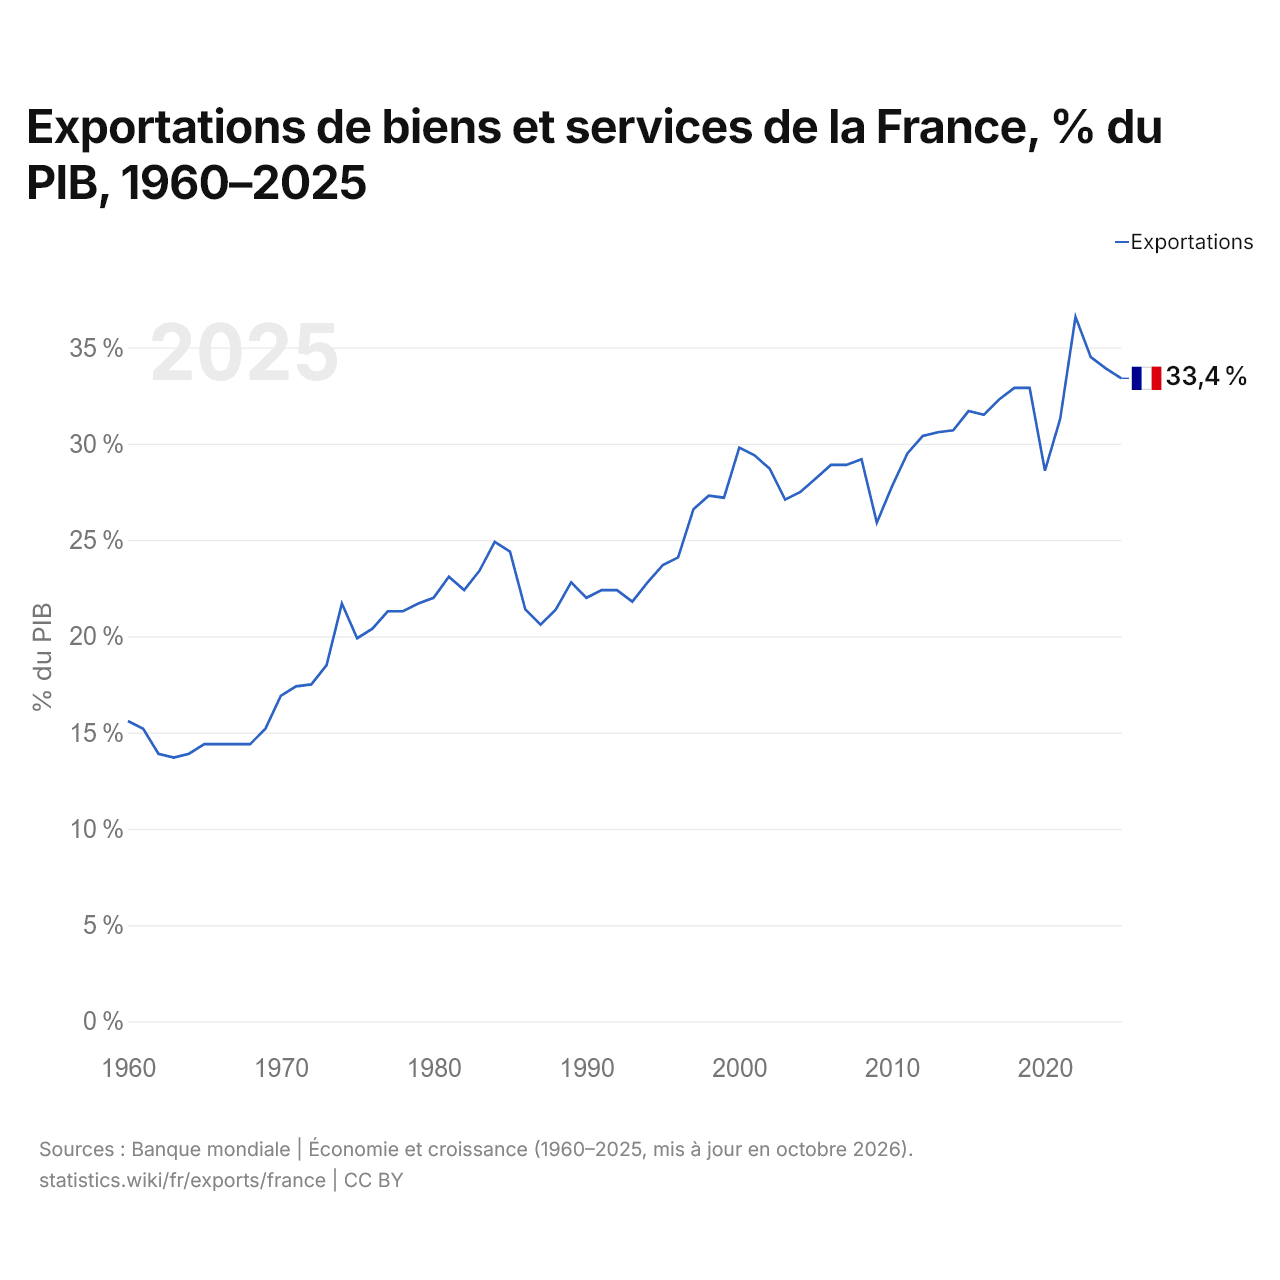
En 2025, les exportations de biens et services de la France équivalaient à 33,4 % de son PIB, contre 15,6 % en 1960. La part la plus élevée a été de 36,6 %, en 2022.
Comparer les exportations de la France avec celles d'autres pays
Sources :
- TradeMap (2001–2025, mis à jour en octobre 2026)
- Banque mondiale | Économie et croissance (1960–2025, mis à jour en octobre 2026)
Creative Commons Attribution (CC BY) : vous pouvez copier, partager, adapter et réutiliser ce contenu, y compris à des fins commerciales, à condition de citer statistics.wiki et d’indiquer les modifications apportées. Les sources citées ci-dessus peuvent avoir leurs propres conditions de licence.