
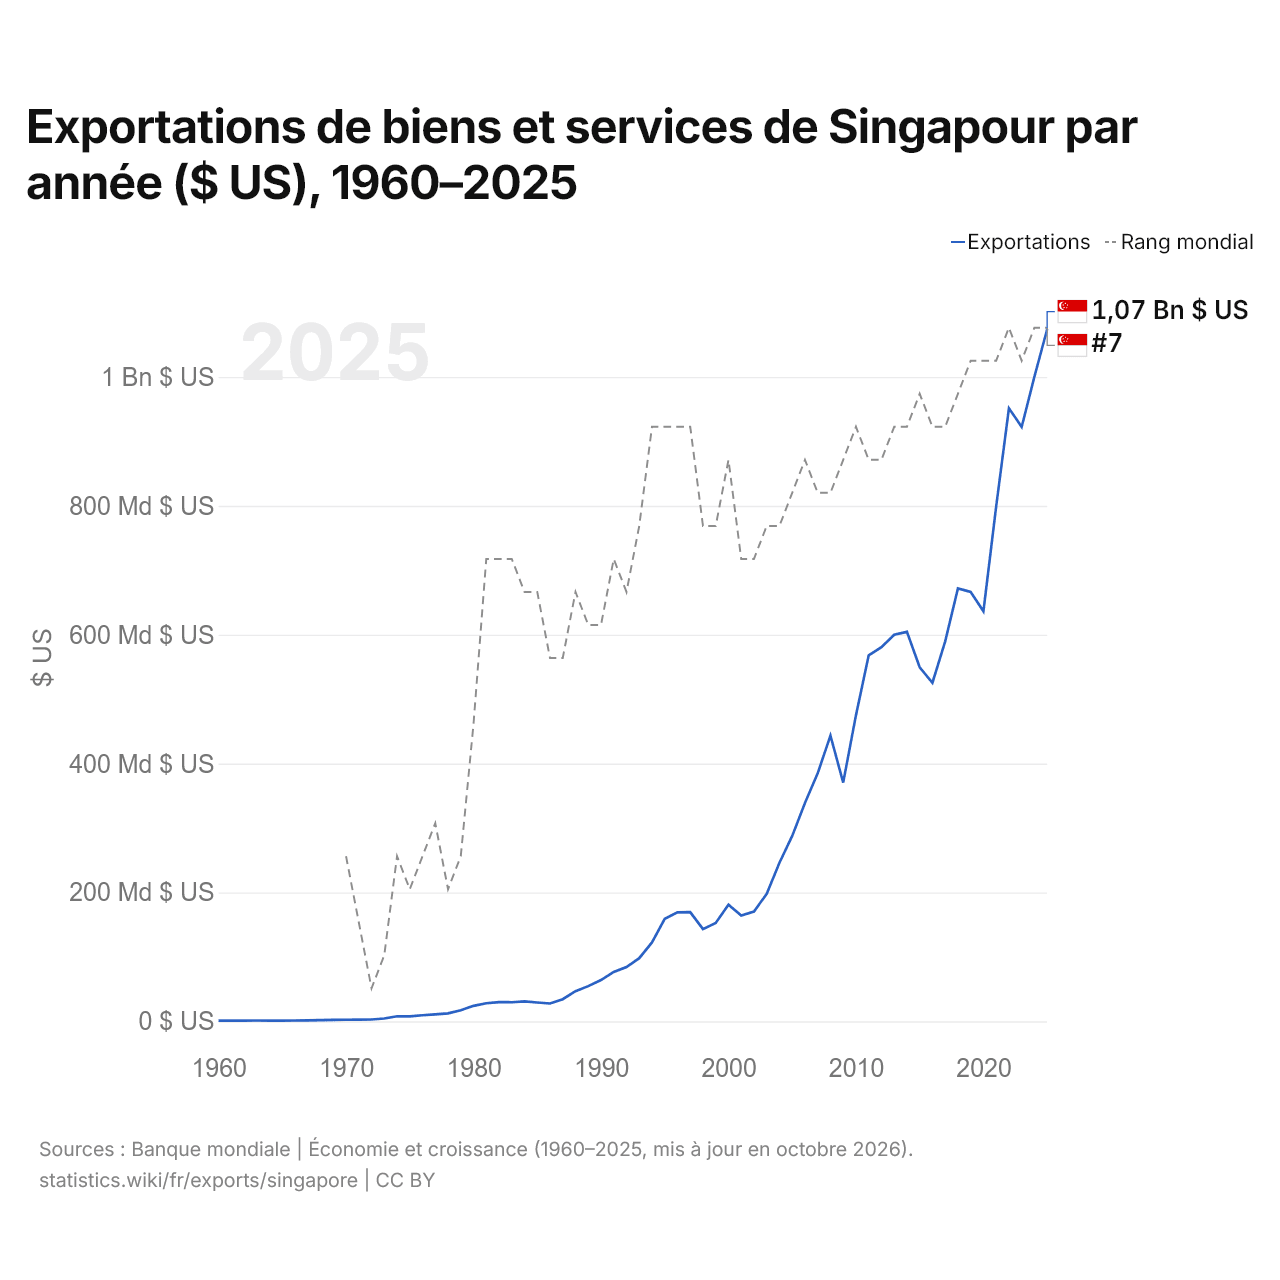
Exportations de biens et services de Singapour par année ($ US), 1960–2025
| Année | $ US | Rang mondial |
|---|---|---|
| Exportations | Rang mondial | |
| 2025 | 1 073 990 898 314 $ US | #7 |
| 2024 | 1 000 563 674 150 $ US | #7 |
| 2023 | 922 325 317 795 $ US | #8 |
| 2022 | 951 421 989 501 $ US | #7 |
| 2021 | 799 113 423 839 $ US | #8 |
| 2020 | 636 352 158 592 $ US | #8 |
| 2019 | 666 302 583 718 $ US | #8 |
| 2018 | 671 713 291 846 $ US | #9 |
| 2017 | 589 508 336 803 $ US | #10 |
| 2016 | 525 391 771 248 $ US | #10 |
| 2015 | 549 421 999 164 $ US | #9 |
| 2014 | 604 391 776 173 $ US | #10 |
| 2013 | 600 013 186 286 $ US | #10 |
| 2012 | 580 505 587 048 $ US | #11 |
| 2011 | 568 009 168 564 $ US | #11 |
| 2010 | 474 817 309 469 $ US | #10 |
| 2009 | 370 525 982 888 $ US | #11 |
| 2008 | 443 371 610 356 $ US | #12 |
| 2007 | 385 006 655 157 $ US | #12 |
| 2006 | 338 926 122 121 $ US | #11 |
| 2005 | 287 771 727 539 $ US | #12 |
| 2004 | 246 116 322 768 $ US | #13 |
| 2003 | 197 818 139 656 $ US | #13 |
| 2002 | 170 350 298 338 $ US | #14 |
| 2001 | 164 227 617 774 $ US | #14 |
| 2000 | 180 961 018 305 $ US | #11 |
| 1999 | 152 507 703 735 $ US | #13 |
| 1998 | 142 983 995 000 $ US | #13 |
| 1997 | 169 506 454 042 $ US | #10 |
| 1996 | 169 132 174 171 $ US | #10 |
| 1995 | 159 046 900 079 $ US | #10 |
| 1994 | 122 465 766 339 $ US | #10 |
| 1993 | 97 966 383 028 $ US | #13 |
| 1992 | 84 309 872 453 $ US | #15 |
| 1991 | 76 631 490 593 $ US | #14 |
| 1990 | 64 045 069 989 $ US | #16 |
| 1989 | 54 623 086 861 $ US | #16 |
| 1988 | 46 864 672 365 $ US | #15 |
| 1987 | 34 308 211 629 $ US | #17 |
| 1986 | 27 644 243 443 $ US | #17 |
| 1985 | 29 160 517 557 $ US | #15 |
| 1984 | 30 900 662 565 $ US | #15 |
| 1983 | 29 675 560 748 $ US | #14 |
| 1982 | 29 812 562 124 $ US | #14 |
| 1981 | 28 092 845 134 $ US | #14 |
| 1980 | 24 031 178 148 $ US | #19 |
| 1979 | 17 169 305 189 $ US | #23 |
| 1978 | 12 436 295 810 $ US | #24 |
| 1977 | 10 772 340 942 $ US | #22 |
| 1976 | 9 457 765 782 $ US | #23 |
| 1975 | 7 724 978 456 $ US | #24 |
| 1974 | 7 804 712 298 $ US | #23 |
| 1973 | 4 373 973 333 $ US | #26 |
| 1972 | 2 904 841 512 $ US | #27 |
| 1971 | 2 704 396 969 $ US | #25 |
| 1970 | 2 420 440 217 $ US | #23 |
| 1969 | 2 193 145 217 $ US | - |
| 1968 | 1 791 540 628 $ US | - |
| 1967 | 1 414 991 409 $ US | - |
| 1966 | 1 351 650 649 $ US | - |
| 1965 | 1 201 122 428 $ US | - |
| 1964 | 1 091 623 601 $ US | - |
| 1963 | 1 295 235 233 $ US | - |
| 1962 | 1 141 211 674 $ US | - |
| 1961 | 1 089 010 264 $ US | - |
| 1960 | 1 147 516 350 $ US | - |
En 2025, les exportations de biens et services de Singapour s'élevaient à 1,07 billion de dollars, contre 1,15 milliard de dollars en 1960. Le minimum a été de 1,09 milliard de dollars, en 1961. Elles se classaient au 7e rang mondial, un rang qu'elles occupent depuis 2024.
En 2025, les exportations de biens et services de Singapour étaient les 2es plus élevées de 44 pays situés en Asie, après celles de la Chine. Les importations de biens et services de Singapour s'élevaient à 860 milliards de dollars en 2025, au 9e rang mondial. En 2025, les exportations de Singapour dépassaient ses importations de 214 milliards de dollars, soit un excédent commercial.
Exportations de biens de Singapour par catégorie, 2025
Exportations de biens, 2025: 566 Md $US
En 2025, la première catégorie des exportations de biens de Singapour était « machines, électronique et véhicules », avec 65,2 %, suivie de « pétrole, gaz, minerais et autres matières premières », avec 9,9 %.
Destinations des exportations de biens de Singapour : les 10 premières, 2025
| Rang | Pays | Exportations de biens | Part | |
|---|---|---|---|---|
| 1 |
 Chine |
61,9 Md $US | 10,9 % | vs Chine |
| 2 |
 Malaisie |
56,0 Md $US | 9,89 % | vs Malaisie |
| 3 |
 États-Unis |
54,5 Md $US | 9,64 % | |
| 4 |
 Indonésie |
38,7 Md $US | 6,84 % | vs Indonésie |
| 5 |
 Thaïlande |
26,7 Md $US | 4,72 % | |
| 6 |
 Corée du Sud |
22,8 Md $US | 4,02 % | vs Corée du Sud |
| 7 |
 Vietnam |
20,5 Md $US | 3,63 % | vs Vietnam |
| 8 |
 Inde |
18,9 Md $US | 3,33 % | |
| 9 |
 Japon |
17,7 Md $US | 3,13 % | vs Japon |
| 10 |
 Australie |
16,9 Md $US | 2,99 % | |
| Autres partenaires et non précisés | 231 Md $US | 40,9 % |
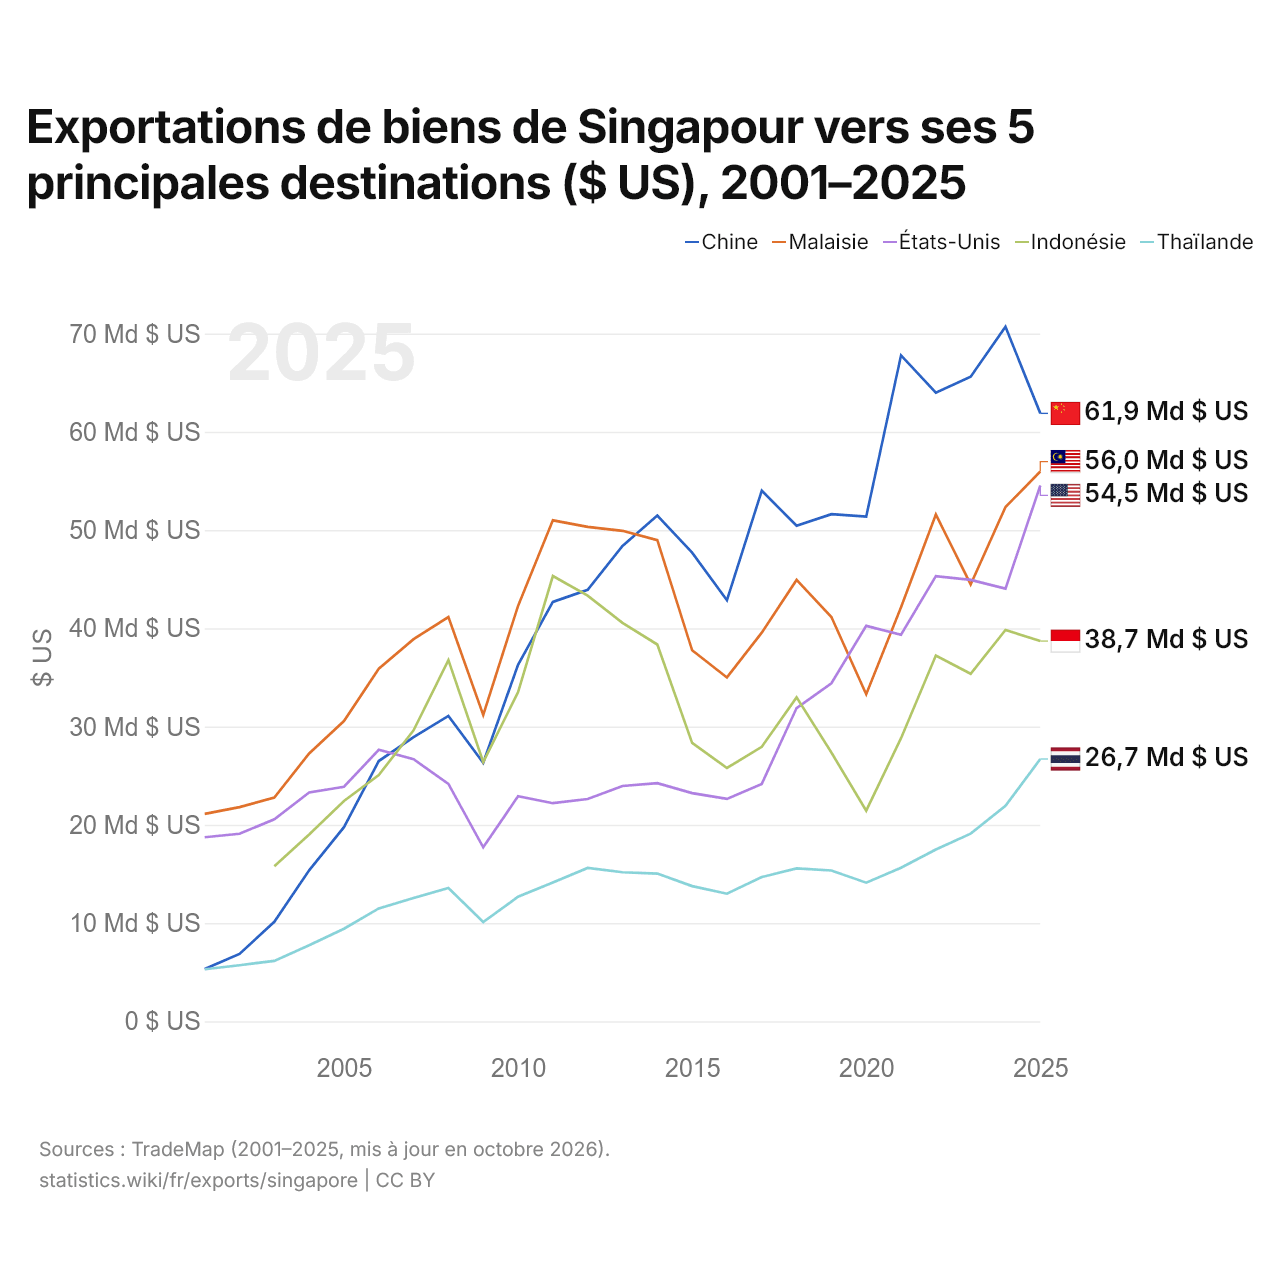
Exportations de biens de Singapour vers ses 5 principales destinations ($ US), 2001–2025
| Année | $ US | ||||
|---|---|---|---|---|---|
| Chine | Malaisie | États-Unis | Indonésie | Thaïlande | |
| 2025 | 61 877 849 000 $ US | 55 964 495 000 $ US | 54 542 264 000 $ US | 38 702 879 000 $ US | 26 699 822 000 $ US |
| 2024 | 70 691 906 000 $ US | 52 347 957 000 $ US | 44 038 274 000 $ US | 39 833 540 000 $ US | 21 929 962 000 $ US |
| 2023 | 65 602 230 000 $ US | 44 465 617 000 $ US | 44 934 443 000 $ US | 35 377 466 000 $ US | 19 102 121 000 $ US |
| 2022 | 63 982 753 000 $ US | 51 596 844 000 $ US | 45 315 933 000 $ US | 37 238 103 000 $ US | 17 496 057 000 $ US |
| 2021 | 67 787 634 000 $ US | 42 155 822 000 $ US | 39 340 475 000 $ US | 28 818 441 000 $ US | 15 631 617 000 $ US |
| 2020 | 51 370 082 000 $ US | 33 283 886 000 $ US | 40 249 832 000 $ US | 21 441 414 000 $ US | 14 113 778 000 $ US |
| 2019 | 51 626 378 000 $ US | 41 158 159 000 $ US | 34 405 723 000 $ US | 27 362 870 000 $ US | 15 356 150 000 $ US |
| 2018 | 50 437 351 000 $ US | 44 927 457 000 $ US | 31 888 993 000 $ US | 32 976 178 000 $ US | 15 568 272 000 $ US |
| 2017 | 54 009 741 000 $ US | 39 558 626 000 $ US | 24 170 044 000 $ US | 27 936 678 000 $ US | 14 683 519 000 $ US |
| 2016 | 42 856 529 000 $ US | 35 001 784 000 $ US | 22 639 327 000 $ US | 25 784 231 000 $ US | 12 987 952 000 $ US |
| 2015 | 47 708 908 000 $ US | 37 764 252 000 $ US | 23 224 952 000 $ US | 28 345 112 000 $ US | 13 762 454 000 $ US |
| 2014 | 51 482 423 000 $ US | 48 980 371 000 $ US | 24 237 918 000 $ US | 38 356 378 000 $ US | 15 041 799 000 $ US |
| 2013 | 48 382 810 000 $ US | 49 925 677 000 $ US | 23 952 300 000 $ US | 40 557 729 000 $ US | 15 176 416 000 $ US |
| 2012 | 43 927 446 000 $ US | 50 328 955 000 $ US | 22 633 860 000 $ US | 43 333 841 000 $ US | 15 610 248 000 $ US |
| 2011 | 42 687 205 000 $ US | 50 992 457 000 $ US | 22 202 457 000 $ US | 45 324 380 000 $ US | 14 122 972 000 $ US |
| 2010 | 36 290 354 000 $ US | 42 285 025 000 $ US | 22 906 395 000 $ US | 33 501 648 000 $ US | 12 679 512 000 $ US |
| 2009 | 26 311 819 000 $ US | 31 189 843 000 $ US | 17 709 243 000 $ US | 26 389 032 000 $ US | 10 113 044 000 $ US |
| 2008 | 31 085 304 000 $ US | 41 144 667 000 $ US | 24 169 856 000 $ US | 36 770 212 000 $ US | 13 570 217 000 $ US |
| 2007 | 28 927 264 000 $ US | 38 894 240 000 $ US | 26 675 303 000 $ US | 29 614 030 000 $ US | 12 549 079 000 $ US |
| 2006 | 26 495 629 000 $ US | 35 898 027 000 $ US | 27 635 189 000 $ US | 25 075 389 000 $ US | 11 494 251 000 $ US |
| 2005 | 19 757 038 000 $ US | 30 568 268 000 $ US | 23 870 564 000 $ US | 22 432 270 000 $ US | 9 425 947 000 $ US |
| 2004 | 15 371 495 000 $ US | 27 268 119 000 $ US | 23 293 558 000 $ US | 19 021 186 000 $ US | 7 740 070 000 $ US |
| 2003 | 10 128 127 000 $ US | 22 780 449 000 $ US | 20 557 839 000 $ US | 15 780 561 000 $ US | 6 150 250 000 $ US |
| 2002 | 6 858 759 000 $ US | 21 805 453 000 $ US | 19 093 799 000 $ US | - | 5 710 467 000 $ US |
| 2001 | 5 330 288 000 $ US | 21 120 879 000 $ US | 18 741 000 000 $ US | - | 5 297 679 000 $ US |
En 2025, les exportations de biens s'élevaient à 61,9 milliards de dollars vers la Chine, 56 milliards de dollars vers la Malaisie, 54,5 milliards de dollars vers les États-Unis, 38,7 milliards de dollars vers l'Indonésie et 26,7 milliards de dollars vers la Thaïlande. Le premier rang des cinq destinations de Singapour est occupé par la Chine depuis 2014. Le changement le plus récent dans leur ordre remonte à 2024, quand les exportations de Singapour vers la Malaisie ont dépassé celles vers les États-Unis.
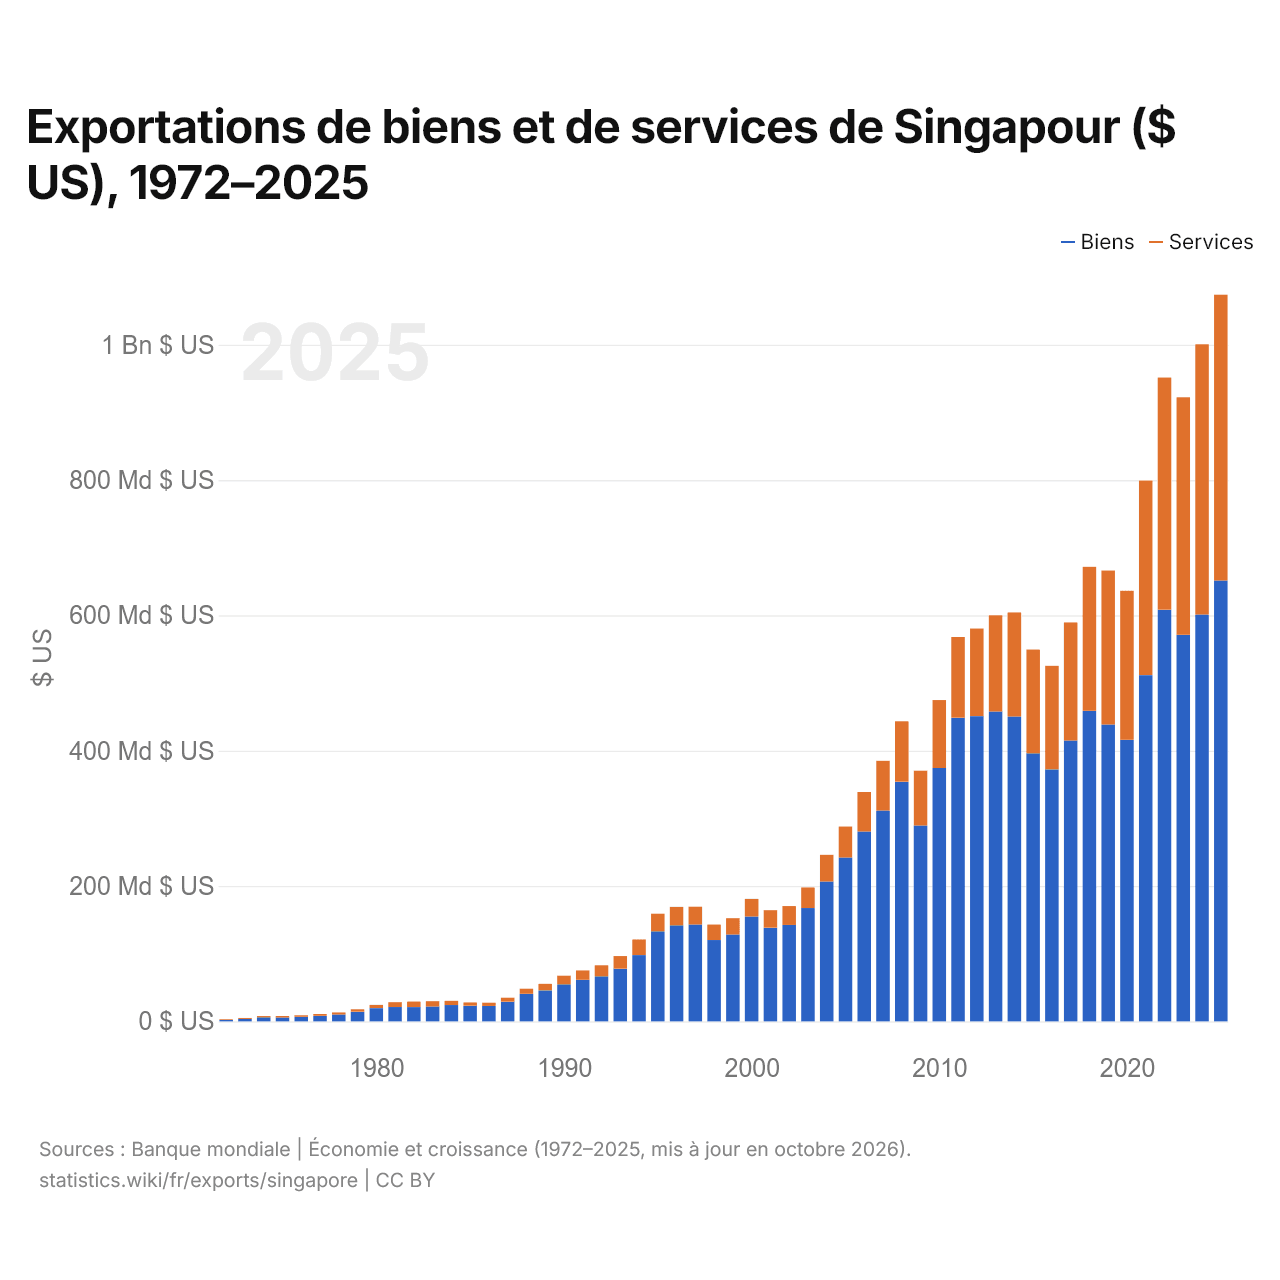
Exportations de biens et de services de Singapour ($ US), 1972–2025
| Année | $ US | |
|---|---|---|
| Biens | Services | |
| 2025 | 651 643 504 532 $ US | 422 347 393 782 $ US |
| 2024 | 601 132 287 275 $ US | 399 431 137 276 $ US |
| 2023 | 571 326 887 273 $ US | 350 998 659 484 $ US |
| 2022 | 608 407 108 317 $ US | 343 015 111 219 $ US |
| 2021 | 511 650 857 845 $ US | 287 462 367 726 $ US |
| 2020 | 416 046 071 426 $ US | 220 306 240 903 $ US |
| 2019 | 438 697 389 721 $ US | 227 605 031 185 $ US |
| 2018 | 459 038 310 649 $ US | 212 675 147 194 $ US |
| 2017 | 415 152 741 822 $ US | 174 355 594 982 $ US |
| 2016 | 372 388 950 195 $ US | 153 002 682 765 $ US |
| 2015 | 396 222 355 573 $ US | 153 199 643 591 $ US |
| 2014 | 450 614 735 014 $ US | 153 777 041 159 $ US |
| 2013 | 457 985 455 127 $ US | 142 027 731 160 $ US |
| 2012 | 451 056 600 365 $ US | 129 448 892 057 $ US |
| 2011 | 448 740 757 582 $ US | 119 268 466 442 $ US |
| 2010 | 374 434 748 596 $ US | 100 382 444 796 $ US |
| 2009 | 289 514 843 755 $ US | 81 011 212 132 $ US |
| 2008 | 354 207 416 159 $ US | 89 164 246 425 $ US |
| 2007 | 311 490 399 343 $ US | 73 516 340 968 $ US |
| 2006 | 280 600 885 290 $ US | 58 325 165 730 $ US |
| 2005 | 242 166 669 921 $ US | 45 604 971 168 $ US |
| 2004 | 206 597 471 545 $ US | 39 518 802 686 $ US |
| 2003 | 167 415 905 330 $ US | 30 402 196 478 $ US |
| 2002 | 142 462 058 560 $ US | 27 888 208 066 $ US |
| 2001 | 138 394 366 315 $ US | 25 833 297 288 $ US |
| 2000 | 154 942 564 517 $ US | 26 018 418 799 $ US |
| 1999 | 128 327 941 521 $ US | 24 179 792 207 $ US |
| 1998 | 120 106 237 944 $ US | 22 877 785 534 $ US |
| 1997 | 143 057 492 927 $ US | 26 448 980 142 $ US |
| 1996 | 141 901 280 637 $ US | 27 230 913 526 $ US |
| 1995 | 133 018 431 960 $ US | 26 028 468 119 $ US |
| 1994 | 97 918 996 494 $ US | 23 043 984 696 $ US |
| 1993 | 77 857 973 572 $ US | 18 597 209 107 $ US |
| 1992 | 66 565 082 158 $ US | 16 200 270 110 $ US |
| 1991 | 61 332 870 250 $ US | 13 823 275 737 $ US |
| 1990 | 54 678 553 038 $ US | 12 810 798 882 $ US |
| 1989 | 45 699 945 734 $ US | 9 658 310 224 $ US |
| 1988 | 40 702 982 720 $ US | 7 563 014 771 $ US |
| 1987 | 29 096 099 209 $ US | 5 794 537 785 $ US |
| 1986 | 22 738 413 259 $ US | 4 806 154 082 $ US |
| 1985 | 23 186 600 917 $ US | 4 687 862 192 $ US |
| 1984 | 24 090 948 162 $ US | 6 153 064 813 $ US |
| 1983 | 21 894 418 032 $ US | 7 834 173 355 $ US |
| 1982 | 21 015 642 349 $ US | 8 127 942 434 $ US |
| 1981 | 21 090 157 507 $ US | 7 183 726 923 $ US |
| 1980 | 19 429 683 402 $ US | 4 855 669 503 $ US |
| 1979 | 14 247 950 739 $ US | 3 595 212 822 $ US |
| 1978 | 10 123 019 759 $ US | 3 127 054 453 $ US |
| 1977 | 8 245 060 263 $ US | 2 594 080 512 $ US |
| 1976 | 6 654 007 914 $ US | 2 363 567 071 $ US |
| 1975 | 5 480 959 813 $ US | 2 415 974 361 $ US |
| 1974 | 5 905 534 431 $ US | 1 931 168 441 $ US |
| 1973 | 3 598 567 574 $ US | 1 377 490 810 $ US |
| 1972 | 2 169 600 001 $ US | 960 711 111 $ US |
En 2025, les exportations de biens de Singapour s'élevaient à 652 milliards de dollars et celles de services à 422 milliards de dollars ; les services représentaient 39,3 % du total, contre 30,7 % en 1972.
Singapour dans le classement mondial des exportations, 2025





Exportations de biens et services de Singapour, % du PIB, 1960–2025
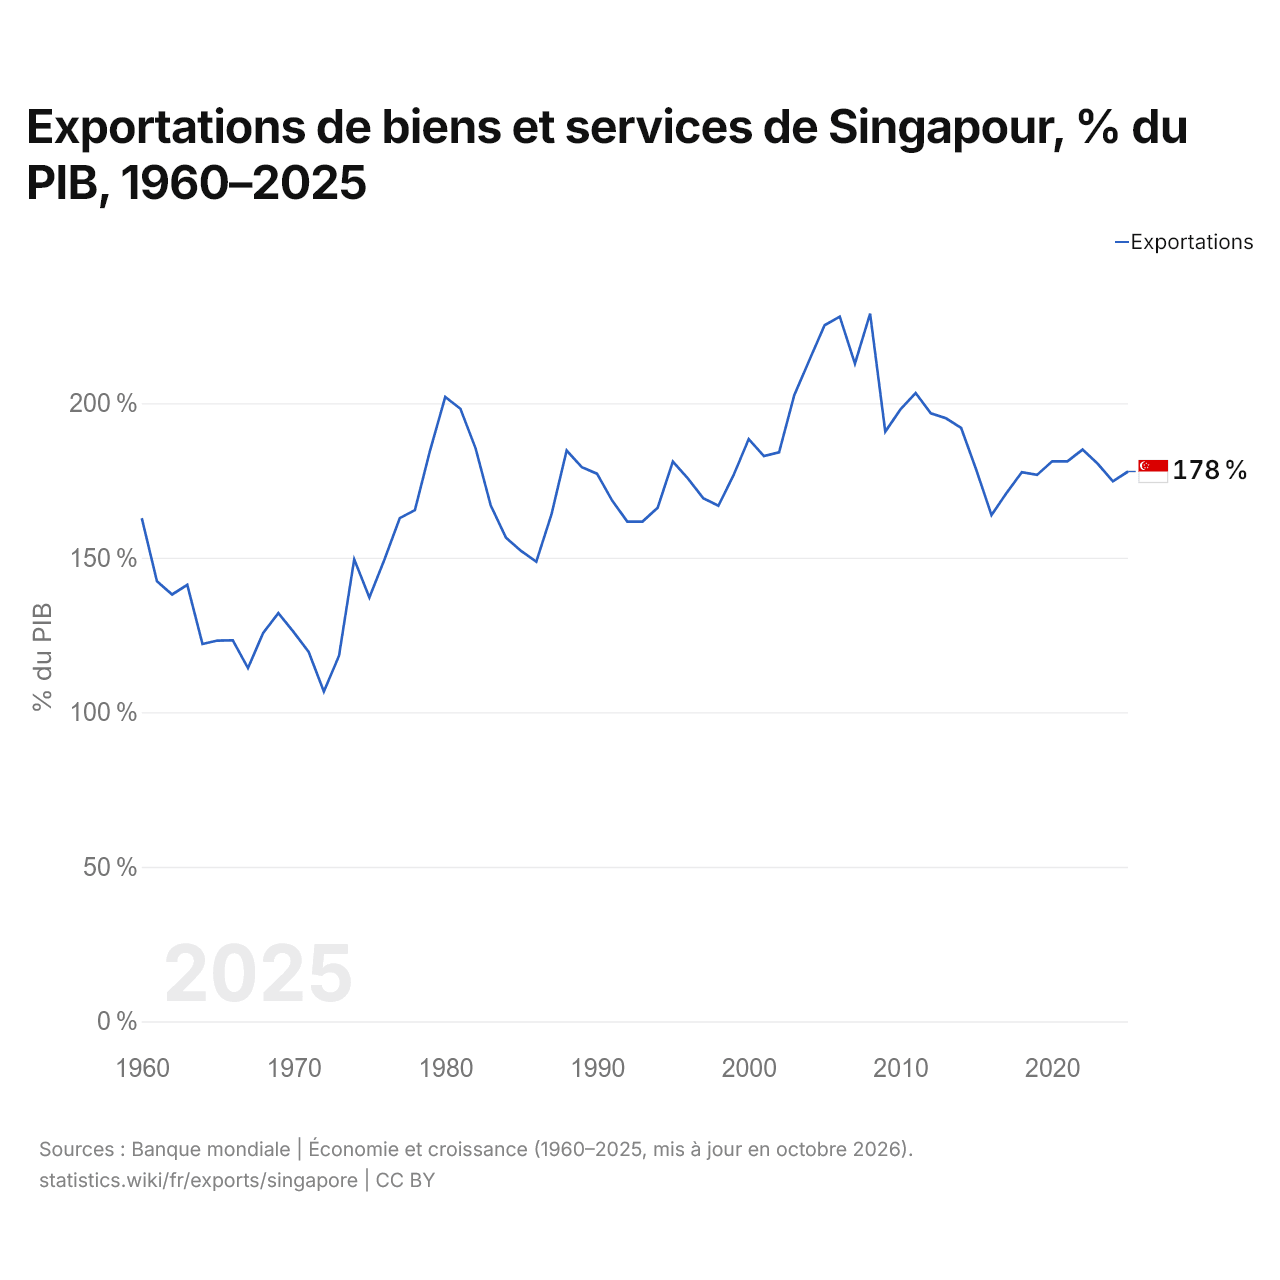
En 2025, les exportations de biens et services de Singapour équivalaient à 177,9 % de son PIB, contre 162,8 % en 1960. La part la plus élevée a été de 229,0 %, en 2008.
Comparer les exportations de Singapour avec celles d'autres pays
Sources :
- TradeMap (2001–2025, mis à jour en octobre 2026)
- Banque mondiale | Économie et croissance (1960–2025, mis à jour en octobre 2026)
Creative Commons Attribution (CC BY) : vous pouvez copier, partager, adapter et réutiliser ce contenu, y compris à des fins commerciales, à condition de citer statistics.wiki et d’indiquer les modifications apportées. Les sources citées ci-dessus peuvent avoir leurs propres conditions de licence.