
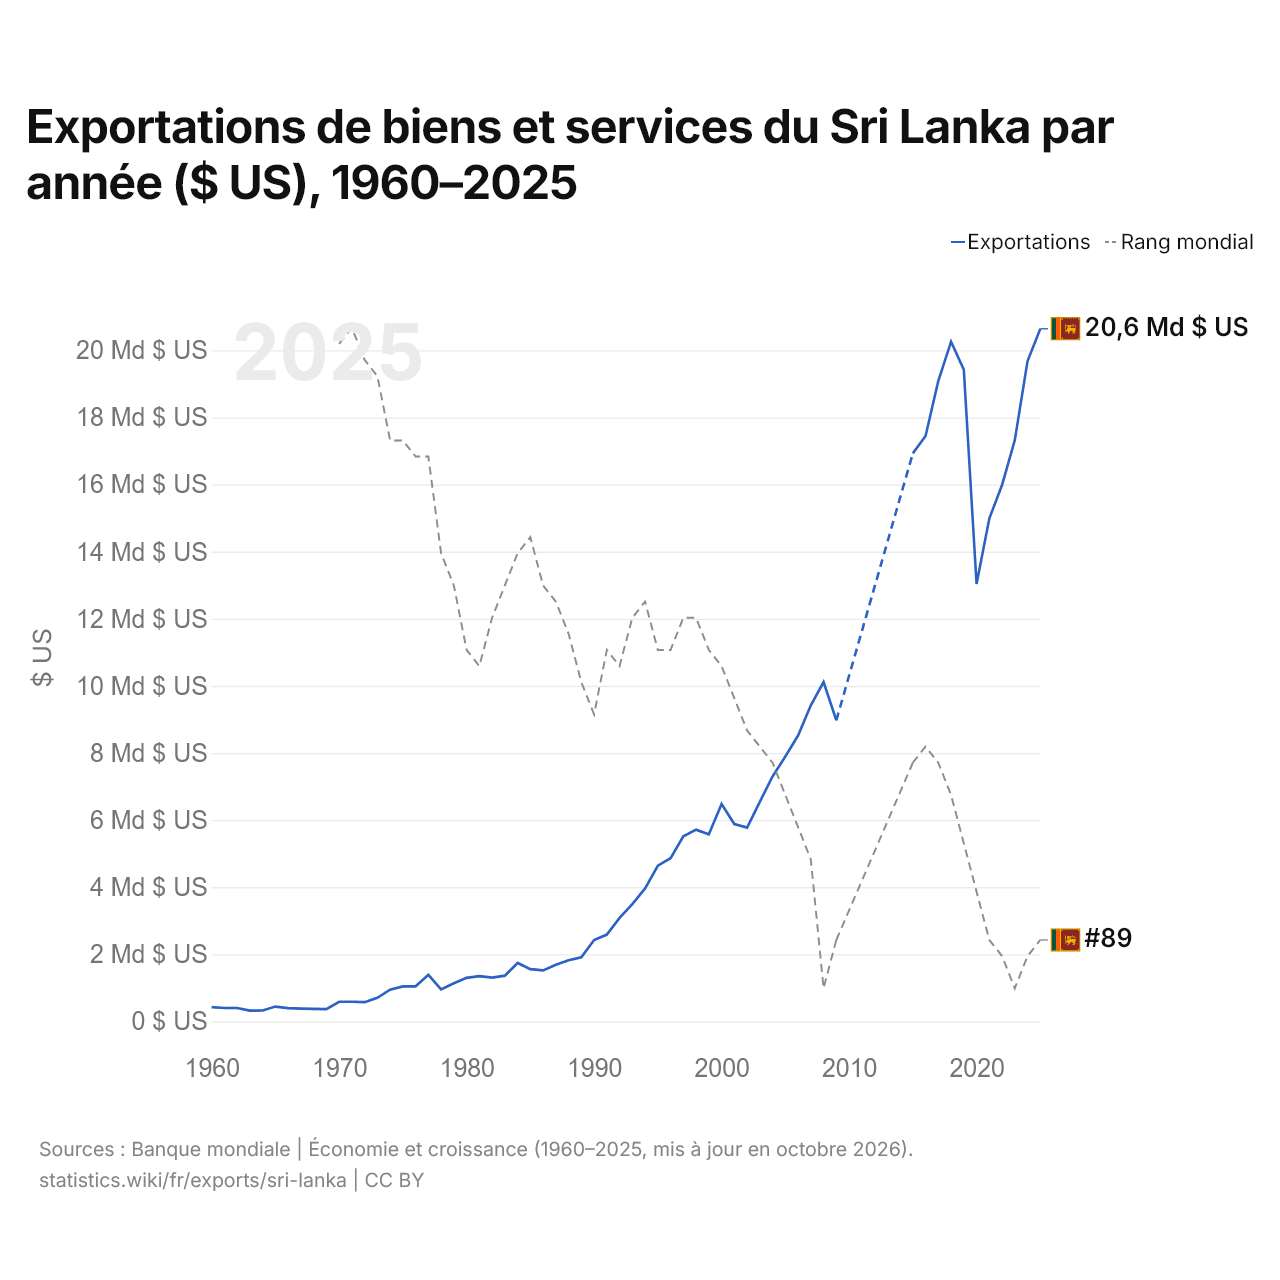
Exportations de biens et services du Sri Lanka par année ($ US), 1960–2025
| Année | $ US | Rang mondial |
|---|---|---|
| Exportations | Rang mondial | |
| 2025 | 20 641 294 806 $ US | #89 |
| 2024 | 19 680 136 442 $ US | #90 |
| 2023 | 17 320 146 765 $ US | #92 |
| 2022 | 15 984 910 773 $ US | #90 |
| 2021 | 14 985 052 393 $ US | #89 |
| 2020 | 13 036 289 408 $ US | #86 |
| 2019 | 19 422 660 165 $ US | #83 |
| 2018 | 20 255 985 244 $ US | #80 |
| 2017 | 19 085 446 206 $ US | #78 |
| 2016 | 17 445 193 522 $ US | #77 |
| 2015 | 16 927 340 151 $ US | #78 |
| 2014 | - | - |
| 2013 | - | - |
| 2012 | - | - |
| 2011 | - | - |
| 2010 | - | - |
| 2009 | 8 972 038 339 $ US | #89 |
| 2008 | 10 113 919 887 $ US | #92 |
| 2007 | 9 418 771 914 $ US | #84 |
| 2006 | 8 516 554 444 $ US | #82 |
| 2005 | 7 892 069 652 $ US | #80 |
| 2004 | 7 300 256 942 $ US | #78 |
| 2003 | 6 543 193 121 $ US | #77 |
| 2002 | 5 773 455 294 $ US | #76 |
| 2001 | 5 879 570 278 $ US | #74 |
| 2000 | 6 475 000 000 $ US | #72 |
| 1999 | 5 575 176 093 $ US | #71 |
| 1998 | 5 712 292 925 $ US | #69 |
| 1997 | 5 514 301 315 $ US | #69 |
| 1996 | 4 860 502 985 $ US | #71 |
| 1995 | 4 638 263 415 $ US | #71 |
| 1994 | 3 962 059 895 $ US | #68 |
| 1993 | 3 494 577 815 $ US | #69 |
| 1992 | 3 082 683 094 $ US | #72 |
| 1991 | 2 586 802 030 $ US | #71 |
| 1990 | 2 424 288 567 $ US | #75 |
| 1989 | 1 904 743 412 $ US | #73 |
| 1988 | 1 819 710 783 $ US | #70 |
| 1987 | 1 683 389 946 $ US | #68 |
| 1986 | 1 519 200 571 $ US | #67 |
| 1985 | 1 555 117 820 $ US | #64 |
| 1984 | 1 740 762 579 $ US | #65 |
| 1983 | 1 360 645 984 $ US | #67 |
| 1982 | 1 304 565 113 $ US | #69 |
| 1981 | 1 345 038 961 $ US | #72 |
| 1980 | 1 296 672 716 $ US | #71 |
| 1979 | 1 134 232 498 $ US | #67 |
| 1978 | 950 352 338 $ US | #65 |
| 1977 | 1 387 936 866 $ US | #59 |
| 1976 | 1 043 162 901 $ US | #59 |
| 1975 | 1 042 225 392 $ US | #58 |
| 1974 | 944 812 030 $ US | #58 |
| 1973 | 700 156 250 $ US | #54 |
| 1972 | 570 184 255 $ US | #53 |
| 1971 | 583 136 594 $ US | #51 |
| 1970 | 584 537 815 $ US | #52 |
| 1969 | 361 512 605 $ US | - |
| 1968 | 371 463 229 $ US | - |
| 1967 | 380 452 675 $ US | - |
| 1966 | 391 806 723 $ US | - |
| 1965 | 439 915 966 $ US | - |
| 1964 | 322 401 284 $ US | - |
| 1963 | 319 557 569 $ US | - |
| 1962 | 398 590 402 $ US | - |
| 1961 | 397 732 380 $ US | - |
| 1960 | 422 303 067 $ US | - |
En 2025, les exportations de biens et services du Sri Lanka s'élevaient à 20,6 milliards de dollars, contre 422 millions de dollars en 1960. Le minimum a été de 320 millions de dollars, en 1963. Elles se classaient au 89e rang mondial, en hausse par rapport au 90e rang en 2024. Leur meilleur rang a été le 51e, occupé pour la dernière fois en 1971.
En 2025, les exportations de biens et services du Sri Lanka étaient les 29es plus élevées de 44 pays situés en Asie. Les importations de biens et services du Sri Lanka s'élevaient à 24,9 milliards de dollars en 2025, au 88e rang mondial. En 2025, les importations du Sri Lanka dépassaient ses exportations de 4,22 milliards de dollars, soit un déficit commercial.
Exportations de biens du Sri Lanka par catégorie, 2025
Exportations de biens, 2025: 13,1 Md $US
En 2025, la première catégorie des exportations de biens du Sri Lanka était « textiles, vêtements, chaussures, meubles et jouets », avec 44,1 %, suivie de « cultures, plantes et fleurs (céréales, fruits, légumes, café, oléagineux) », avec 17,8 %.
Destinations des exportations de biens du Sri Lanka : les 10 premières, 2025
| Rang | Pays | Exportations de biens | Part | |
|---|---|---|---|---|
| 1 |
 États-Unis |
2,96 Md $US | 22,7 % | |
| 2 |
 Inde |
1,04 Md $US | 7,98 % | vs Inde |
| 3 |
 Royaume-Uni |
950 M $US | 7,27 % | |
| 4 |
 Allemagne |
703 M $US | 5,38 % | |
| 5 |
 Italie |
672 M $US | 5,15 % | |
| 6 |
 Pays-Bas |
469 M $US | 3,59 % | |
| 7 |
 EAU |
353 M $US | 2,71 % | |
| 8 |
 Canada |
313 M $US | 2,4 % | vs Canada |
| 9 |
 France |
299 M $US | 2,29 % | vs France |
| 10 |
 Chine |
282 M $US | 2,16 % | |
| Autres partenaires et non précisés | 5,01 Md $US | 38,4 % |
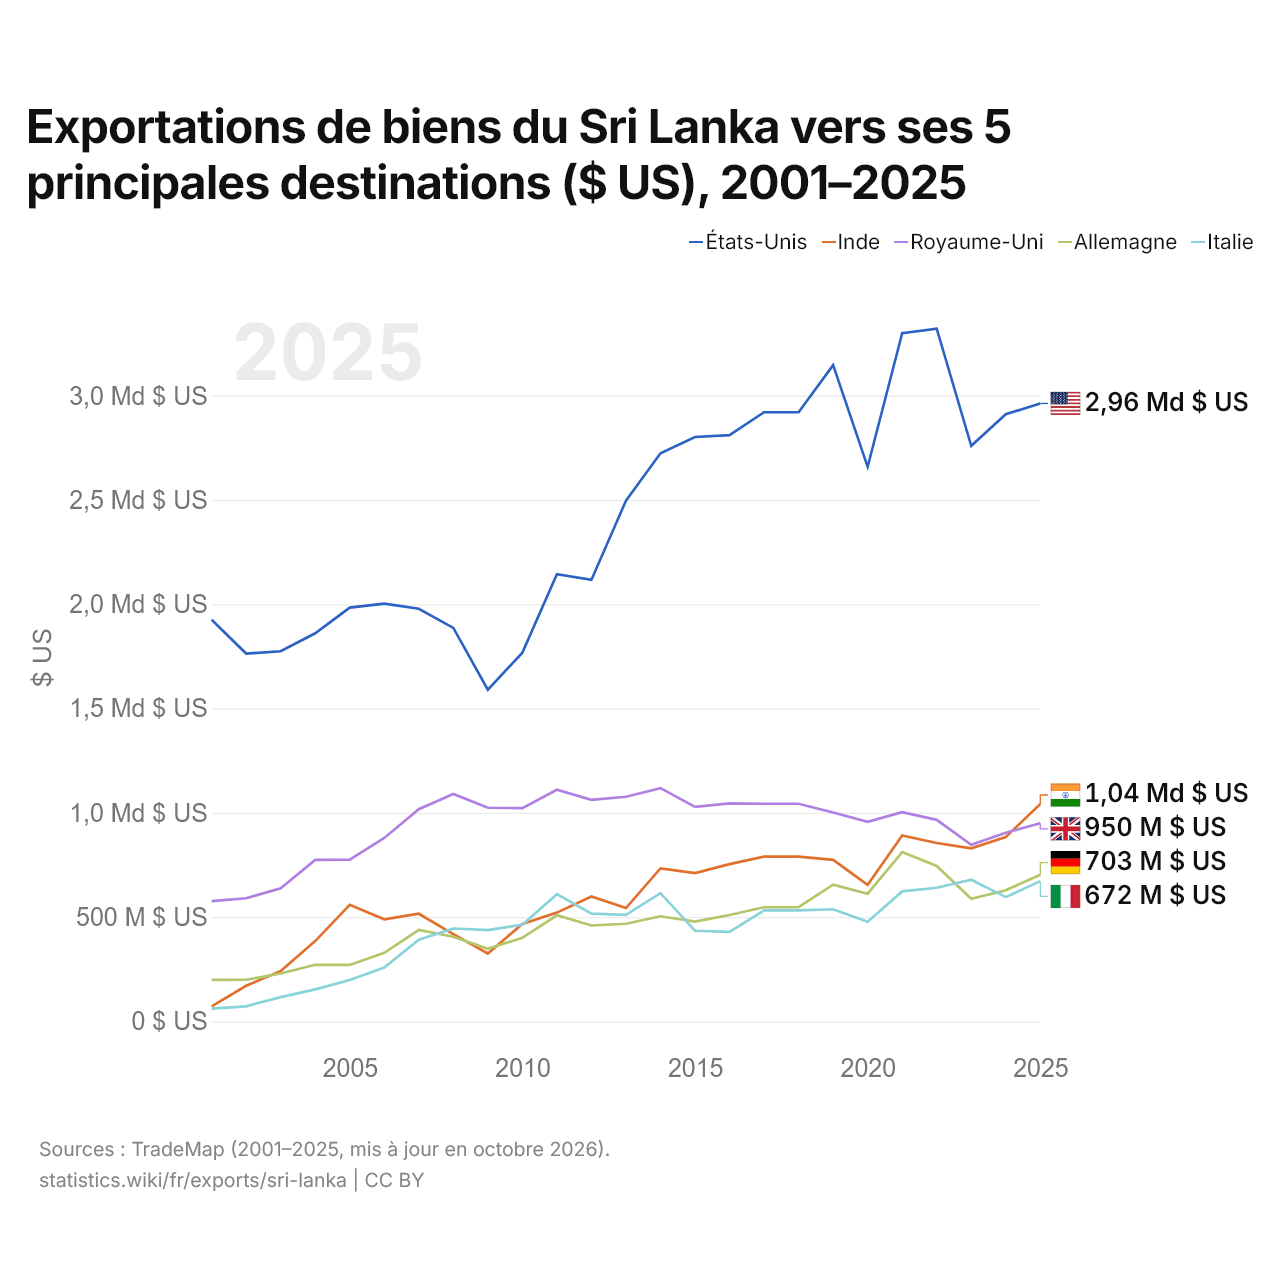
Exportations de biens du Sri Lanka vers ses 5 principales destinations ($ US), 2001–2025
| Année | $ US | ||||
|---|---|---|---|---|---|
| États-Unis | Inde | Royaume-Uni | Allemagne | Italie | |
| 2025 | 2 962 357 000 $ US | 1 042 420 000 $ US | 949 825 000 $ US | 703 079 000 $ US | 672 085 000 $ US |
| 2024 | 2 910 523 000 $ US | 883 652 000 $ US | 903 719 000 $ US | 628 246 000 $ US | 595 442 000 $ US |
| 2023 | 2 759 272 000 $ US | 829 700 000 $ US | 846 158 000 $ US | 587 404 000 $ US | 679 046 000 $ US |
| 2022 | 3 320 746 000 $ US | 854 883 000 $ US | 966 041 000 $ US | 744 570 000 $ US | 640 186 000 $ US |
| 2021 | 3 298 951 000 $ US | 891 460 000 $ US | 1 003 025 000 $ US | 811 266 000 $ US | 622 908 000 $ US |
| 2020 | 2 658 223 000 $ US | 654 442 000 $ US | 956 067 000 $ US | 611 783 000 $ US | 477 328 000 $ US |
| 2019 | 3 145 964 000 $ US | 774 128 000 $ US | 1 000 952 000 $ US | 655 062 000 $ US | 537 223 000 $ US |
| 2018 | 2 920 210 000 $ US | 789 586 000 $ US | 1 043 182 000 $ US | 547 125 000 $ US | 531 652 000 $ US |
| 2017 | 2 920 210 000 $ US | 789 586 000 $ US | 1 043 182 000 $ US | 547 125 000 $ US | 531 652 000 $ US |
| 2016 | 2 810 220 000 $ US | 753 481 000 $ US | 1 045 080 000 $ US | 509 881 000 $ US | 428 902 000 $ US |
| 2015 | 2 801 469 000 $ US | 710 404 000 $ US | 1 028 277 000 $ US | 477 905 000 $ US | 434 214 000 $ US |
| 2014 | 2 723 250 000 $ US | 733 403 000 $ US | 1 117 947 000 $ US | 503 686 000 $ US | 614 761 000 $ US |
| 2013 | 2 495 844 000 $ US | 543 121 000 $ US | 1 076 692 000 $ US | 467 602 000 $ US | 510 226 000 $ US |
| 2012 | 2 116 798 000 $ US | 598 629 000 $ US | 1 061 572 000 $ US | 459 362 000 $ US | 516 610 000 $ US |
| 2011 | 2 143 901 000 $ US | 521 264 000 $ US | 1 110 297 000 $ US | 508 341 000 $ US | 609 584 000 $ US |
| 2010 | 1 767 685 000 $ US | 467 182 000 $ US | 1 021 905 000 $ US | 400 570 000 $ US | 463 124 000 $ US |
| 2009 | 1 589 753 000 $ US | 325 022 000 $ US | 1 024 061 000 $ US | 347 963 000 $ US | 437 557 000 $ US |
| 2008 | 1 886 241 000 $ US | 417 947 000 $ US | 1 090 109 000 $ US | 405 676 000 $ US | 444 912 000 $ US |
| 2007 | 1 977 976 000 $ US | 515 830 000 $ US | 1 017 161 000 $ US | 438 048 000 $ US | 391 789 000 $ US |
| 2006 | 2 002 371 000 $ US | 489 039 000 $ US | 878 867 000 $ US | 328 462 000 $ US | 257 713 000 $ US |
| 2005 | 1 983 231 000 $ US | 558 819 000 $ US | 774 838 000 $ US | 270 533 000 $ US | 198 384 000 $ US |
| 2004 | 1 860 590 000 $ US | 384 530 000 $ US | 774 254 000 $ US | 271 078 000 $ US | 153 028 000 $ US |
| 2003 | 1 774 314 000 $ US | 241 155 000 $ US | 638 234 000 $ US | 229 033 000 $ US | 116 139 000 $ US |
| 2002 | 1 763 005 000 $ US | 170 451 000 $ US | 589 872 000 $ US | 199 161 000 $ US | 71 885 000 $ US |
| 2001 | 1 925 671 000 $ US | 71 977 000 $ US | 576 271 000 $ US | 198 460 000 $ US | 61 097 000 $ US |
En 2025, les exportations de biens s'élevaient à 2,96 milliards de dollars vers les États-Unis, 1,04 milliard de dollars vers l'Inde, 950 millions de dollars vers le Royaume-Uni, 703 millions de dollars vers l'Allemagne et 672 millions de dollars vers l'Italie. Le premier rang des cinq destinations du Sri Lanka est occupé par les États-Unis chaque année depuis 2001. Le changement le plus récent dans leur ordre remonte à 2025, quand les exportations du Sri Lanka vers l'Inde ont dépassé celles vers le Royaume-Uni.
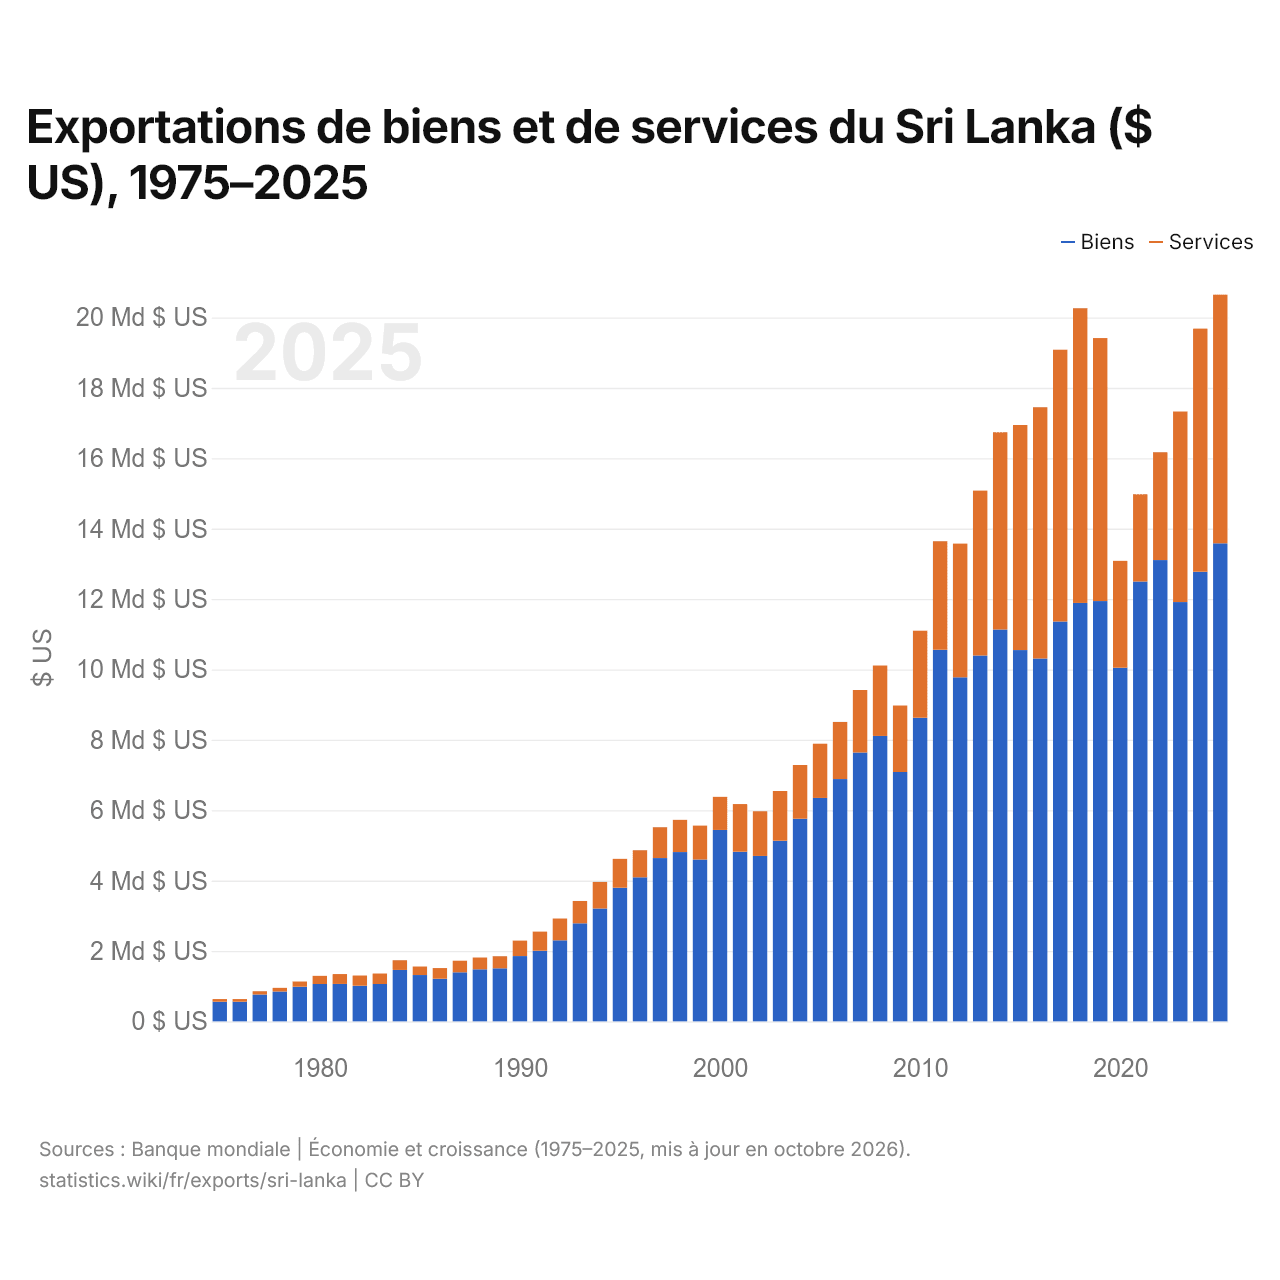
Exportations de biens et de services du Sri Lanka ($ US), 1975–2025
| Année | $ US | |
|---|---|---|
| Biens | Services | |
| 2025 | 13 581 374 361 $ US | 7 065 692 350 $ US |
| 2024 | 12 771 992 885 $ US | 6 910 060 871 $ US |
| 2023 | 11 910 710 193 $ US | 5 416 282 466 $ US |
| 2022 | 13 106 439 476 $ US | 3 062 322 504 $ US |
| 2021 | 12 498 581 960 $ US | 2 474 954 539 $ US |
| 2020 | 10 047 427 169 $ US | 3 035 372 504 $ US |
| 2019 | 11 940 012 504 $ US | 7 474 310 220 $ US |
| 2018 | 11 889 634 107 $ US | 8 374 158 444 $ US |
| 2017 | 11 360 418 565 $ US | 7 723 762 442 $ US |
| 2016 | 10 309 740 478 $ US | 7 138 115 099 $ US |
| 2015 | 10 546 498 919 $ US | 6 396 663 005 $ US |
| 2014 | 11 130 069 942 $ US | 5 604 957 099 $ US |
| 2013 | 10 394 251 513 $ US | 4 685 081 225 $ US |
| 2012 | 9 773 529 592 $ US | 3 799 913 006 $ US |
| 2011 | 10 558 820 000 $ US | 3 083 880 000 $ US |
| 2010 | 8 625 820 000 $ US | 2 474 190 000 $ US |
| 2009 | 7 084 500 000 $ US | 1 892 400 000 $ US |
| 2008 | 8 110 600 000 $ US | 2 002 400 000 $ US |
| 2007 | 7 639 900 000 $ US | 1 775 000 000 $ US |
| 2006 | 6 882 600 000 $ US | 1 624 909 000 $ US |
| 2005 | 6 346 727 000 $ US | 1 540 129 760 $ US |
| 2004 | 5 757 240 000 $ US | 1 526 600 000 $ US |
| 2003 | 5 133 210 000 $ US | 1 410 680 000 $ US |
| 2002 | 4 699 150 000 $ US | 1 268 300 000 $ US |
| 2001 | 4 816 890 000 $ US | 1 355 450 000 $ US |
| 2000 | 5 439 551 443 $ US | 938 710 071 $ US |
| 1999 | 4 596 186 230 $ US | 964 315 560 $ US |
| 1998 | 4 807 964 037 $ US | 916 597 690 $ US |
| 1997 | 4 638 651 545 $ US | 875 314 967 $ US |
| 1996 | 4 095 240 235 $ US | 765 498 940 $ US |
| 1995 | 3 797 932 904 $ US | 819 204 617 $ US |
| 1994 | 3 208 341 504 $ US | 753 851 229 $ US |
| 1993 | 2 785 691 283 $ US | 634 358 483 $ US |
| 1992 | 2 301 402 863 $ US | 621 360 437 $ US |
| 1991 | 2 003 321 889 $ US | 546 608 993 $ US |
| 1990 | 1 853 044 882 $ US | 439 630 693 $ US |
| 1989 | 1 505 056 266 $ US | 345 589 387 $ US |
| 1988 | 1 477 088 636 $ US | 339 178 035 $ US |
| 1987 | 1 393 851 561 $ US | 328 170 636 $ US |
| 1986 | 1 208 534 254 $ US | 305 265 164 $ US |
| 1985 | 1 315 818 942 $ US | 245 371 624 $ US |
| 1984 | 1 461 590 787 $ US | 276 199 267 $ US |
| 1983 | 1 061 234 125 $ US | 297 884 628 $ US |
| 1982 | 1 013 852 740 $ US | 290 581 018 $ US |
| 1981 | 1 062 470 895 $ US | 279 415 765 $ US |
| 1980 | 1 061 631 496 $ US | 231 100 006 $ US |
| 1979 | 981 142 988 $ US | 152 937 855 $ US |
| 1978 | 845 720 789 $ US | 104 377 447 $ US |
| 1977 | 761 587 462 $ US | 93 524 019 $ US |
| 1976 | 559 557 775 $ US | 72 515 454 $ US |
| 1975 | 558 428 276 $ US | 73 496 182 $ US |
En 2025, les exportations de biens du Sri Lanka s'élevaient à 13,6 milliards de dollars et celles de services à 7,07 milliards de dollars ; les services représentaient 34,2 % du total, contre 11,6 % en 1975.
Le Sri Lanka dans le classement mondial des exportations, 2025







Exportations de biens et services du Sri Lanka, % du PIB, 1960–2025
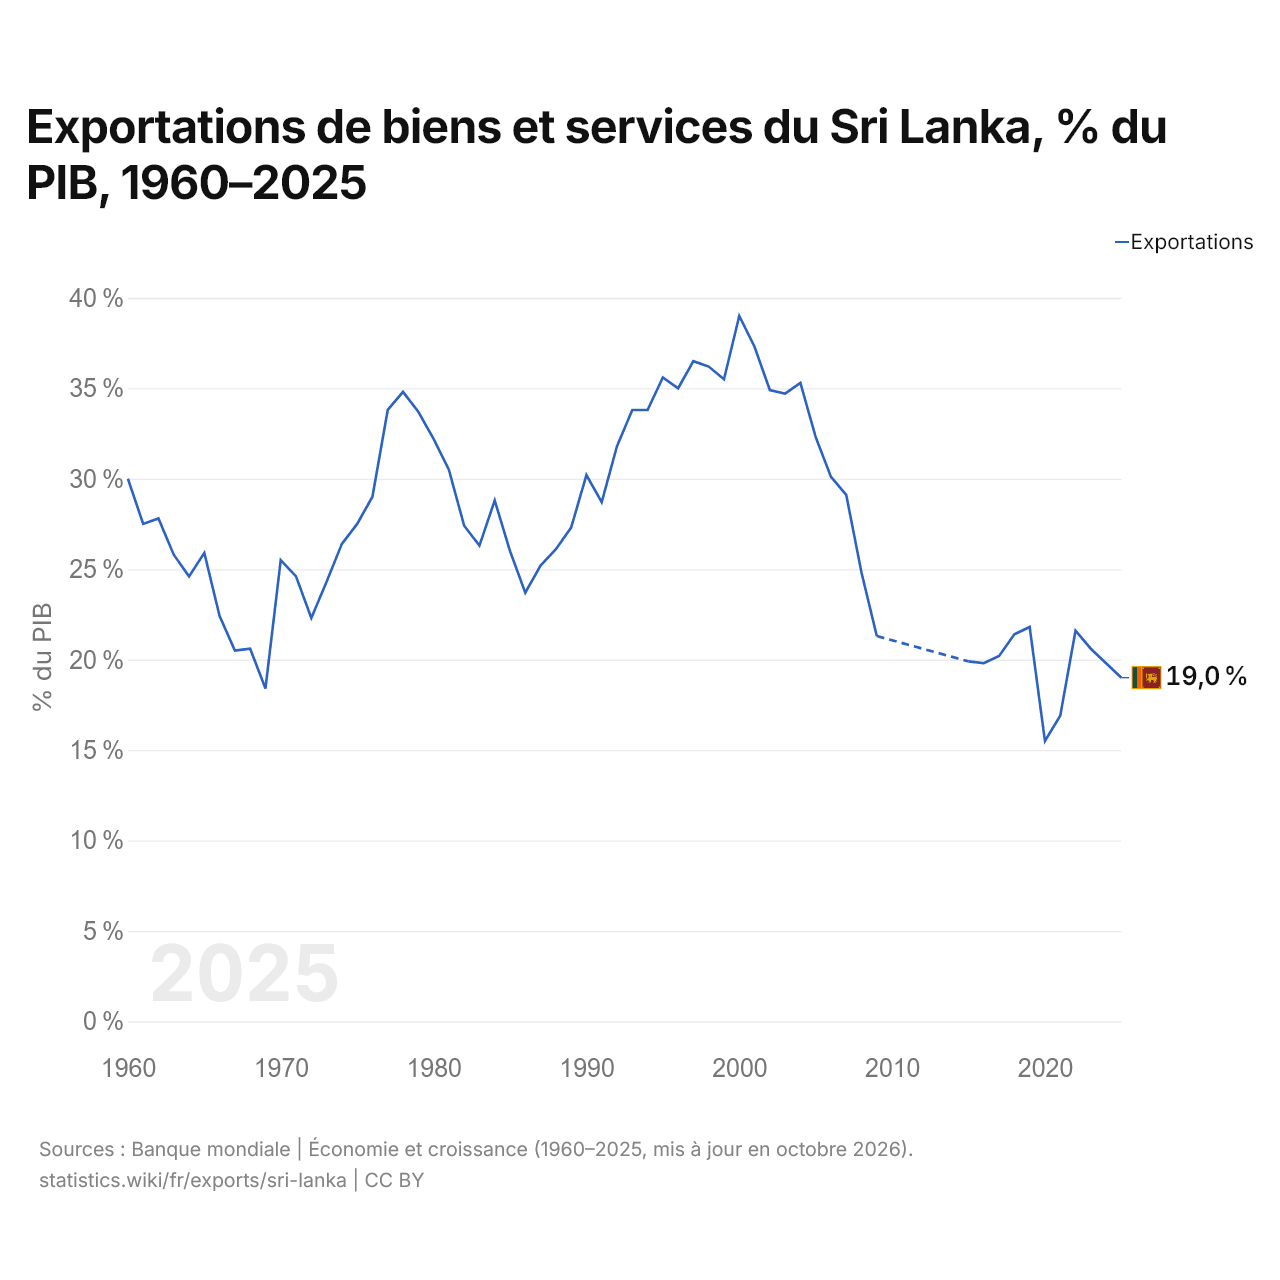
En 2025, les exportations de biens et services du Sri Lanka équivalaient à 19,0 % de son PIB, contre 30,0 % en 1960. La part la plus élevée a été de 39,0 %, en 2000.
Comparer les exportations du Sri Lanka avec celles d'autres pays
Sources :
- TradeMap (2001–2025, mis à jour en octobre 2026)
- Banque mondiale | Économie et croissance (1960–2025, mis à jour en octobre 2026)
Creative Commons Attribution (CC BY) : vous pouvez copier, partager, adapter et réutiliser ce contenu, y compris à des fins commerciales, à condition de citer statistics.wiki et d’indiquer les modifications apportées. Les sources citées ci-dessus peuvent avoir leurs propres conditions de licence.