
Exportations de biens et services du Guatemala par année ($ US), 1960–2025
| Année | $ US | Rang mondial |
|---|---|---|
| Exportations | Rang mondial | |
| 2025 | 19 185 393 858 $ US | #90 |
| 2024 | 17 982 554 316 $ US | #92 |
| 2023 | 17 331 724 160 $ US | #91 |
| 2022 | 18 119 750 230 $ US | #88 |
| 2021 | 15 241 812 022 $ US | #87 |
| 2020 | 12 702 168 189 $ US | #87 |
| 2019 | 13 591 570 047 $ US | #90 |
| 2018 | 13 323 267 943 $ US | #91 |
| 2017 | 13 252 394 991 $ US | #90 |
| 2016 | 12 387 053 735 $ US | #88 |
| 2015 | 12 331 439 231 $ US | #88 |
| 2014 | 12 579 582 121 $ US | #92 |
| 2013 | 11 658 240 732 $ US | #94 |
| 2012 | 12 530 944 106 $ US | #93 |
| 2011 | 12 688 259 461 $ US | #92 |
| 2010 | 10 667 621 567 $ US | #90 |
| 2009 | 9 046 835 389 $ US | #88 |
| 2008 | 9 673 807 862 $ US | #94 |
| 2007 | 8 721 101 393 $ US | #89 |
| 2006 | 7 537 142 602 $ US | #89 |
| 2005 | 6 817 685 367 $ US | #87 |
| 2004 | 6 464 755 963 $ US | #82 |
| 2003 | 5 648 926 180 $ US | #79 |
| 2002 | 5 463 975 082 $ US | #79 |
| 2001 | 5 275 589 193 $ US | #76 |
| 2000 | 3 895 405 852 $ US | #79 |
| 1999 | 3 481 400 349 $ US | #82 |
| 1998 | 3 524 472 507 $ US | #84 |
| 1997 | 3 194 396 326 $ US | #88 |
| 1996 | 2 791 706 610 $ US | #90 |
| 1995 | 2 822 490 793 $ US | #88 |
| 1994 | 2 274 655 329 $ US | #85 |
| 1993 | 2 018 148 609 $ US | #87 |
| 1992 | 1 886 230 498 $ US | #89 |
| 1991 | 1 688 646 379 $ US | #89 |
| 1990 | 1 608 646 744 $ US | #91 |
| 1989 | 1 455 681 818 $ US | #83 |
| 1988 | 1 262 786 260 $ US | #82 |
| 1987 | 1 122 800 040 $ US | #83 |
| 1986 | 1 160 867 534 $ US | #77 |
| 1985 | 1 161 565 304 $ US | #77 |
| 1984 | 1 231 300 000 $ US | #76 |
| 1983 | 1 176 000 000 $ US | #73 |
| 1982 | 1 288 999 900 $ US | #70 |
| 1981 | 1 471 000 100 $ US | #67 |
| 1980 | 1 748 000 000 $ US | #63 |
| 1979 | 1 473 600 000 $ US | #59 |
| 1978 | 1 303 700 000 $ US | #59 |
| 1977 | 1 340 300 000 $ US | #60 |
| 1976 | 941 700 000 $ US | #61 |
| 1975 | 792 000 000 $ US | #63 |
| 1974 | 708 400 000 $ US | #63 |
| 1973 | 536 500 000 $ US | #60 |
| 1972 | 397 300 000 $ US | #60 |
| 1971 | 343 100 000 $ US | #61 |
| 1970 | 353 600 000 $ US | #58 |
| 1969 | 305 400 000 $ US | - |
| 1968 | 269 500 000 $ US | - |
| 1967 | 235 600 000 $ US | - |
| 1966 | 263 400 000 $ US | - |
| 1965 | 223 500 000 $ US | - |
| 1964 | 199 900 000 $ US | - |
| 1963 | 180 400 000 $ US | - |
| 1962 | 134 800 000 $ US | - |
| 1961 | 128 700 000 $ US | - |
| 1960 | 131 900 000 $ US | - |
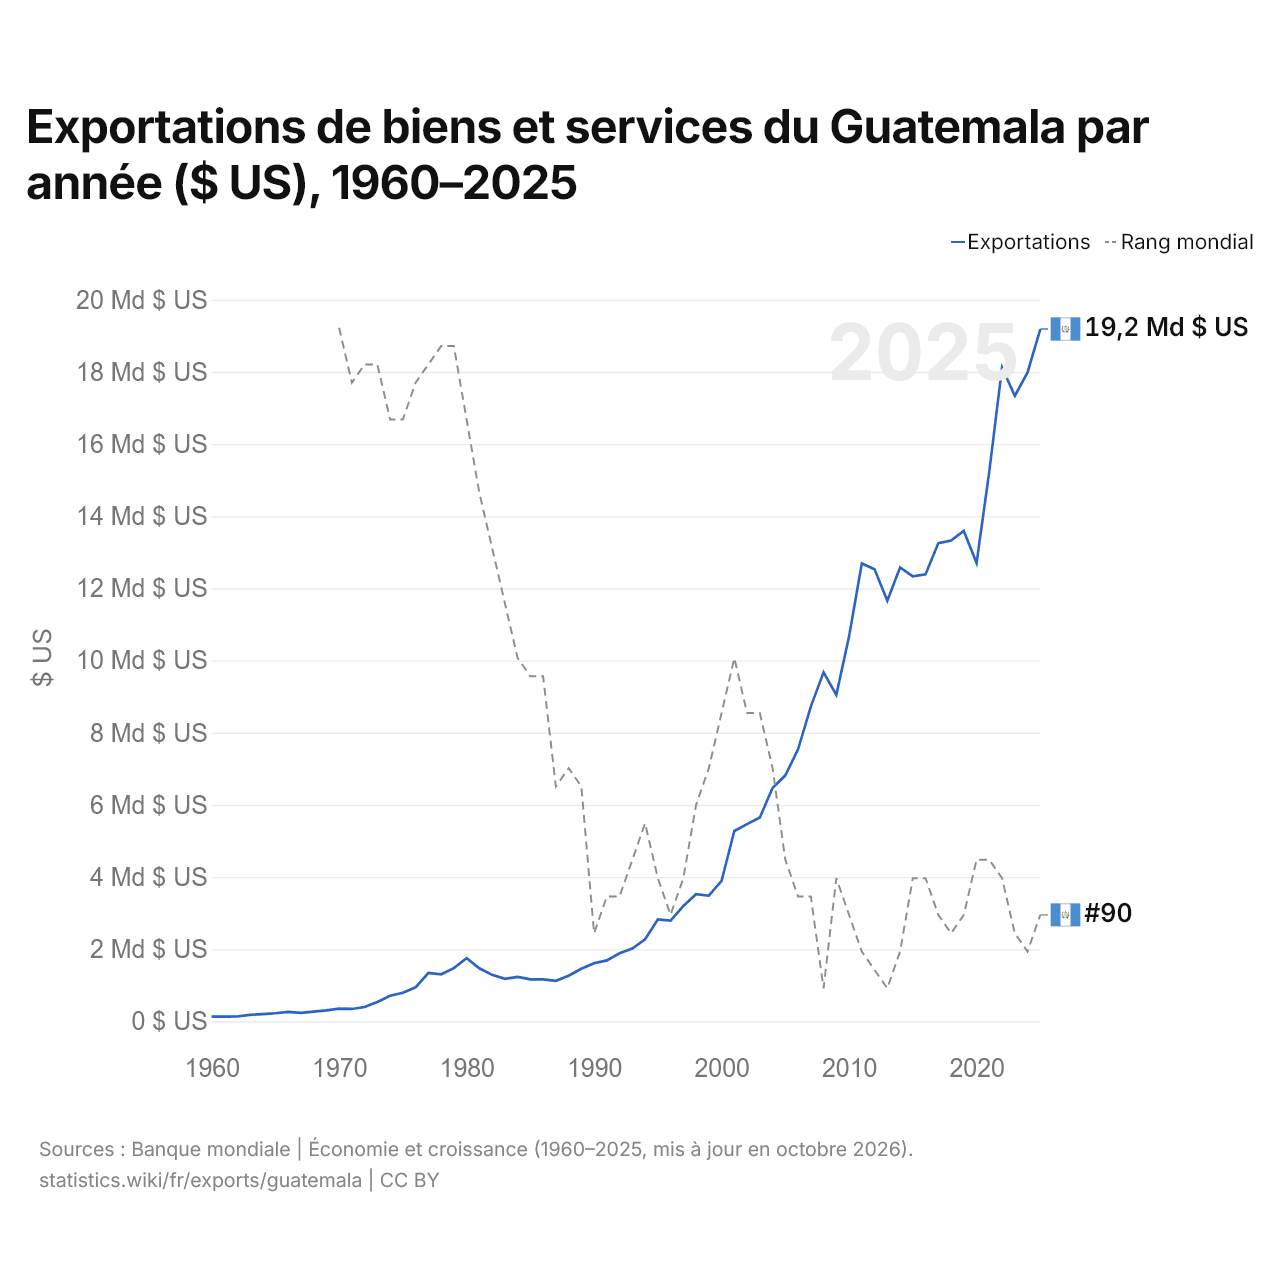
En 2025, les exportations de biens et services du Guatemala s'élevaient à 19,2 milliards de dollars, contre 132 millions de dollars en 1960. Le minimum a été de 129 millions de dollars, en 1961. Elles se classaient au 90e rang mondial, en hausse par rapport au 92e rang en 2024. Leur meilleur rang a été le 58e, occupé pour la dernière fois en 1970.
En 2025, les exportations de biens et services du Guatemala étaient les 12es plus élevées de 27 pays situés en Amérique latine. Les importations de biens et services du Guatemala s'élevaient à 38,2 milliards de dollars en 2025, au 70e rang mondial. En 2025, les importations du Guatemala dépassaient ses exportations de 19 milliards de dollars, soit un déficit commercial.
Exportations de biens du Guatemala par catégorie, 2025
Exportations de biens, 2025: 15,6 Md $US
En 2025, la première catégorie des exportations de biens du Guatemala était « cultures, plantes et fleurs (céréales, fruits, légumes, café, oléagineux) », avec 26,7 %, suivie de « aliments transformés, huiles, aliments pour animaux, boissons et tabac », avec 24,0 %.
Destinations des exportations de biens du Guatemala : les 10 premières, 2025
| Rang | Pays | Exportations de biens | Part | |
|---|---|---|---|---|
| 1 |
 États-Unis |
4,81 Md $US | 30,9 % | |
| 2 |
 Salvador |
2,14 Md $US | 13,7 % | vs Salvador |
| 3 |
 Honduras |
1,78 Md $US | 11,4 % | vs Honduras |
| 4 |
 Nicaragua |
1,09 Md $US | 6,99 % | |
| 5 |
 Mexique |
688 M $US | 4,42 % | vs Mexique |
| 6 |
 Costa Rica |
667 M $US | 4,28 % | |
| 7 |
 Pays-Bas |
538 M $US | 3,45 % | |
| 8 |
 Panama |
306 M $US | 1,96 % | |
| 9 |
 Canada |
291 M $US | 1,87 % | |
| 10 |
 Rép. dominicaine |
283 M $US | 1,81 % | |
| Autres partenaires et non précisés | 2,99 Md $US | 19,2 % |
Exportations de biens du Guatemala vers ses 5 principales destinations ($ US), 2001–2025
| Année | $ US | ||||
|---|---|---|---|---|---|
| États-Unis | Salvador | Honduras | Nicaragua | Mexique | |
| 2025 | 4 811 117 000 $ US | 2 136 866 000 $ US | 1 782 405 000 $ US | 1 088 898 000 $ US | 688 156 000 $ US |
| 2024 | 4 701 707 000 $ US | 1 951 137 000 $ US | 1 673 130 000 $ US | 1 061 686 000 $ US | 726 551 000 $ US |
| 2023 | 4 443 866 000 $ US | 1 876 234 000 $ US | 1 631 232 000 $ US | 987 004 000 $ US | 673 449 000 $ US |
| 2022 | 4 938 042 000 $ US | 2 051 723 000 $ US | 1 585 425 000 $ US | 998 028 000 $ US | 689 128 000 $ US |
| 2021 | 4 318 604 000 $ US | 1 730 869 000 $ US | 1 399 024 000 $ US | 843 901 000 $ US | 592 590 000 $ US |
| 2020 | 3 538 509 000 $ US | 1 314 155 000 $ US | 1 023 562 000 $ US | 662 367 000 $ US | 461 263 000 $ US |
| 2019 | 3 666 705 000 $ US | 1 383 921 000 $ US | 1 003 363 000 $ US | 549 803 000 $ US | 552 986 000 $ US |
| 2018 | 3 913 864 000 $ US | 1 335 072 000 $ US | 935 177 000 $ US | 540 523 000 $ US | 508 164 000 $ US |
| 2017 | 3 783 790 000 $ US | 1 216 535 000 $ US | 967 261 000 $ US | 562 222 000 $ US | 510 994 000 $ US |
| 2016 | 3 516 337 000 $ US | 1 204 275 000 $ US | 913 908 000 $ US | 569 269 000 $ US | 458 537 000 $ US |
| 2015 | 3 800 674 000 $ US | 1 239 768 000 $ US | 903 373 000 $ US | 554 819 000 $ US | 429 841 000 $ US |
| 2014 | 3 943 692 000 $ US | 1 263 804 000 $ US | 885 488 000 $ US | 513 741 000 $ US | 432 443 000 $ US |
| 2013 | 3 866 980 000 $ US | 1 108 770 000 $ US | 790 979 000 $ US | 486 919 000 $ US | 469 593 000 $ US |
| 2012 | 4 154 976 000 $ US | 1 110 744 000 $ US | 795 462 000 $ US | 473 275 000 $ US | 549 816 000 $ US |
| 2011 | 4 224 788 000 $ US | 1 125 928 000 $ US | 813 672 000 $ US | 458 945 000 $ US | 510 788 000 $ US |
| 2010 | 3 283 735 000 $ US | 993 793 000 $ US | 700 083 000 $ US | 352 669 000 $ US | 447 344 000 $ US |
| 2009 | 2 953 261 000 $ US | 817 283 000 $ US | 606 383 000 $ US | 281 816 000 $ US | 424 510 000 $ US |
| 2008 | 3 048 512 000 $ US | 972 585 000 $ US | 736 829 000 $ US | 327 543 000 $ US | 509 493 000 $ US |
| 2007 | 2 934 363 000 $ US | 841 287 000 $ US | 592 963 000 $ US | 267 182 000 $ US | 463 725 000 $ US |
| 2006 | 1 004 967 000 $ US | 489 520 000 $ US | 308 700 000 $ US | 141 209 000 $ US | 174 086 000 $ US |
| 2005 | 2 694 229 000 $ US | 653 001 000 $ US | 394 043 000 $ US | 213 216 000 $ US | 215 842 000 $ US |
| 2004 | 860 741 000 $ US | 544 846 000 $ US | 347 543 000 $ US | 174 517 000 $ US | 133 352 000 $ US |
| 2003 | 791 019 000 $ US | 501 729 000 $ US | 281 172 000 $ US | 153 911 000 $ US | 106 867 000 $ US |
| 2002 | 728 885 000 $ US | 457 513 000 $ US | 271 405 000 $ US | 136 174 000 $ US | 75 950 000 $ US |
| 2001 | 644 463 000 $ US | 477 108 000 $ US | 295 306 000 $ US | 130 612 000 $ US | 79 054 000 $ US |
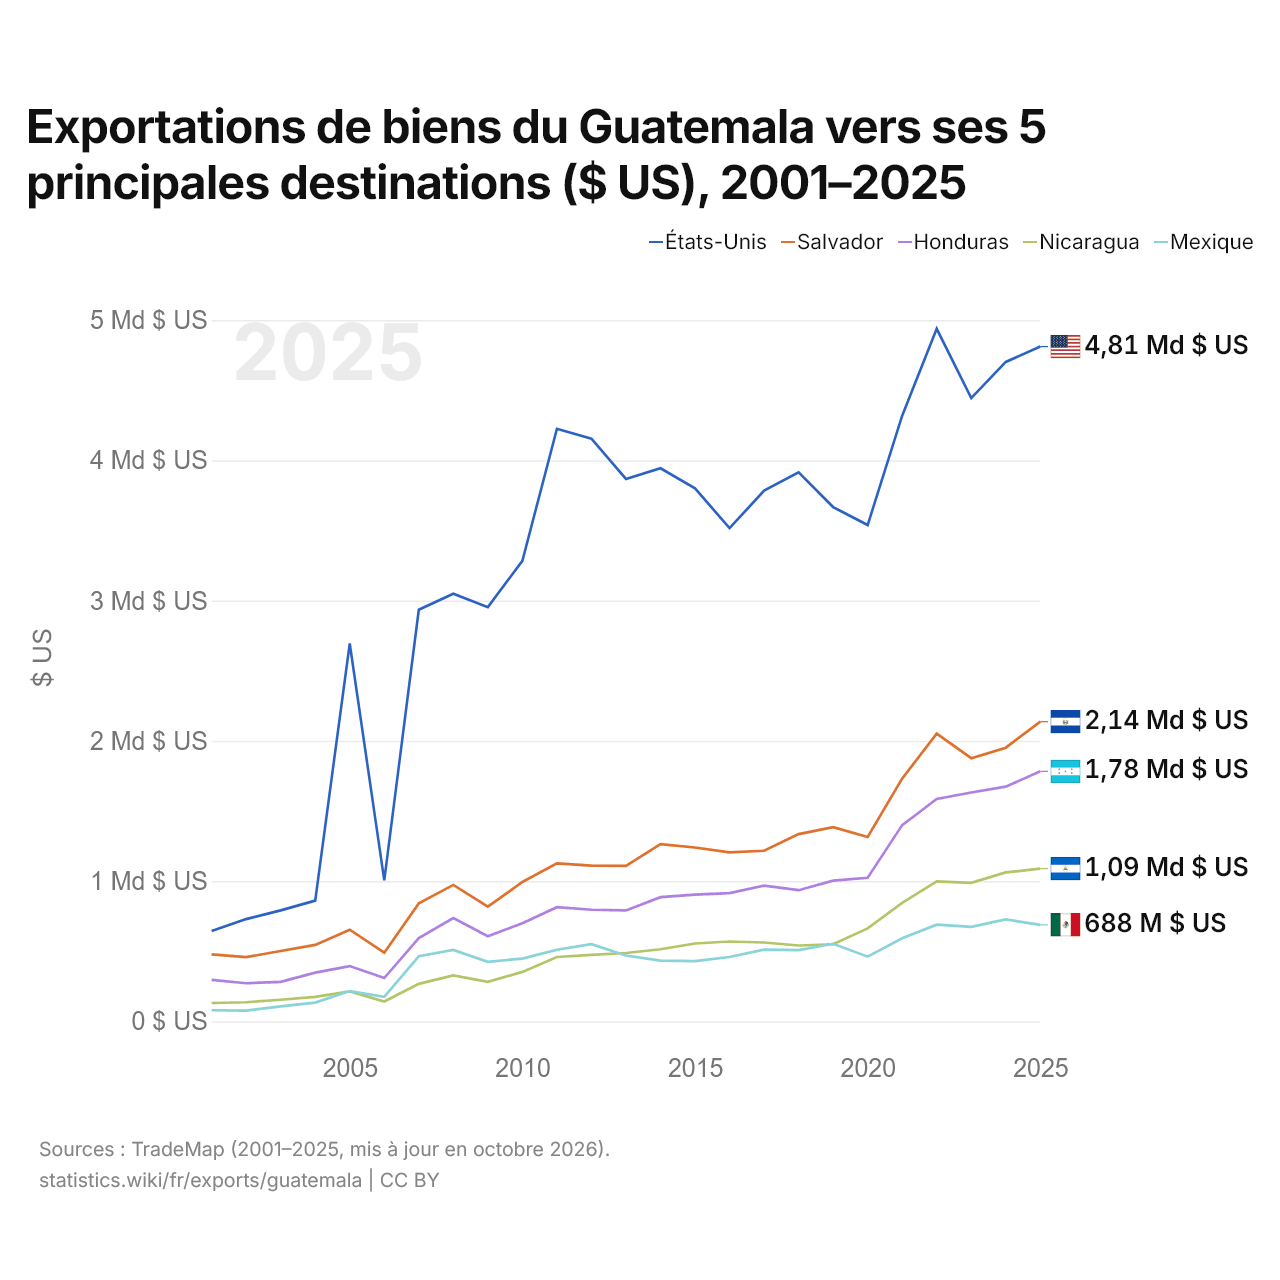
En 2025, les exportations de biens s'élevaient à 4,81 milliards de dollars vers les États-Unis, 2,14 milliards de dollars vers le Salvador, 1,78 milliard de dollars vers le Honduras, 1,09 milliard de dollars vers le Nicaragua et 688 millions de dollars vers le Mexique. Le premier rang des cinq destinations du Guatemala est occupé par les États-Unis chaque année depuis 2001. Le changement le plus récent dans leur ordre remonte à 2020, quand les exportations du Guatemala vers le Nicaragua ont dépassé celles vers le Mexique.
Exportations de biens et de services du Guatemala ($ US), 1977–2025
| Année | $ US | |
|---|---|---|
| Biens | Services | |
| 2025 | 14 309 423 630 $ US | 4 886 323 350 $ US |
| 2024 | 13 325 447 900 $ US | 4 663 168 500 $ US |
| 2023 | 13 047 500 260 $ US | 4 294 051 270 $ US |
| 2022 | 14 254 220 830 $ US | 3 886 400 890 $ US |
| 2021 | 12 361 461 010 $ US | 2 884 546 280 $ US |
| 2020 | 10 126 634 020 $ US | 2 586 341 150 $ US |
| 2019 | 9 918 523 510 $ US | 3 679 076 920 $ US |
| 2018 | 9 644 081 760 $ US | 3 706 981 580 $ US |
| 2017 | 9 650 544 060 $ US | 3 600 138 420 $ US |
| 2016 | 8 972 542 240 $ US | 3 414 111 700 $ US |
| 2015 | 9 084 883 040 $ US | 3 242 586 500 $ US |
| 2014 | 9 375 330 050 $ US | 3 196 614 110 $ US |
| 2013 | 8 663 107 030 $ US | 2 997 144 820 $ US |
| 2012 | 8 579 639 570 $ US | 2 795 264 380 $ US |
| 2011 | 8 968 698 780 $ US | 2 592 344 390 $ US |
| 2010 | 7 195 611 440 $ US | 2 404 725 340 $ US |
| 2009 | 6 181 335 510 $ US | 2 246 580 600 $ US |
| 2008 | 6 763 967 850 $ US | 2 226 014 290 $ US |
| 2007 | 6 983 200 000 $ US | 1 731 200 000 $ US |
| 2006 | 6 082 100 000 $ US | 1 518 900 000 $ US |
| 2005 | 5 459 500 000 $ US | 1 307 800 000 $ US |
| 2004 | 5 105 100 000 $ US | 1 100 400 000 $ US |
| 2003 | 2 631 743 683 $ US | 1 486 922 289 $ US |
| 2002 | 2 473 154 944 $ US | 1 491 147 236 $ US |
| 2001 | 2 464 772 781 $ US | 1 438 184 877 $ US |
| 2000 | 2 713 000 000 $ US | 1 148 300 000 $ US |
| 1999 | 2 492 900 000 $ US | 987 200 000 $ US |
| 1998 | 2 561 900 000 $ US | 924 900 000 $ US |
| 1997 | 2 390 700 000 $ US | 801 000 000 $ US |
| 1996 | 2 061 300 000 $ US | 735 200 000 $ US |
| 1995 | 1 991 000 000 $ US | 832 400 000 $ US |
| 1994 | 1 550 100 000 $ US | 697 500 000 $ US |
| 1993 | 1 363 200 000 $ US | 660 400 000 $ US |
| 1992 | 1 283 700 000 $ US | 614 000 000 $ US |
| 1991 | 1 230 000 000 $ US | 458 800 000 $ US |
| 1990 | 1 211 400 000 $ US | 356 100 000 $ US |
| 1989 | 1 126 100 000 $ US | 297 700 000 $ US |
| 1988 | 1 073 300 000 $ US | 195 800 000 $ US |
| 1987 | 977 900 000 $ US | 158 300 000 $ US |
| 1986 | 1 043 800 000 $ US | 123 700 000 $ US |
| 1985 | 1 059 700 000 $ US | 101 100 000 $ US |
| 1984 | 1 132 200 000 $ US | 96 000 000 $ US |
| 1983 | 1 091 700 000 $ US | 80 300 000 $ US |
| 1982 | 1 170 400 000 $ US | 107 600 000 $ US |
| 1981 | 1 291 300 000 $ US | 155 100 000 $ US |
| 1980 | 1 519 800 000 $ US | 211 200 000 $ US |
| 1979 | 1 221 400 000 $ US | 228 500 000 $ US |
| 1978 | 1 092 400 000 $ US | 183 800 000 $ US |
| 1977 | 1 160 200 000 $ US | 161 500 000 $ US |
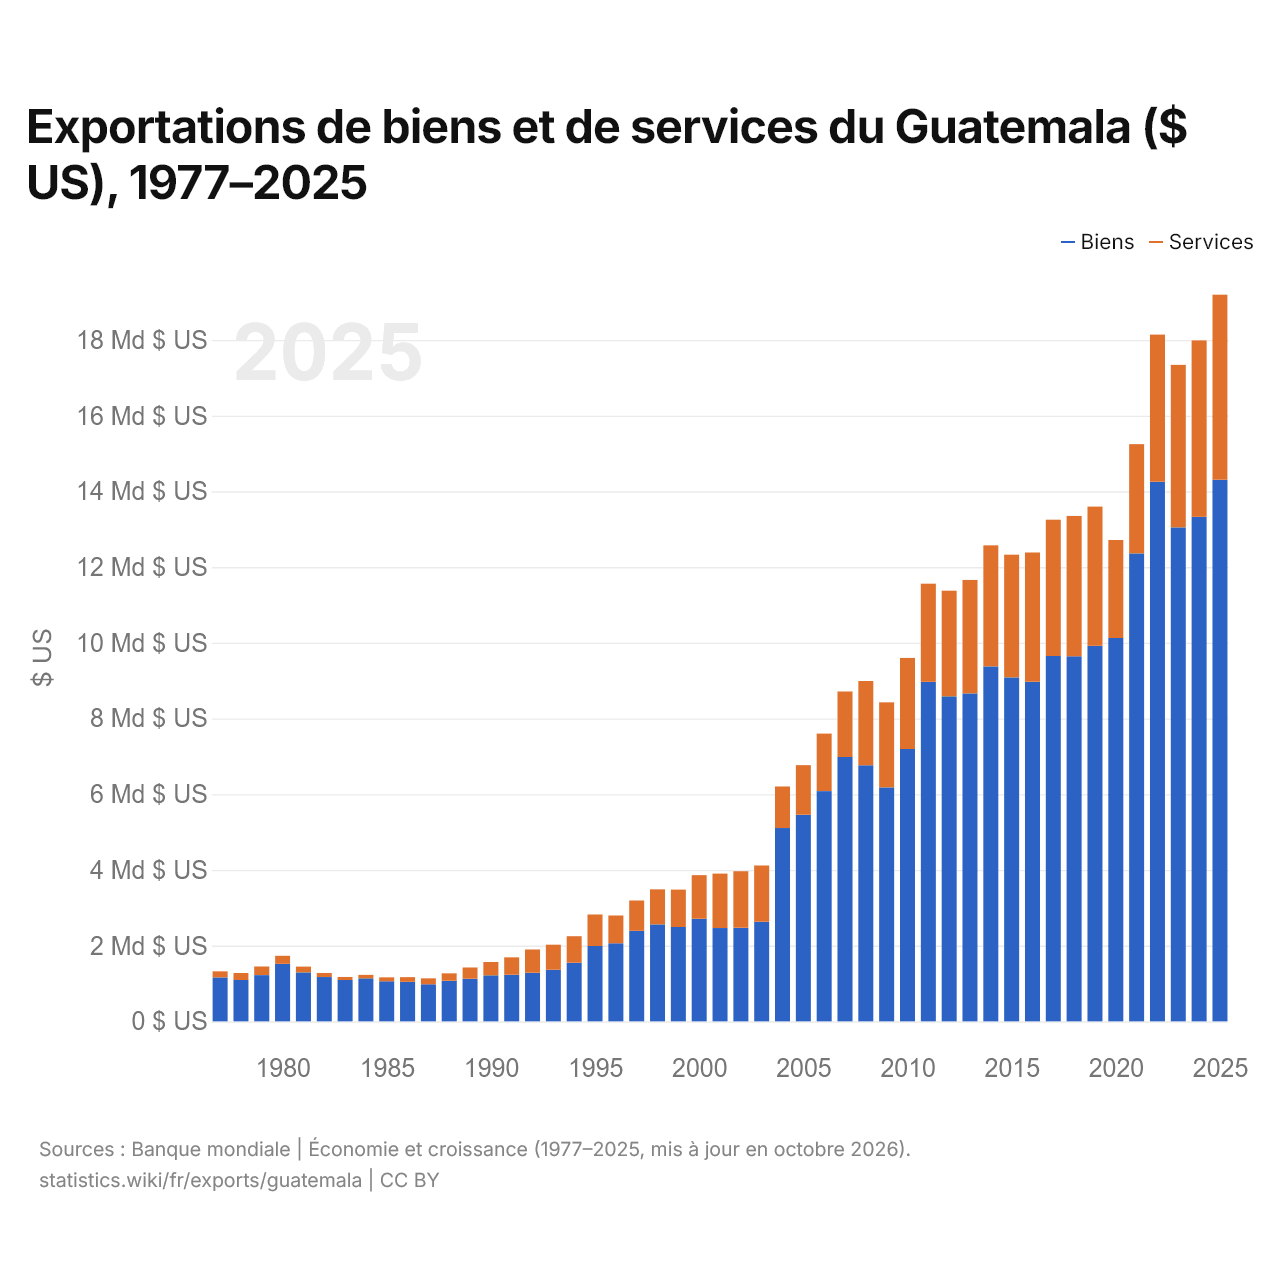
En 2025, les exportations de biens du Guatemala s'élevaient à 14,3 milliards de dollars et celles de services à 4,89 milliards de dollars ; les services représentaient 25,5 % du total, contre 12,2 % en 1977.
Le Guatemala dans le classement mondial des exportations, 2025







Exportations de biens et services du Guatemala, % du PIB, 1960–2025
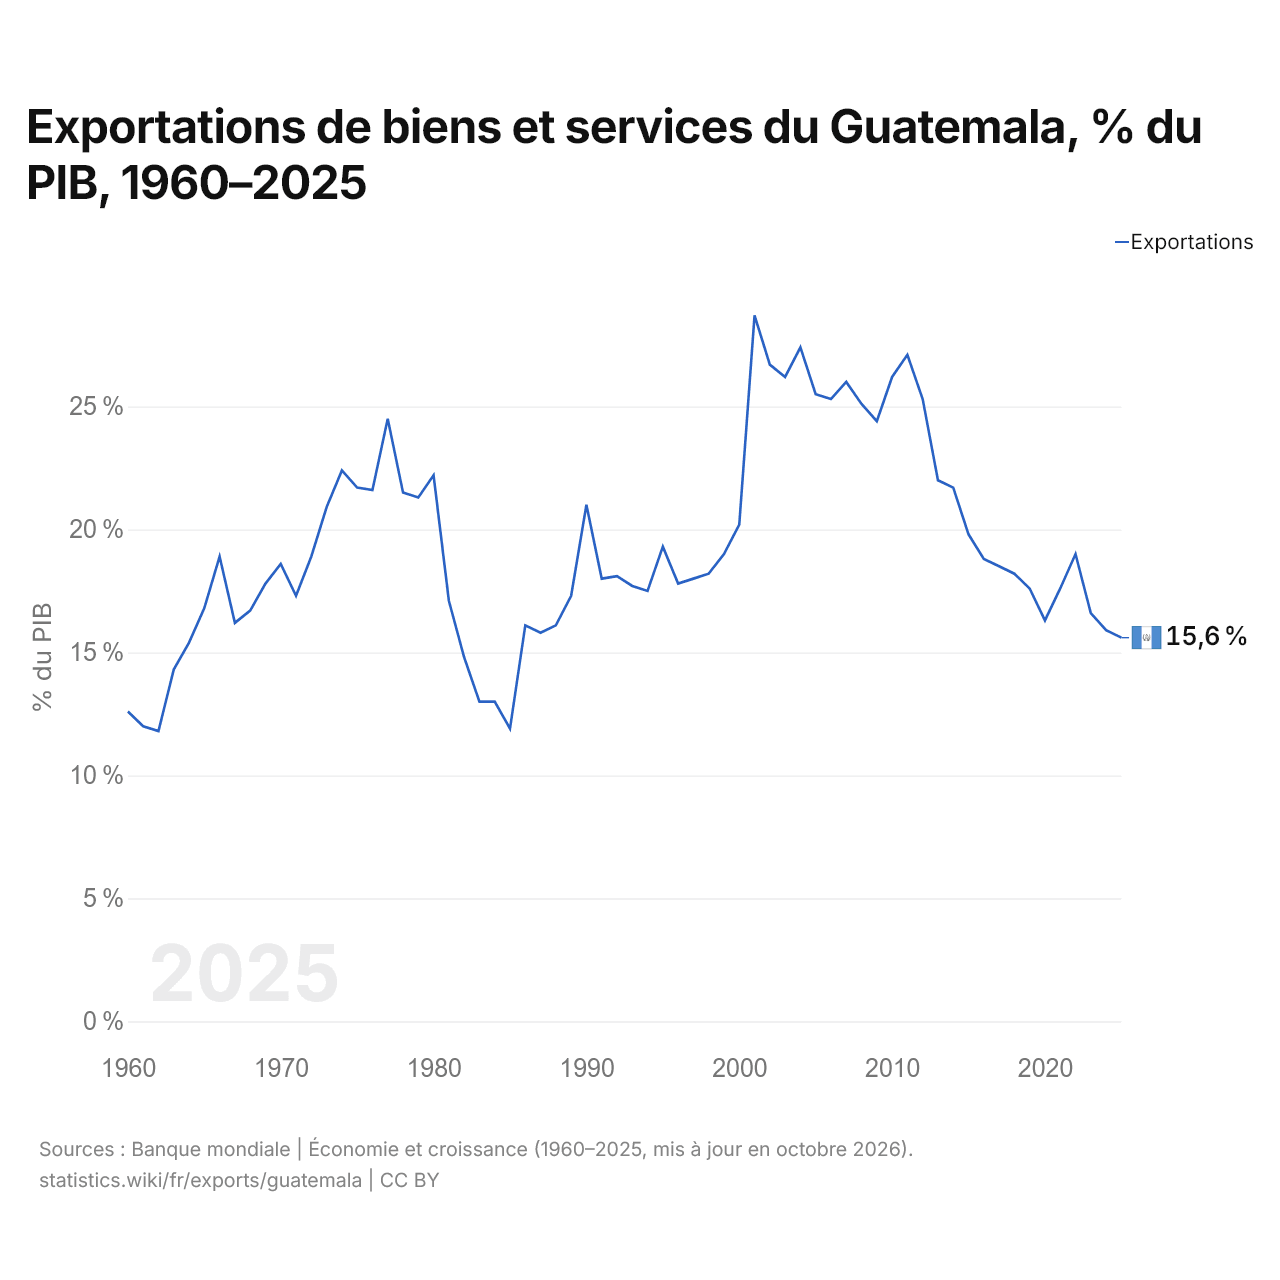
En 2025, les exportations de biens et services du Guatemala équivalaient à 15,6 % de son PIB, contre 12,6 % en 1960. La part la plus élevée a été de 28,7 %, en 2001.
Comparer les exportations du Guatemala avec celles d'autres pays
Sources :
- Banque mondiale | Économie et croissance (1960–2025, mis à jour en octobre 2026)
- TradeMap (2001–2025, mis à jour en octobre 2026)
Creative Commons Attribution (CC BY) : vous pouvez copier, partager, adapter et réutiliser ce contenu, y compris à des fins commerciales, à condition de citer statistics.wiki et d’indiquer les modifications apportées. Les sources citées ci-dessus peuvent avoir leurs propres conditions de licence.