
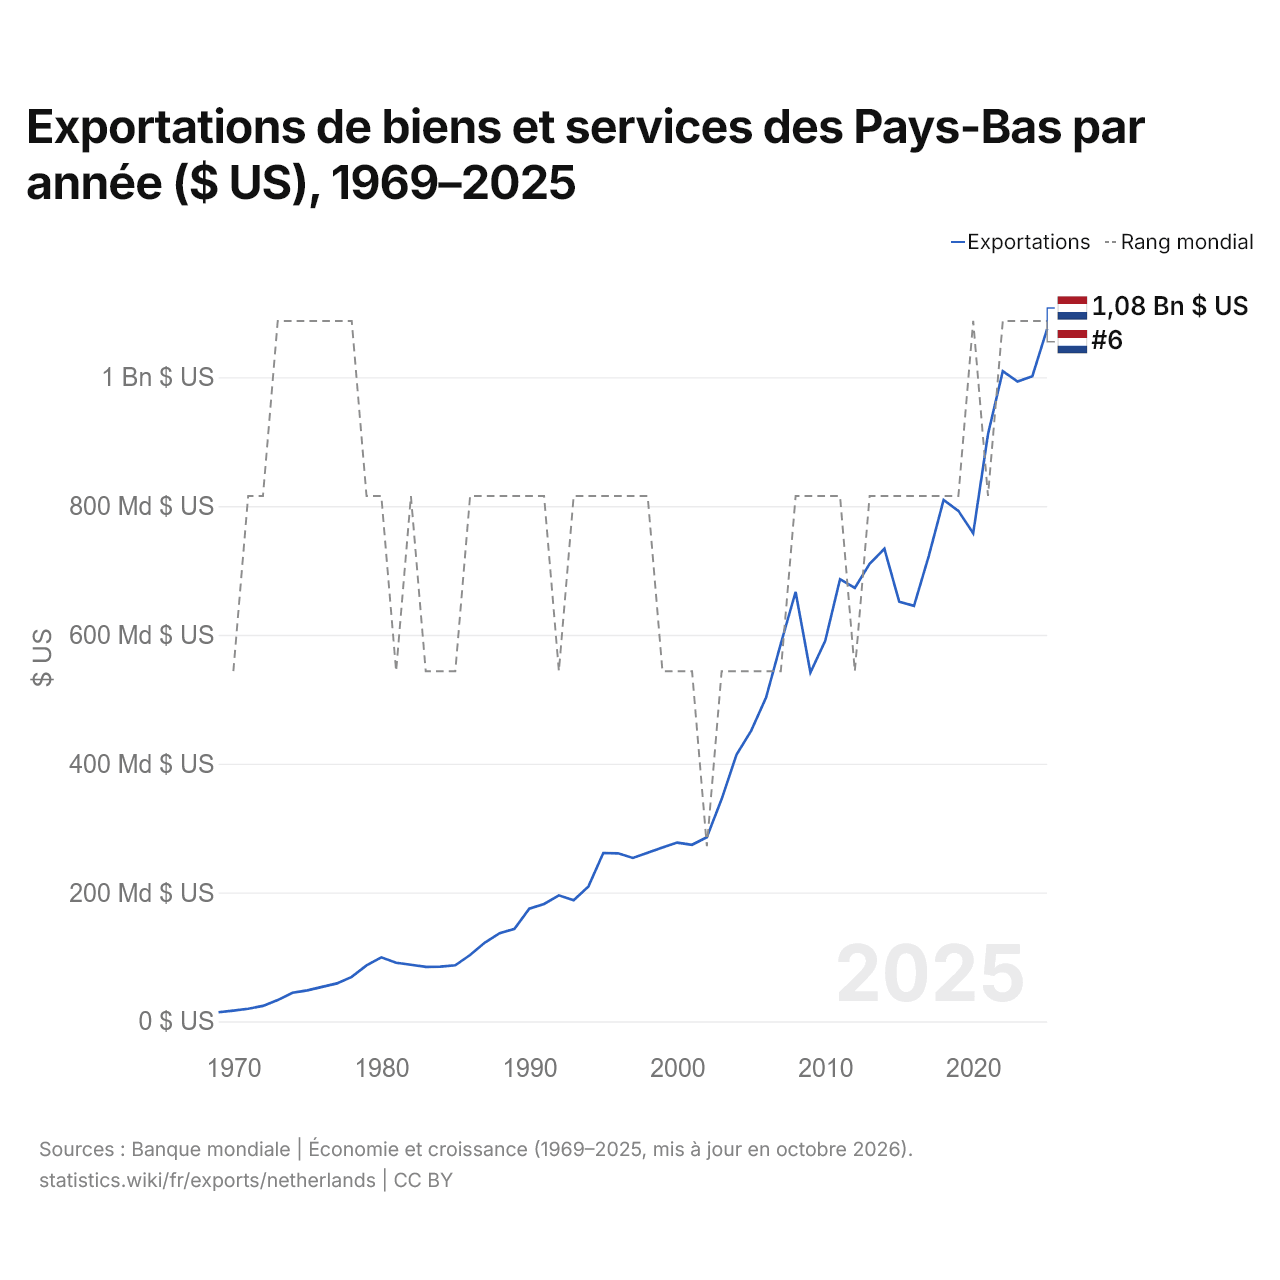
Exportations de biens et services des Pays-Bas par année ($ US), 1969–2025
| Année | $ US | Rang mondial |
|---|---|---|
| Exportations | Rang mondial | |
| 2025 | 1 075 134 885 756 $ US | #6 |
| 2024 | 1 001 469 281 570 $ US | #6 |
| 2023 | 993 383 113 412 $ US | #6 |
| 2022 | 1 009 321 846 482 $ US | #6 |
| 2021 | 911 591 180 291 $ US | #7 |
| 2020 | 757 626 674 439 $ US | #6 |
| 2019 | 792 548 771 333 $ US | #7 |
| 2018 | 809 393 154 293 $ US | #7 |
| 2017 | 722 521 486 847 $ US | #7 |
| 2016 | 644 981 374 821 $ US | #7 |
| 2015 | 651 561 445 020 $ US | #7 |
| 2014 | 733 707 070 162 $ US | #7 |
| 2013 | 710 442 214 009 $ US | #7 |
| 2012 | 672 962 028 019 $ US | #8 |
| 2011 | 686 455 260 574 $ US | #7 |
| 2010 | 590 650 523 650 $ US | #7 |
| 2009 | 541 451 746 607 $ US | #7 |
| 2008 | 666 753 754 959 $ US | #7 |
| 2007 | 586 439 887 283 $ US | #8 |
| 2006 | 502 638 809 838 $ US | #8 |
| 2005 | 451 318 628 109 $ US | #8 |
| 2004 | 413 899 788 533 $ US | #8 |
| 2003 | 345 031 067 457 $ US | #8 |
| 2002 | 285 816 678 856 $ US | #9 |
| 2001 | 274 109 208 169 $ US | #8 |
| 2000 | 277 498 466 740 $ US | #8 |
| 1999 | 269 992 081 764 $ US | #8 |
| 1998 | 261 751 832 926 $ US | #7 |
| 1997 | 253 701 152 022 $ US | #7 |
| 1996 | 260 884 967 320 $ US | #7 |
| 1995 | 261 325 830 360 $ US | #7 |
| 1994 | 209 535 513 985 $ US | #7 |
| 1993 | 187 817 236 592 $ US | #7 |
| 1992 | 195 617 498 747 $ US | #8 |
| 1991 | 182 235 627 063 $ US | #7 |
| 1990 | 174 901 597 483 $ US | #7 |
| 1989 | 143 549 099 034 $ US | #7 |
| 1988 | 136 821 844 130 $ US | #7 |
| 1987 | 122 354 540 905 $ US | #7 |
| 1986 | 103 000 590 034 $ US | #7 |
| 1985 | 87 007 504 644 $ US | #8 |
| 1984 | 84 859 203 297 $ US | #8 |
| 1983 | 84 582 826 809 $ US | #8 |
| 1982 | 87 857 010 811 $ US | #7 |
| 1981 | 90 974 239 159 $ US | #8 |
| 1980 | 99 352 813 123 $ US | #7 |
| 1979 | 86 827 436 010 $ US | #7 |
| 1978 | 69 032 180 689 $ US | #6 |
| 1977 | 58 924 320 733 $ US | #6 |
| 1976 | 53 523 223 871 $ US | #6 |
| 1975 | 48 070 418 264 $ US | #6 |
| 1974 | 44 381 674 727 $ US | #6 |
| 1973 | 32 943 078 196 $ US | #6 |
| 1972 | 23 953 249 107 $ US | #7 |
| 1971 | 19 538 182 331 $ US | #7 |
| 1970 | 16 625 163 450 $ US | #8 |
| 1969 | 14 107 826 092 $ US | - |
En 2025, les exportations de biens et services des Pays-Bas s'élevaient à 1,08 billion de dollars, contre 14,1 milliards de dollars en 1969. Elles se classaient au 6e rang mondial, un rang qu'elles occupent depuis 2022.
En 2025, les exportations de biens et services des Pays-Bas étaient les 4es plus élevées de 41 pays situés en Europe. Les importations de biens et services des Pays-Bas s'élevaient à 926 milliards de dollars en 2025, au 8e rang mondial. En 2025, les exportations des Pays-Bas dépassaient leurs importations de 150 milliards de dollars, soit un excédent commercial.
Exportations de biens des Pays-Bas par catégorie, 2025
Exportations de biens, 2025: 738 Md $US
En 2025, la première catégorie des exportations de biens des Pays-Bas était « machines, électronique et véhicules », avec 34,7 %, suivie de « produits chimiques, pharmaceutiques et plastiques », avec 15,8 %.
Destinations des exportations de biens des Pays-Bas : les 10 premières, 2025
| Rang | Pays | Exportations de biens | Part | |
|---|---|---|---|---|
| 1 |
 Allemagne |
164 Md $US | 22,2 % | vs Allemagne |
| 2 |
 Belgique |
84,8 Md $US | 11,5 % | vs Belgique |
| 3 |
 France |
55,8 Md $US | 7,57 % | vs France |
| 4 |
 Royaume-Uni |
46,7 Md $US | 6,33 % | vs R.-U. |
| 5 |
 États-Unis |
36,3 Md $US | 4,92 % | vs USA |
| 6 |
 Italie |
32,4 Md $US | 4,4 % | vs Italie |
| 7 |
 Espagne |
26,2 Md $US | 3,55 % | vs Espagne |
| 8 |
 Pologne |
24,0 Md $US | 3,26 % | vs Pologne |
| 9 |
 Chine |
21,1 Md $US | 2,86 % | |
| 10 |
 Suède |
14,4 Md $US | 1,96 % | vs Suède |
| Autres partenaires et non précisés | 232 Md $US | 31,5 % |
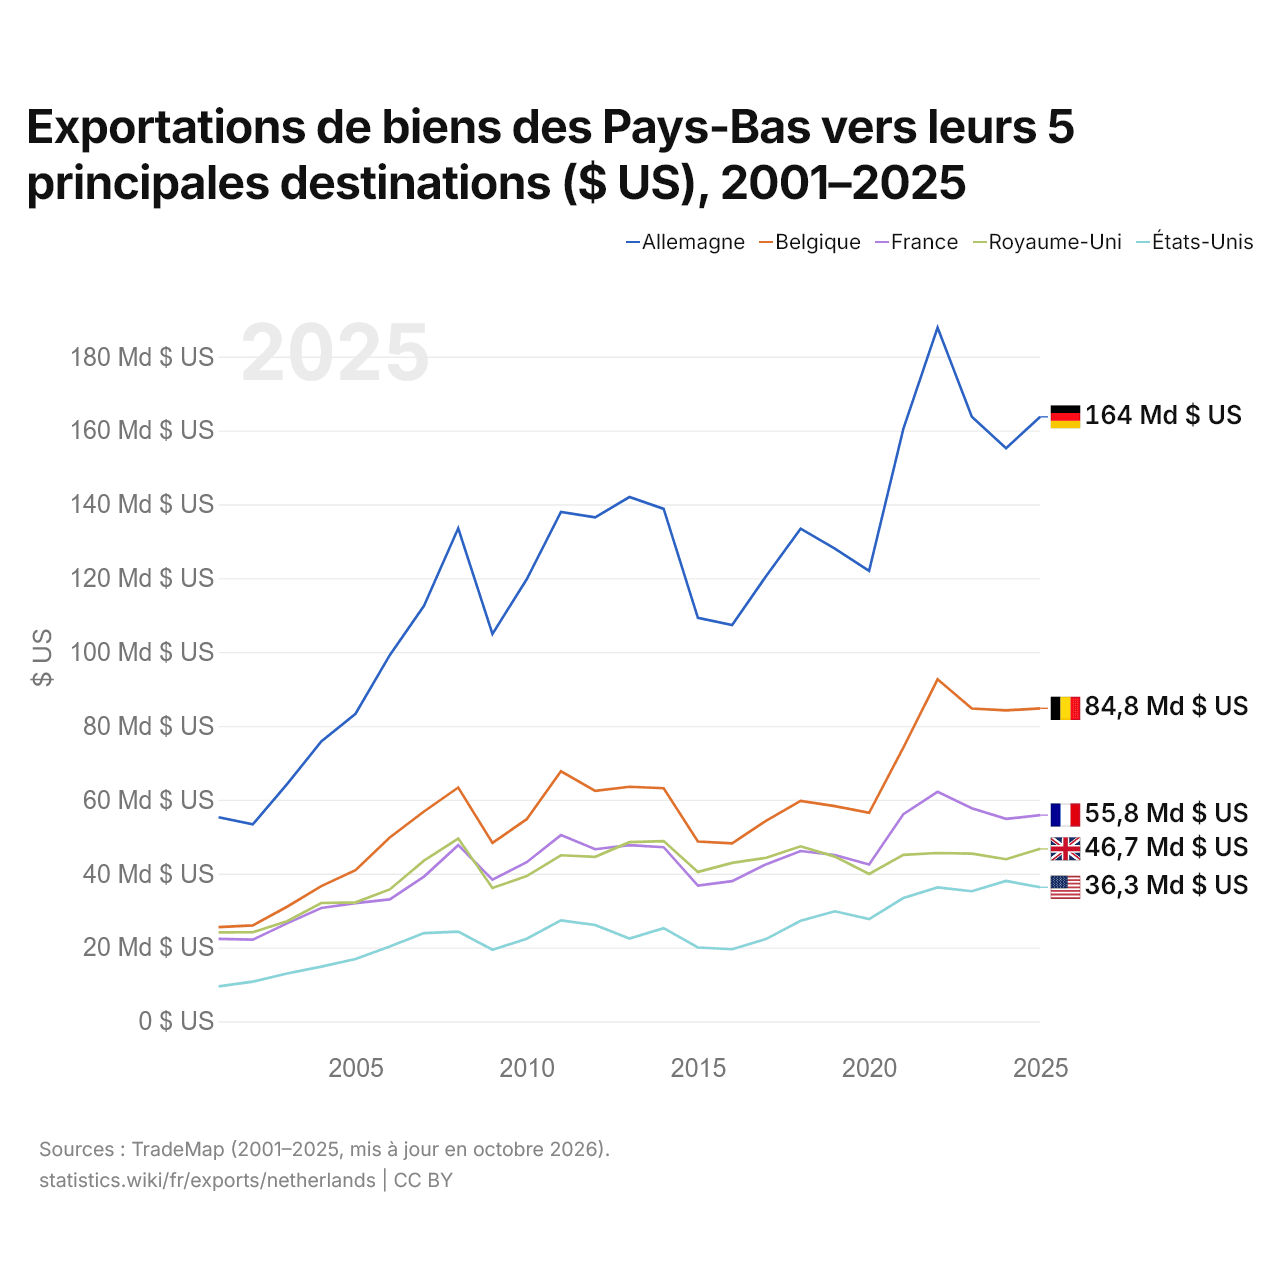
Exportations de biens des Pays-Bas vers leurs 5 principales destinations ($ US), 2001–2025
| Année | $ US | ||||
|---|---|---|---|---|---|
| Allemagne | Belgique | France | Royaume-Uni | États-Unis | |
| 2025 | 163 686 285 000 $ US | 84 757 393 000 $ US | 55 841 308 000 $ US | 46 721 543 000 $ US | 36 290 553 000 $ US |
| 2024 | 155 209 911 000 $ US | 84 182 555 000 $ US | 54 818 644 000 $ US | 43 893 528 000 $ US | 38 003 705 000 $ US |
| 2023 | 163 737 655 000 $ US | 84 700 927 000 $ US | 57 723 266 000 $ US | 45 414 511 000 $ US | 35 225 351 000 $ US |
| 2022 | 187 847 252 000 $ US | 92 610 776 000 $ US | 62 138 394 000 $ US | 45 574 642 000 $ US | 36 278 811 000 $ US |
| 2021 | 160 431 582 000 $ US | 74 138 079 000 $ US | 56 098 787 000 $ US | 45 084 222 000 $ US | 33 382 281 000 $ US |
| 2020 | 121 983 772 000 $ US | 56 465 474 000 $ US | 42 457 426 000 $ US | 39 909 634 000 $ US | 27 675 366 000 $ US |
| 2019 | 128 001 848 000 $ US | 58 276 374 000 $ US | 45 055 085 000 $ US | 44 606 957 000 $ US | 29 803 576 000 $ US |
| 2018 | 133 411 614 000 $ US | 59 690 541 000 $ US | 46 114 179 000 $ US | 47 393 444 000 $ US | 27 233 418 000 $ US |
| 2017 | 120 674 246 000 $ US | 54 364 264 000 $ US | 42 561 133 000 $ US | 44 297 078 000 $ US | 22 343 210 000 $ US |
| 2016 | 107 318 599 000 $ US | 48 189 121 000 $ US | 37 957 926 000 $ US | 42 895 466 000 $ US | 19 528 168 000 $ US |
| 2015 | 109 257 782 000 $ US | 48 705 526 000 $ US | 36 738 248 000 $ US | 40 459 469 000 $ US | 20 000 755 000 $ US |
| 2014 | 138 757 278 000 $ US | 63 111 295 000 $ US | 47 149 109 000 $ US | 48 817 621 000 $ US | 25 230 276 000 $ US |
| 2013 | 141 981 268 000 $ US | 63 517 802 000 $ US | 47 724 948 000 $ US | 48 518 681 000 $ US | 22 427 187 000 $ US |
| 2012 | 136 461 769 000 $ US | 62 389 322 000 $ US | 46 609 439 000 $ US | 44 548 079 000 $ US | 26 087 282 000 $ US |
| 2011 | 137 940 814 000 $ US | 67 722 182 000 $ US | 50 424 792 000 $ US | 44 969 452 000 $ US | 27 353 419 000 $ US |
| 2010 | 119 690 613 000 $ US | 54 730 614 000 $ US | 43 089 328 000 $ US | 39 323 542 000 $ US | 22 351 271 000 $ US |
| 2009 | 104 921 006 000 $ US | 48 299 830 000 $ US | 38 347 761 000 $ US | 36 107 419 000 $ US | 19 381 023 000 $ US |
| 2008 | 133 509 595 000 $ US | 63 312 897 000 $ US | 47 707 807 000 $ US | 49 490 835 000 $ US | 24 293 453 000 $ US |
| 2007 | 112 490 195 000 $ US | 56 823 199 000 $ US | 39 195 282 000 $ US | 43 508 163 000 $ US | 23 904 586 000 $ US |
| 2006 | 99 146 668 000 $ US | 49 767 758 000 $ US | 33 023 335 000 $ US | 35 714 631 000 $ US | 20 289 209 000 $ US |
| 2005 | 83 272 317 000 $ US | 40 914 697 000 $ US | 32 004 652 000 $ US | 32 219 564 000 $ US | 16 893 022 000 $ US |
| 2004 | 75 773 807 000 $ US | 36 606 944 000 $ US | 30 705 348 000 $ US | 32 052 954 000 $ US | 14 815 764 000 $ US |
| 2003 | 64 216 028 000 $ US | 31 037 426 000 $ US | 26 533 338 000 $ US | 27 099 924 000 $ US | 12 957 978 000 $ US |
| 2002 | 53 348 195 000 $ US | 25 964 662 000 $ US | 22 107 628 000 $ US | 24 116 274 000 $ US | 10 749 342 000 $ US |
| 2001 | 55 260 689 000 $ US | 25 530 576 000 $ US | 22 343 514 000 $ US | 24 080 586 000 $ US | 9 452 658 000 $ US |
En 2025, les exportations de biens s'élevaient à 164 milliards de dollars vers l'Allemagne, 84,8 milliards de dollars vers la Belgique, 55,8 milliards de dollars vers la France, 46,7 milliards de dollars vers le Royaume-Uni et 36,3 milliards de dollars vers les États-Unis. Le premier rang des cinq destinations des Pays-Bas est occupé par l'Allemagne chaque année depuis 2001. Le changement le plus récent dans leur ordre remonte à 2019, quand les exportations des Pays-Bas vers la France ont dépassé celles vers le Royaume-Uni.
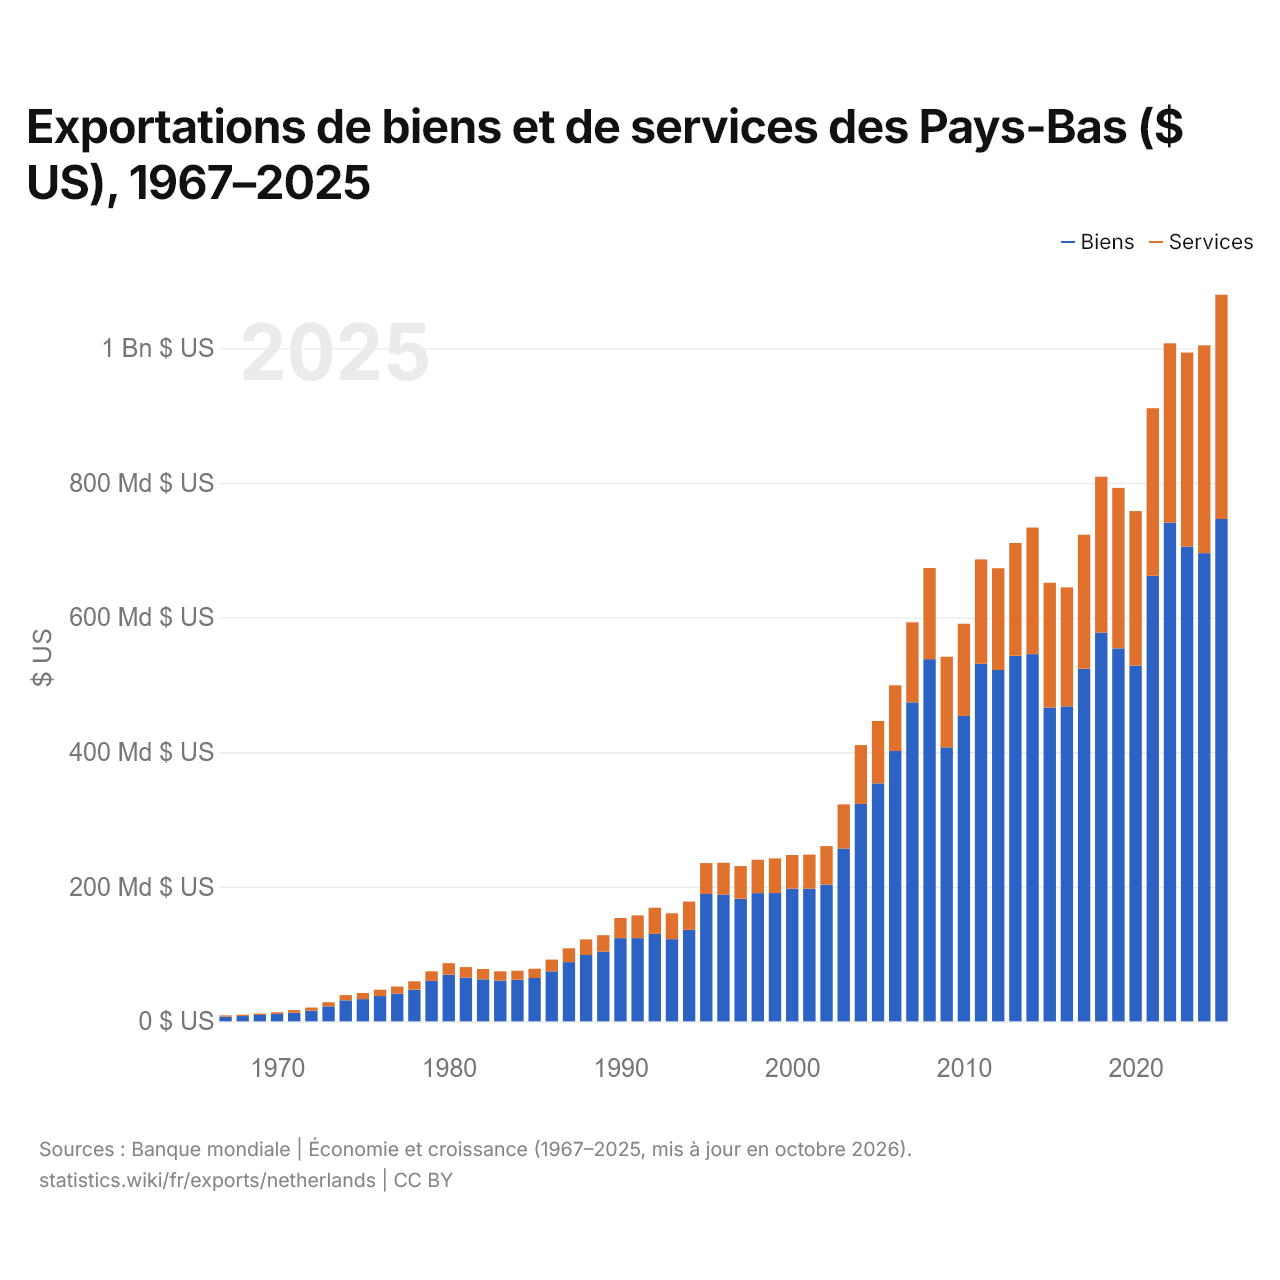
Exportations de biens et de services des Pays-Bas ($ US), 1967–2025
| Année | $ US | |
|---|---|---|
| Biens | Services | |
| 2025 | 746 265 052 871 $ US | 333 234 343 491 $ US |
| 2024 | 695 588 637 138 $ US | 308 684 205 694 $ US |
| 2023 | 705 171 339 907 $ US | 288 202 149 716 $ US |
| 2022 | 740 916 805 824 $ US | 266 408 940 710 $ US |
| 2021 | 661 944 645 166 $ US | 248 849 982 010 $ US |
| 2020 | 528 628 377 913 $ US | 229 330 462 609 $ US |
| 2019 | 554 114 171 611 $ US | 238 399 113 640 $ US |
| 2018 | 577 507 195 277 $ US | 231 558 124 026 $ US |
| 2017 | 523 792 884 647 $ US | 199 196 879 478 $ US |
| 2016 | 467 851 138 029 $ US | 176 791 860 228 $ US |
| 2015 | 465 926 691 583 $ US | 185 652 014 353 $ US |
| 2014 | 545 477 742 356 $ US | 187 969 583 456 $ US |
| 2013 | 543 031 381 401 $ US | 167 560 278 210 $ US |
| 2012 | 521 978 373 232 $ US | 151 128 919 904 $ US |
| 2011 | 531 383 622 945 $ US | 154 847 736 685 $ US |
| 2010 | 453 822 352 245 $ US | 136 847 246 188 $ US |
| 2009 | 407 165 941 300 $ US | 134 534 954 500 $ US |
| 2008 | 537 979 459 026 $ US | 135 393 596 337 $ US |
| 2007 | 473 791 646 421 $ US | 118 962 686 256 $ US |
| 2006 | 401 569 404 286 $ US | 97 648 444 589 $ US |
| 2005 | 353 609 264 856 $ US | 92 556 139 378 $ US |
| 2004 | 323 061 244 533 $ US | 87 274 746 152 $ US |
| 2003 | 256 485 715 911 $ US | 65 795 334 749 $ US |
| 2002 | 203 106 984 390 $ US | 57 238 370 781 $ US |
| 2001 | 196 832 722 935 $ US | 50 883 020 267 $ US |
| 2000 | 197 280 082 904 $ US | 49 852 428 686 $ US |
| 1999 | 190 553 239 279 $ US | 51 403 792 120 $ US |
| 1998 | 190 500 031 135 $ US | 49 575 299 214 $ US |
| 1997 | 181 972 017 462 $ US | 48 681 566 470 $ US |
| 1996 | 188 376 946 372 $ US | 47 268 360 948 $ US |
| 1995 | 189 150 611 163 $ US | 45 968 603 824 $ US |
| 1994 | 135 882 924 199 $ US | 42 043 191 676 $ US |
| 1993 | 122 031 691 654 $ US | 38 408 485 367 $ US |
| 1992 | 129 904 129 443 $ US | 38 938 812 817 $ US |
| 1991 | 123 625 382 231 $ US | 33 646 478 862 $ US |
| 1990 | 123 503 544 012 $ US | 29 964 062 536 $ US |
| 1989 | 103 555 844 653 $ US | 24 476 253 642 $ US |
| 1988 | 98 479 037 576 $ US | 23 188 966 398 $ US |
| 1987 | 87 864 238 902 $ US | 20 655 350 359 $ US |
| 1986 | 74 319 456 563 $ US | 17 464 055 788 $ US |
| 1985 | 64 432 939 807 $ US | 13 717 570 921 $ US |
| 1984 | 61 757 940 514 $ US | 13 414 817 557 $ US |
| 1983 | 60 638 322 858 $ US | 13 684 814 193 $ US |
| 1982 | 62 308 629 792 $ US | 15 459 977 013 $ US |
| 1981 | 64 976 077 744 $ US | 15 588 643 226 $ US |
| 1980 | 69 209 908 050 $ US | 17 154 948 816 $ US |
| 1979 | 60 036 264 487 $ US | 14 329 814 488 $ US |
| 1978 | 46 791 808 052 $ US | 12 679 163 529 $ US |
| 1977 | 41 061 044 656 $ US | 10 519 186 677 $ US |
| 1976 | 37 521 874 883 $ US | 9 350 784 318 $ US |
| 1975 | 33 053 023 233 $ US | 8 977 378 582 $ US |
| 1974 | 31 348 763 346 $ US | 7 651 034 567 $ US |
| 1973 | 22 316 565 605 $ US | 6 080 745 805 $ US |
| 1972 | 15 869 474 328 $ US | 4 572 230 538 $ US |
| 1971 | 12 756 190 342 $ US | 3 891 249 720 $ US |
| 1970 | 11 058 839 771 $ US | 2 537 569 059 $ US |
| 1969 | 9 365 193 363 $ US | 2 276 519 335 $ US |
| 1968 | 7 806 353 586 $ US | 2 093 646 407 $ US |
| 1967 | 6 894 198 890 $ US | 1 893 093 921 $ US |
En 2025, les exportations de biens des Pays-Bas s'élevaient à 746 milliards de dollars et celles de services à 333 milliards de dollars ; les services représentaient 30,9 % du total, contre 21,5 % en 1967.
Les Pays-Bas dans le classement mondial des exportations, 2025
| Rang | Pays | Exportations | Part mondiale | |
|---|---|---|---|---|
| 3 |
Allemagne
|
2,04 Bn $US | 5,85 % | vs Allemagne |
| 4 |
Royaume-Uni
|
1,22 Bn $US | 3,51 % | vs R.-U. |
| 5 |
France
|
1,12 Bn $US | 3,22 % | vs France |
| 6 |
 Pays-Bas |
1,08 Bn $US | 3,08 % | |
| 7 |
 Singapour |
1,07 Bn $US | 3,08 % | |
| 8 |
 Irlande |
1,01 Bn $US | 2,9 % | vs Irlande |
| 9 |
 Japon |
971 Md $US | 2,78 % | vs Japon |
Exportations de biens et services des Pays-Bas, % du PIB, 1969–2025
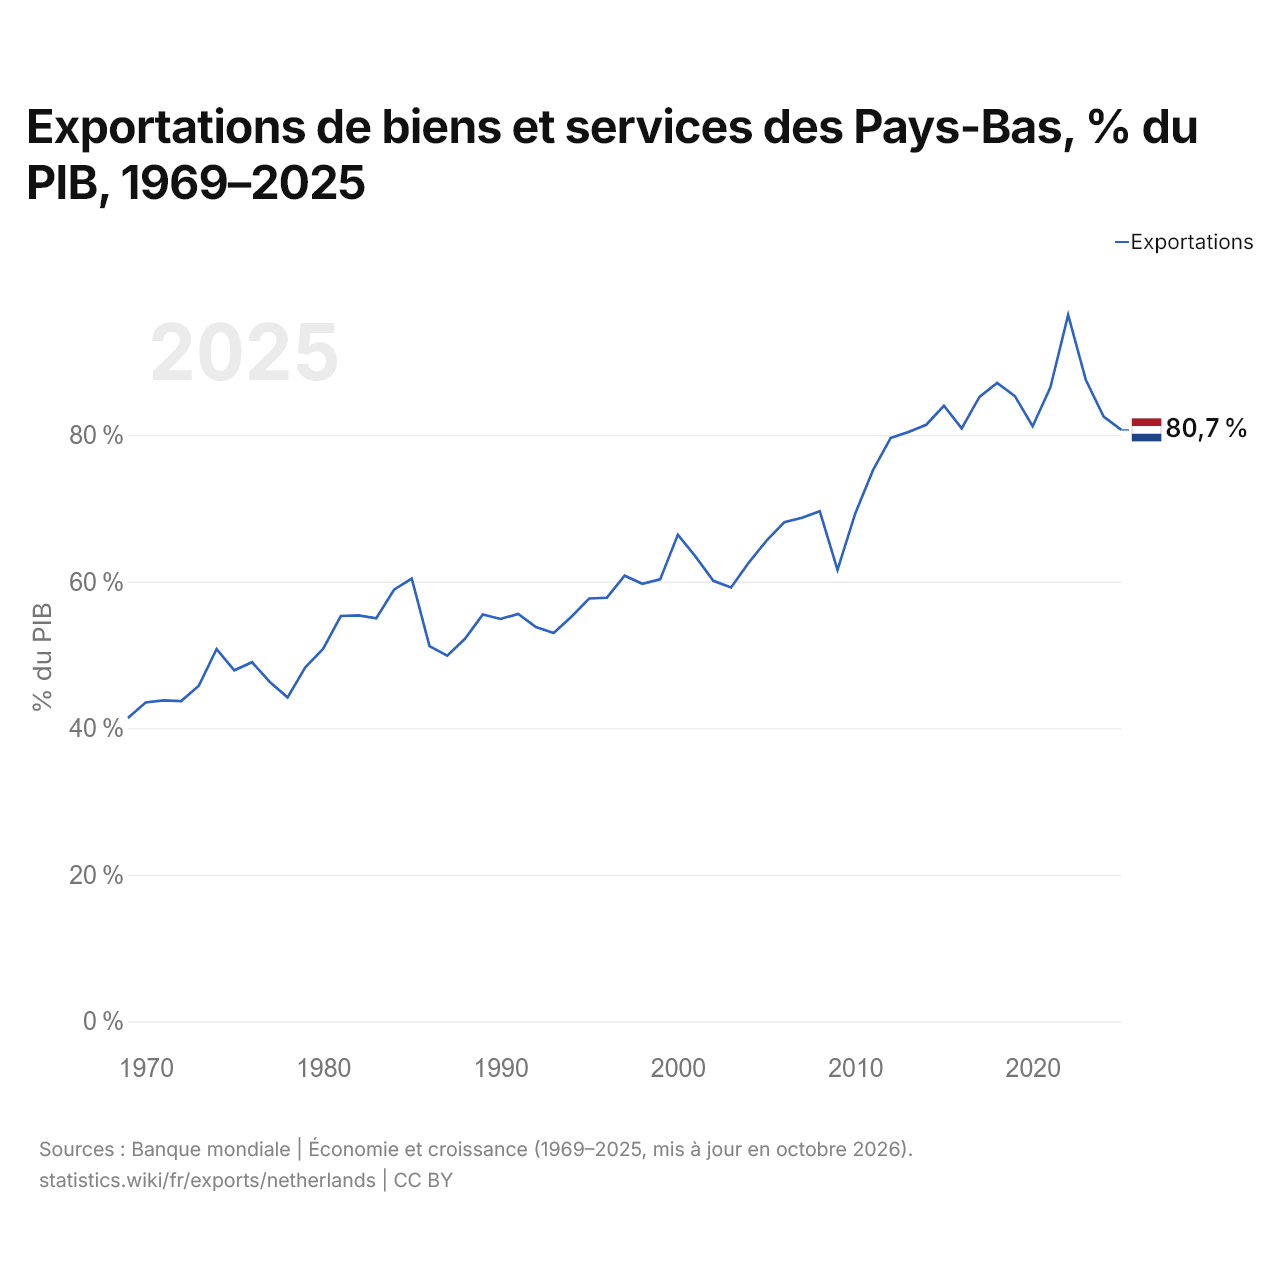
En 2025, les exportations de biens et services des Pays-Bas équivalaient à 80,7 % de leur PIB, contre 41,4 % en 1969. La part la plus élevée a été de 96,4 %, en 2022.
Comparer les exportations des Pays-Bas avec celles d'autres pays
Sources :
- TradeMap (2001–2025, mis à jour en octobre 2026)
- Banque mondiale | Économie et croissance (1967–2025, mis à jour en octobre 2026)
Creative Commons Attribution (CC BY) : vous pouvez copier, partager, adapter et réutiliser ce contenu, y compris à des fins commerciales, à condition de citer statistics.wiki et d’indiquer les modifications apportées. Les sources citées ci-dessus peuvent avoir leurs propres conditions de licence.