
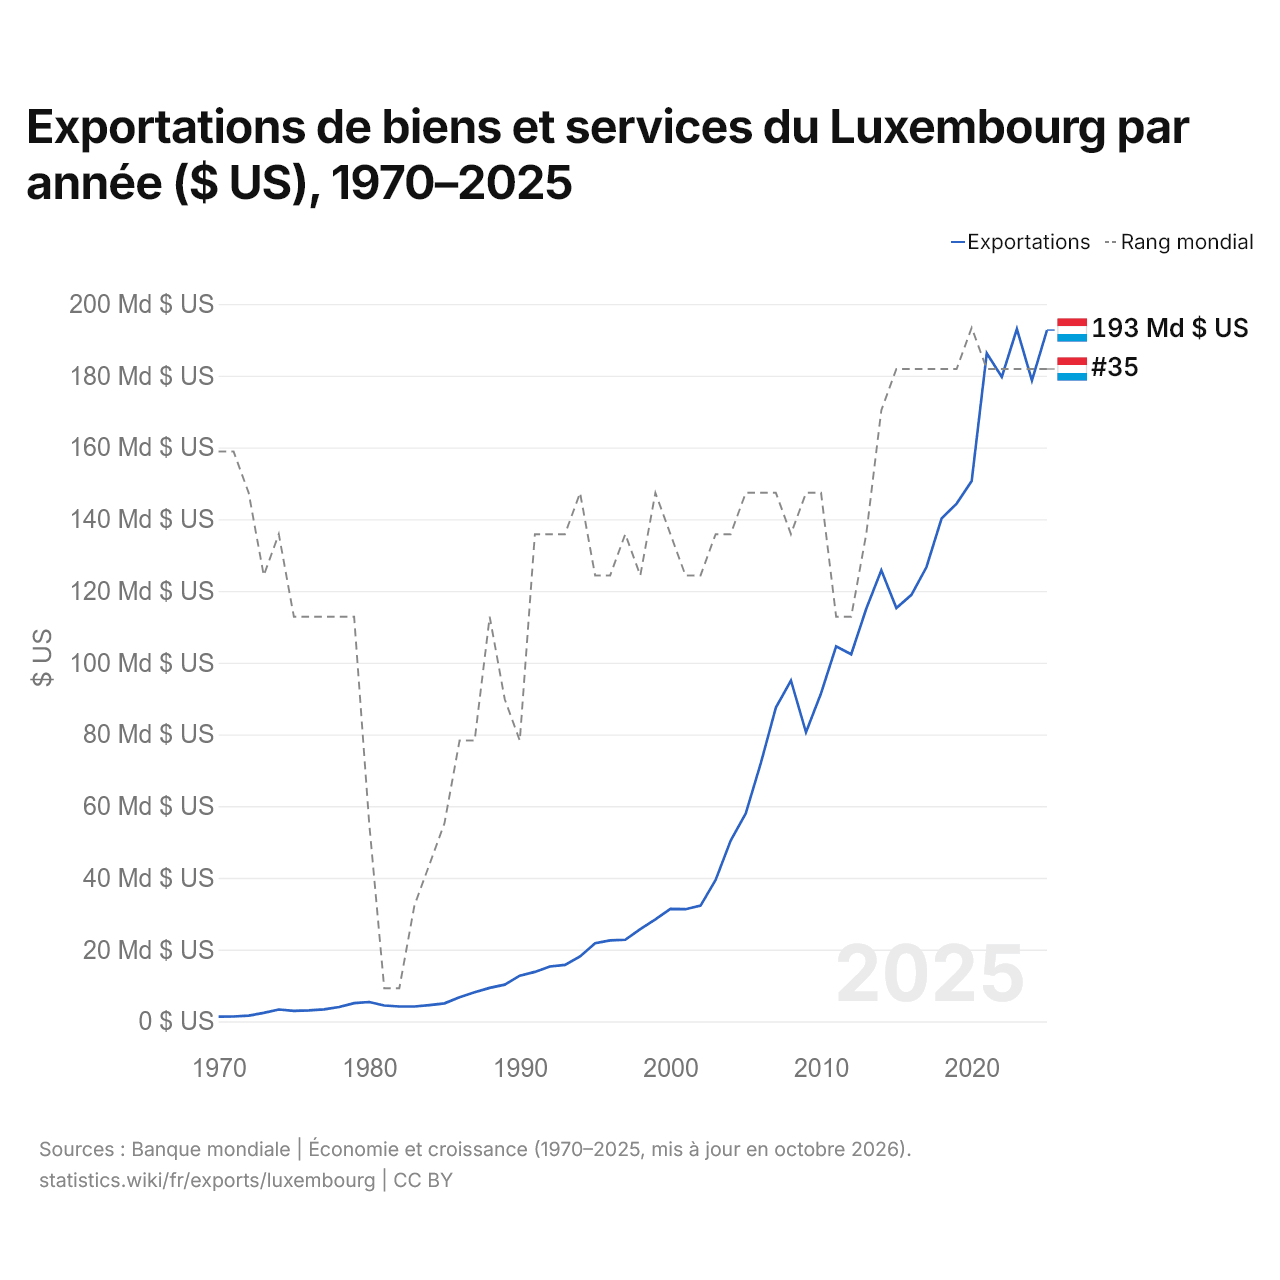
Exportations de biens et services du Luxembourg par année ($ US), 1970–2025
| Année | $ US | Rang mondial |
|---|---|---|
| Exportations | Rang mondial | |
| 2025 | 192 728 057 158 $ US | #35 |
| 2024 | 178 661 670 861 $ US | #35 |
| 2023 | 193 009 113 165 $ US | #35 |
| 2022 | 179 628 968 244 $ US | #35 |
| 2021 | 186 265 544 320 $ US | #35 |
| 2020 | 150 610 309 021 $ US | #34 |
| 2019 | 144 341 752 039 $ US | #35 |
| 2018 | 140 193 787 083 $ US | #35 |
| 2017 | 126 658 587 133 $ US | #35 |
| 2016 | 118 895 618 024 $ US | #35 |
| 2015 | 115 238 581 123 $ US | #35 |
| 2014 | 125 763 218 896 $ US | #36 |
| 2013 | 115 007 710 906 $ US | #39 |
| 2012 | 102 344 215 079 $ US | #41 |
| 2011 | 104 568 486 413 $ US | #41 |
| 2010 | 91 465 696 293 $ US | #38 |
| 2009 | 80 570 783 796 $ US | #38 |
| 2008 | 95 030 426 101 $ US | #39 |
| 2007 | 87 480 215 781 $ US | #38 |
| 2006 | 71 977 613 140 $ US | #38 |
| 2005 | 57 949 162 558 $ US | #38 |
| 2004 | 50 400 230 064 $ US | #39 |
| 2003 | 39 412 388 094 $ US | #39 |
| 2002 | 32 249 319 538 $ US | #40 |
| 2001 | 31 268 767 983 $ US | #40 |
| 2000 | 31 345 279 140 $ US | #39 |
| 1999 | 28 455 196 289 $ US | #38 |
| 1998 | 25 731 039 120 $ US | #40 |
| 1997 | 22 737 276 725 $ US | #39 |
| 1996 | 22 562 990 228 $ US | #40 |
| 1995 | 21 787 067 597 $ US | #40 |
| 1994 | 18 080 553 412 $ US | #38 |
| 1993 | 15 744 739 972 $ US | #39 |
| 1992 | 15 301 225 847 $ US | #39 |
| 1991 | 13 779 657 413 $ US | #39 |
| 1990 | 12 742 102 849 $ US | #44 |
| 1989 | 10 219 753 276 $ US | #43 |
| 1988 | 9 327 494 240 $ US | #41 |
| 1987 | 8 110 552 134 $ US | #44 |
| 1986 | 6 703 202 998 $ US | #44 |
| 1985 | 5 014 838 644 $ US | #46 |
| 1984 | 4 532 564 926 $ US | #47 |
| 1983 | 4 124 129 389 $ US | #48 |
| 1982 | 4 137 952 499 $ US | #50 |
| 1981 | 4 423 440 895 $ US | #50 |
| 1980 | 5 383 032 142 $ US | #46 |
| 1979 | 5 067 336 269 $ US | #41 |
| 1978 | 3 993 266 299 $ US | #41 |
| 1977 | 3 324 898 143 $ US | #41 |
| 1976 | 3 047 749 216 $ US | #41 |
| 1975 | 2 917 697 708 $ US | #41 |
| 1974 | 3 300 803 645 $ US | #39 |
| 1973 | 2 355 188 367 $ US | #40 |
| 1972 | 1 592 229 860 $ US | #38 |
| 1971 | 1 352 359 884 $ US | #37 |
| 1970 | 1 308 913 271 $ US | #37 |
En 2025, les exportations de biens et services du Luxembourg s'élevaient à 193 milliards de dollars, contre 1,31 milliard de dollars en 1970. Elles se classaient au 35e rang mondial, un rang qu'elles occupent depuis 2021. Leur meilleur rang a été le 34e, occupé pour la dernière fois en 2020.
En 2025, les exportations de biens et services du Luxembourg étaient les 17es plus élevées de 41 pays situés en Europe. Les importations de biens et services du Luxembourg s'élevaient à 161 milliards de dollars en 2025, au 38e rang mondial. En 2025, les exportations du Luxembourg dépassaient ses importations de 31,5 milliards de dollars, soit un excédent commercial.
Exportations de biens du Luxembourg par catégorie, 2025
Exportations de biens, 2025: 16,7 Md $US
En 2025, la première catégorie des exportations de biens du Luxembourg était « machines, électronique et véhicules », avec 29,0 %, suivie de « métaux communs (fer, acier, cuivre, aluminium) », avec 17,9 %.
Destinations des exportations de biens du Luxembourg : les 10 premières, 2025
| Rang | Pays | Exportations de biens | Part | |
|---|---|---|---|---|
| 1 |
 Allemagne |
4,21 Md $US | 25,3 % | vs Allemagne |
| 2 |
 France |
2,58 Md $US | 15,5 % | vs France |
| 3 |
 Belgique |
2,37 Md $US | 14,2 % | vs Belgique |
| 4 |
 Pays-Bas |
1,09 Md $US | 6,56 % | vs Pays-Bas |
| 5 |
 Italie |
695 M $US | 4,17 % | vs Italie |
| 6 |
 Espagne |
568 M $US | 3,41 % | vs Espagne |
| 7 |
 États-Unis |
439 M $US | 2,63 % | vs USA |
| 8 |
 Pologne |
425 M $US | 2,55 % | vs Pologne |
| 9 |
 Royaume-Uni |
392 M $US | 2,35 % | vs R.-U. |
| 10 |
 Autriche |
332 M $US | 1,99 % | |
| Autres partenaires et non précisés | 3,57 Md $US | 21,4 % |
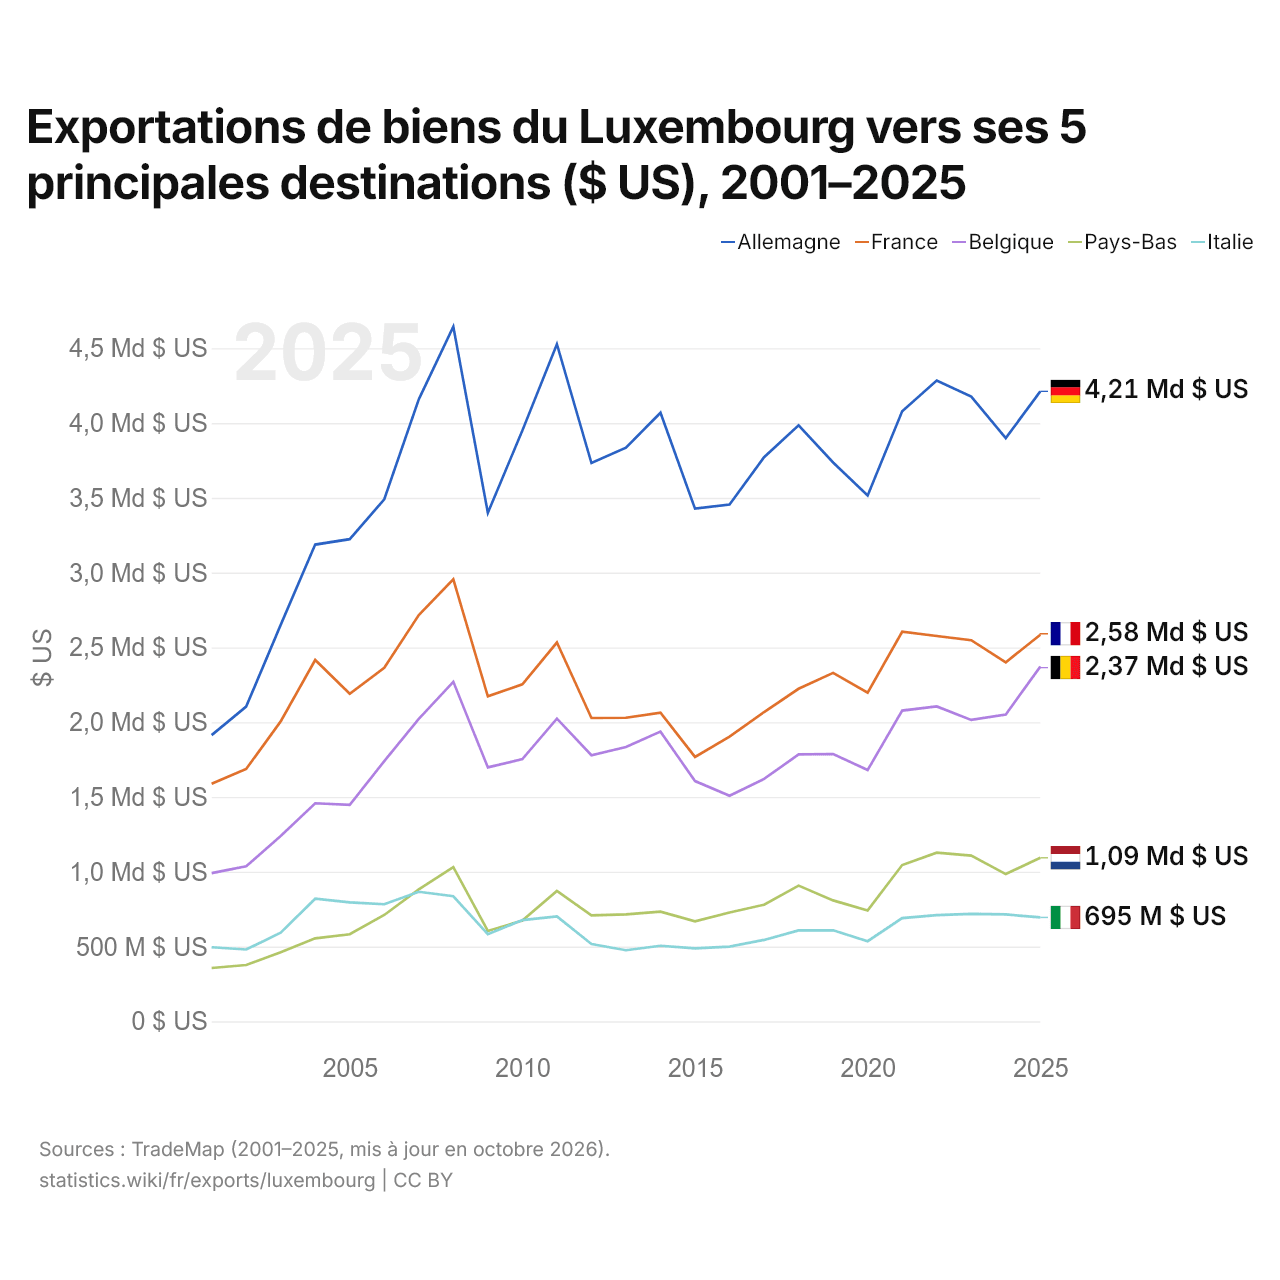
Exportations de biens du Luxembourg vers ses 5 principales destinations ($ US), 2001–2025
| Année | $ US | ||||
|---|---|---|---|---|---|
| Allemagne | France | Belgique | Pays-Bas | Italie | |
| 2025 | 4 211 951 000 $ US | 2 584 723 000 $ US | 2 371 713 000 $ US | 1 093 413 000 $ US | 694 648 000 $ US |
| 2024 | 3 898 944 000 $ US | 2 400 405 000 $ US | 2 051 691 000 $ US | 984 530 000 $ US | 714 938 000 $ US |
| 2023 | 4 176 895 000 $ US | 2 548 257 000 $ US | 2 015 390 000 $ US | 1 108 283 000 $ US | 717 946 000 $ US |
| 2022 | 4 284 106 000 $ US | 2 576 305 000 $ US | 2 105 054 000 $ US | 1 127 272 000 $ US | 709 885 000 $ US |
| 2021 | 4 078 909 000 $ US | 2 604 472 000 $ US | 2 077 803 000 $ US | 1 044 911 000 $ US | 690 452 000 $ US |
| 2020 | 3 516 245 000 $ US | 2 197 812 000 $ US | 1 680 301 000 $ US | 741 583 000 $ US | 535 445 000 $ US |
| 2019 | 3 735 992 000 $ US | 2 329 697 000 $ US | 1 787 328 000 $ US | 808 705 000 $ US | 608 357 000 $ US |
| 2018 | 3 985 017 000 $ US | 2 223 434 000 $ US | 1 784 449 000 $ US | 907 386 000 $ US | 607 760 000 $ US |
| 2017 | 3 771 546 000 $ US | 2 068 072 000 $ US | 1 620 574 000 $ US | 779 627 000 $ US | 544 310 000 $ US |
| 2016 | 3 455 047 000 $ US | 1 903 080 000 $ US | 1 507 838 000 $ US | 727 893 000 $ US | 499 773 000 $ US |
| 2015 | 3 427 808 000 $ US | 1 767 510 000 $ US | 1 606 207 000 $ US | 668 889 000 $ US | 488 105 000 $ US |
| 2014 | 4 068 899 000 $ US | 2 063 859 000 $ US | 1 937 039 000 $ US | 733 037 000 $ US | 505 036 000 $ US |
| 2013 | 3 835 385 000 $ US | 2 029 584 000 $ US | 1 834 301 000 $ US | 715 176 000 $ US | 475 459 000 $ US |
| 2012 | 3 732 714 000 $ US | 2 028 158 000 $ US | 1 779 137 000 $ US | 707 897 000 $ US | 516 457 000 $ US |
| 2011 | 4 527 573 000 $ US | 2 532 658 000 $ US | 2 024 079 000 $ US | 872 003 000 $ US | 701 460 000 $ US |
| 2010 | 3 950 325 000 $ US | 2 253 582 000 $ US | 1 752 958 000 $ US | 673 960 000 $ US | 676 891 000 $ US |
| 2009 | 3 399 663 000 $ US | 2 172 956 000 $ US | 1 697 846 000 $ US | 603 939 000 $ US | 582 345 000 $ US |
| 2008 | 4 643 947 000 $ US | 2 955 551 000 $ US | 2 269 793 000 $ US | 1 031 644 000 $ US | 836 531 000 $ US |
| 2007 | 4 158 464 000 $ US | 2 716 009 000 $ US | 2 022 681 000 $ US | 881 517 000 $ US | 866 416 000 $ US |
| 2006 | 3 490 086 000 $ US | 2 363 488 000 $ US | 1 739 515 000 $ US | 711 016 000 $ US | 782 799 000 $ US |
| 2005 | 3 223 635 000 $ US | 2 190 331 000 $ US | 1 446 885 000 $ US | 582 116 000 $ US | 795 708 000 $ US |
| 2004 | 3 187 581 000 $ US | 2 416 047 000 $ US | 1 458 095 000 $ US | 555 004 000 $ US | 820 161 000 $ US |
| 2003 | 2 650 502 000 $ US | 2 005 227 000 $ US | 1 238 593 000 $ US | 462 649 000 $ US | 592 973 000 $ US |
| 2002 | 2 103 989 000 $ US | 1 687 207 000 $ US | 1 036 611 000 $ US | 376 923 000 $ US | 480 386 000 $ US |
| 2001 | 1 913 347 000 $ US | 1 588 502 000 $ US | 991 117 000 $ US | 356 842 000 $ US | 495 153 000 $ US |
En 2025, les exportations de biens s'élevaient à 4,21 milliards de dollars vers l'Allemagne, 2,58 milliards de dollars vers la France, 2,37 milliards de dollars vers la Belgique, 1,09 milliard de dollars vers les Pays-Bas et 695 millions de dollars vers l'Italie. Le premier rang des cinq destinations du Luxembourg est occupé par l'Allemagne chaque année depuis 2001. Le changement le plus récent dans leur ordre remonte à 2011, quand les exportations du Luxembourg vers les Pays-Bas ont dépassé celles vers l'Italie.
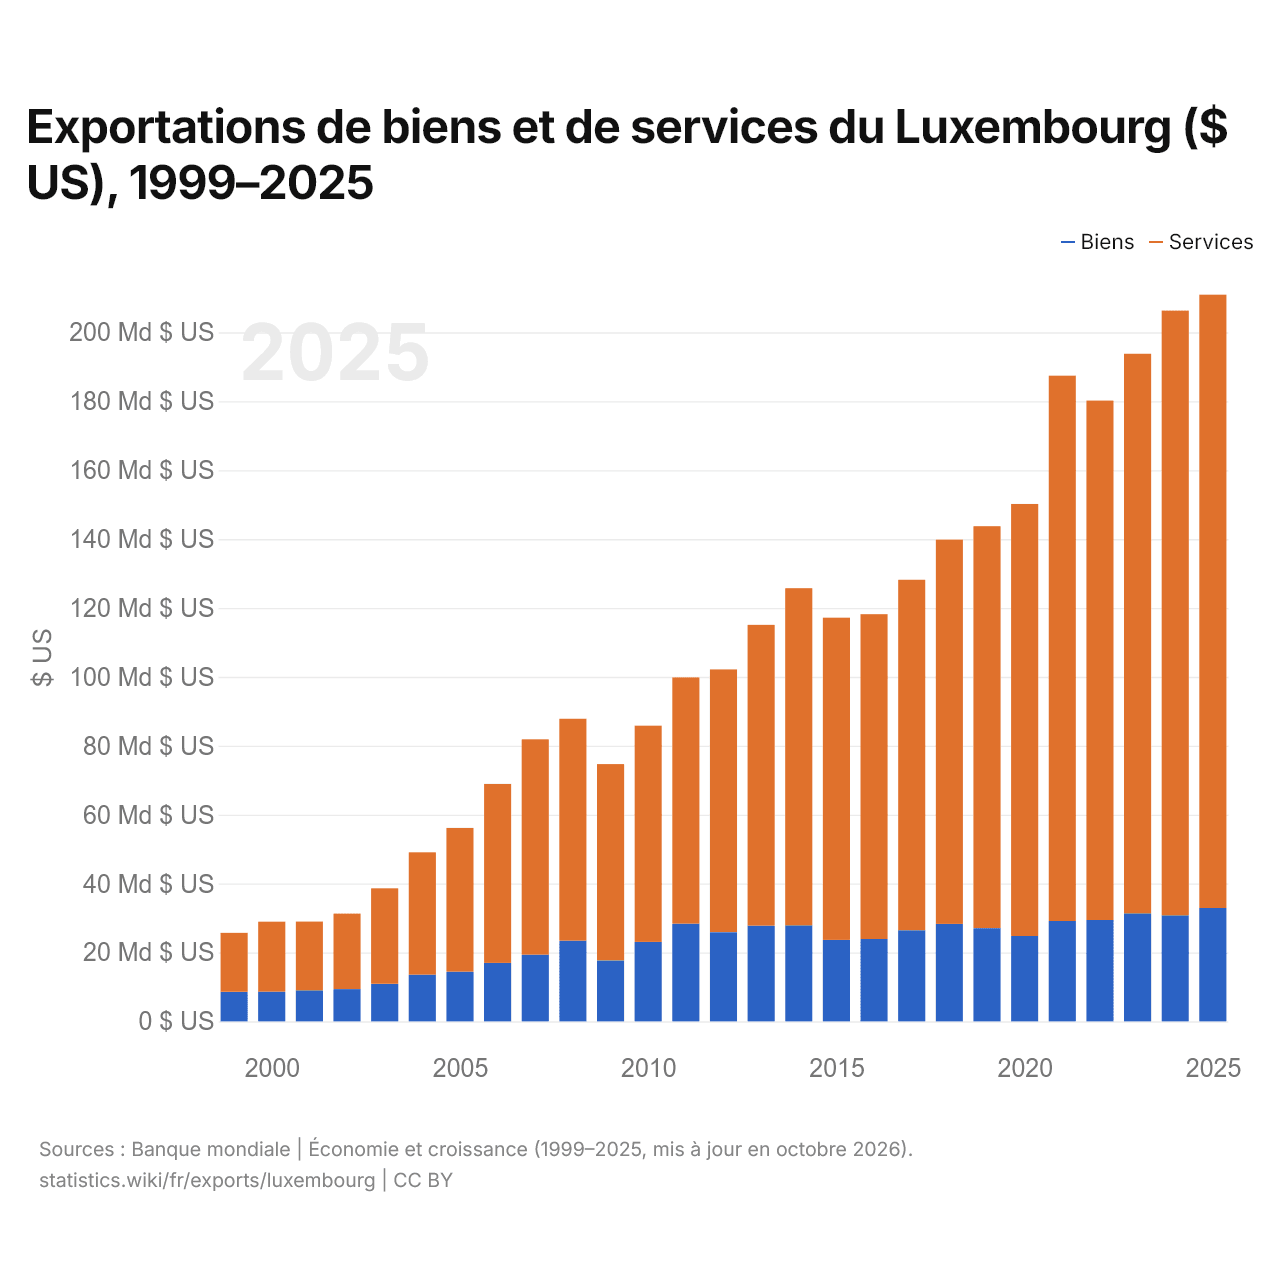
Exportations de biens et de services du Luxembourg ($ US), 1999–2025
| Année | $ US | |
|---|---|---|
| Biens | Services | |
| 2025 | 32 907 778 941 $ US | 178 032 679 822 $ US |
| 2024 | 30 800 364 699 $ US | 175 507 824 452 $ US |
| 2023 | 31 370 654 091 $ US | 162 408 313 280 $ US |
| 2022 | 29 425 591 884 $ US | 150 758 053 038 $ US |
| 2021 | 29 135 827 882 $ US | 158 298 965 745 $ US |
| 2020 | 24 782 505 298 $ US | 125 401 203 180 $ US |
| 2019 | 27 046 627 995 $ US | 116 689 688 303 $ US |
| 2018 | 28 274 587 708 $ US | 111 535 289 997 $ US |
| 2017 | 26 450 955 711 $ US | 101 723 867 185 $ US |
| 2016 | 23 886 733 964 $ US | 94 292 910 984 $ US |
| 2015 | 23 652 529 860 $ US | 93 528 349 377 $ US |
| 2014 | 27 887 846 314 $ US | 97 831 307 118 $ US |
| 2013 | 27 781 611 445 $ US | 87 301 763 152 $ US |
| 2012 | 25 876 276 457 $ US | 76 277 701 435 $ US |
| 2011 | 28 368 801 451 $ US | 71 464 214 380 $ US |
| 2010 | 23 067 541 795 $ US | 62 755 785 954 $ US |
| 2009 | 17 671 917 238 $ US | 56 996 337 794 $ US |
| 2008 | 23 436 394 923 $ US | 64 399 929 126 $ US |
| 2007 | 19 364 644 086 $ US | 62 492 677 233 $ US |
| 2006 | 16 972 081 450 $ US | 51 946 223 203 $ US |
| 2005 | 14 402 858 330 $ US | 41 741 378 560 $ US |
| 2004 | 13 564 430 308 $ US | 35 501 356 897 $ US |
| 2003 | 10 900 512 579 $ US | 27 700 653 735 $ US |
| 2002 | 9 356 833 846 $ US | 21 909 567 925 $ US |
| 2001 | 8 998 272 777 $ US | 19 951 121 277 $ US |
| 2000 | 8 635 025 561 $ US | 20 300 782 214 $ US |
| 1999 | 8 564 403 833 $ US | 17 132 585 205 $ US |
En 2025, les exportations de biens du Luxembourg s'élevaient à 32,9 milliards de dollars et celles de services à 178 milliards de dollars ; les services représentaient 84,4 % du total, contre 66,7 % en 1999.
Le Luxembourg dans le classement mondial des exportations, 2025
| Rang | Pays | Exportations | Part mondiale | |
|---|---|---|---|---|
| 32 |
Autriche
|
317 Md $US | 0,91 % | |
| 33 |
 Tchéquie |
262 Md $US | 0,75 % | |
| 34 |
 Norvège |
241 Md $US | 0,69 % | |
| 35 |
 Luxembourg |
193 Md $US | 0,55 % | |
| 36 |
 Hongrie |
179 Md $US | 0,51 % | vs Hongrie |
| 37 |
 Israël |
168 Md $US | 0,48 % | vs Israël |
| 38 |
 Roumanie |
152 Md $US | 0,44 % | vs Roumanie |
Exportations de biens et services du Luxembourg, % du PIB, 1970–2025
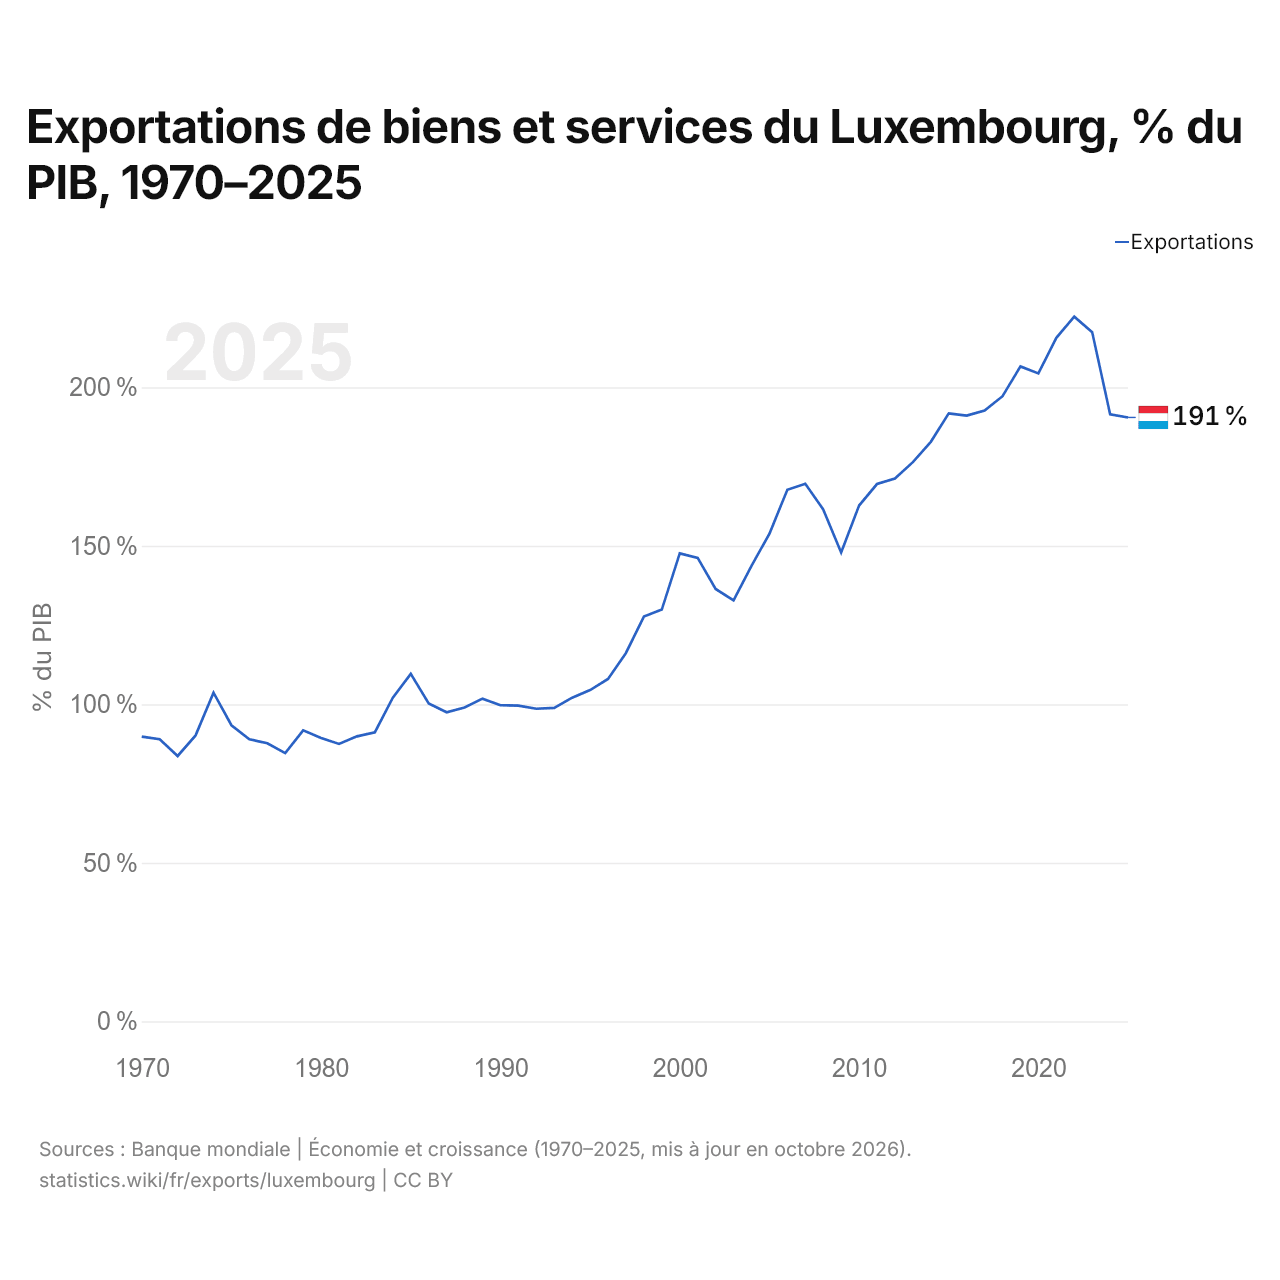
En 2025, les exportations de biens et services du Luxembourg équivalaient à 190,5 % de son PIB, contre 89,8 % en 1970. La part la plus élevée a été de 222,3 %, en 2022.
Comparer les exportations du Luxembourg avec celles d'autres pays
Sources :
- TradeMap (2001–2025, mis à jour en octobre 2026)
- Banque mondiale | Économie et croissance (1970–2025, mis à jour en octobre 2026)
Creative Commons Attribution (CC BY) : vous pouvez copier, partager, adapter et réutiliser ce contenu, y compris à des fins commerciales, à condition de citer statistics.wiki et d’indiquer les modifications apportées. Les sources citées ci-dessus peuvent avoir leurs propres conditions de licence.