
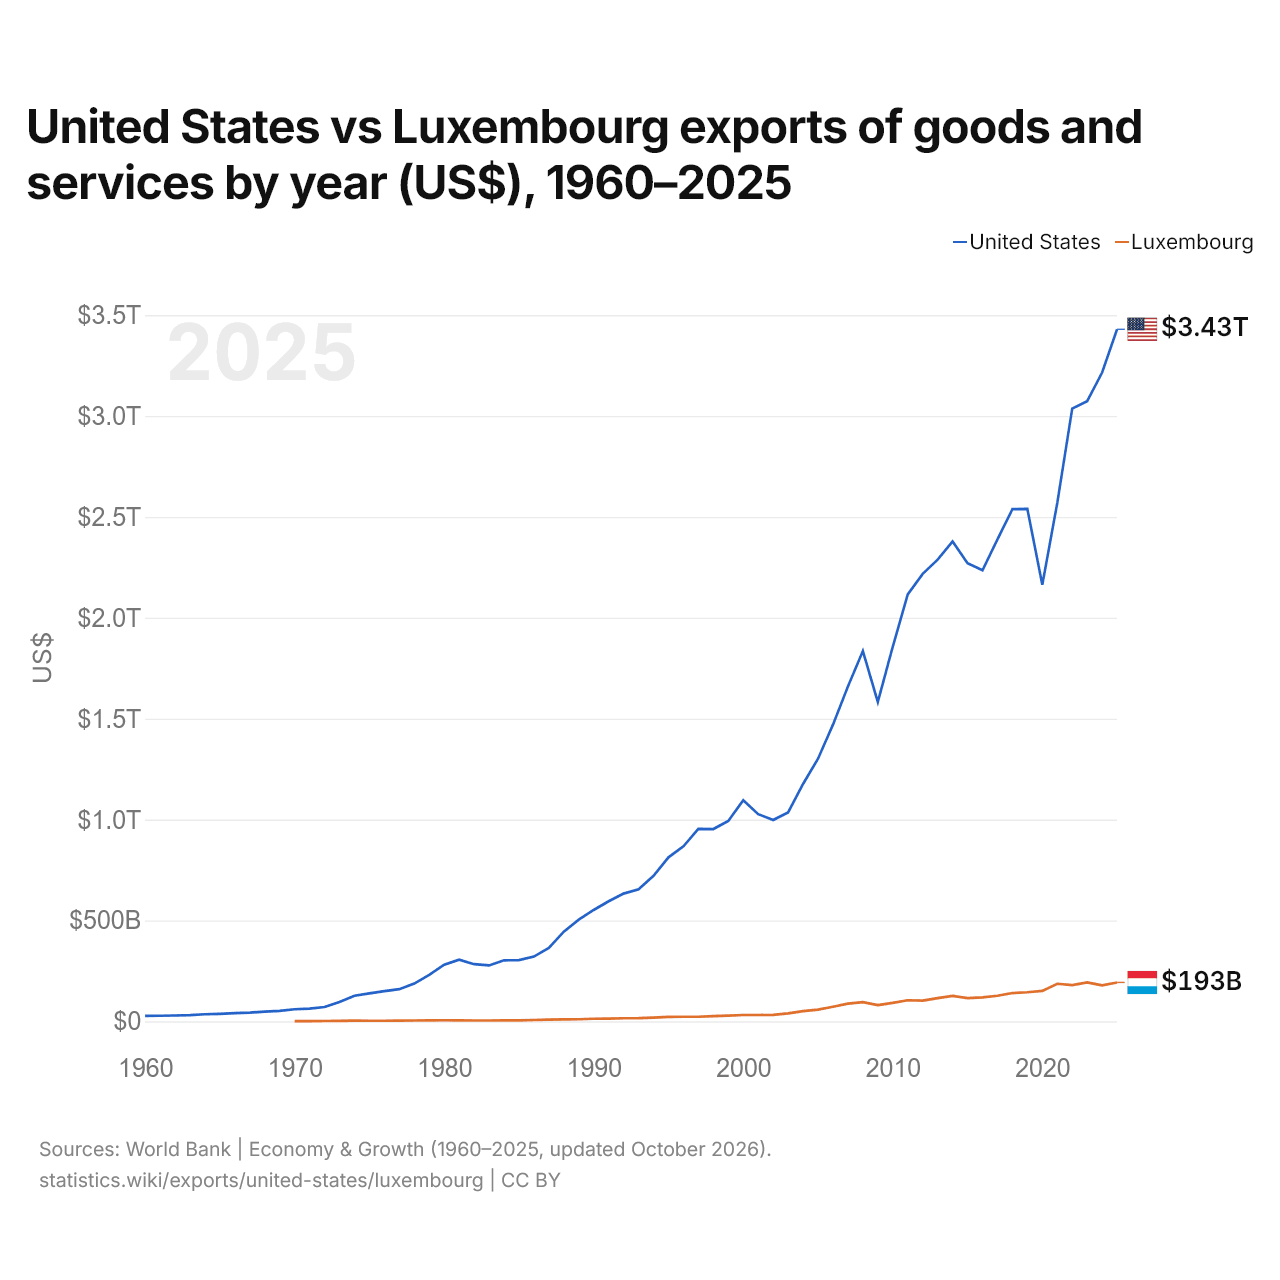
États-Unis vs Luxembourg : exportations de biens et services par année ($ US), 1960–2025
| Année | $ US | |
|---|---|---|
 États-Unis |
 Luxembourg |
|
| 2025 | 3 429 815 000 000 $ US | 192 728 057 158 $ US |
| 2024 | 3 215 368 000 000 $ US | 178 661 670 861 $ US |
| 2023 | 3 073 360 000 000 $ US | 193 009 113 165 $ US |
| 2022 | 3 036 430 000 000 $ US | 179 628 968 244 $ US |
| 2021 | 2 568 697 000 000 $ US | 186 265 544 320 $ US |
| 2020 | 2 163 837 000 000 $ US | 150 610 309 021 $ US |
| 2019 | 2 539 391 000 000 $ US | 144 341 752 039 $ US |
| 2018 | 2 538 089 000 000 $ US | 140 193 787 083 $ US |
| 2017 | 2 388 260 000 000 $ US | 126 658 587 133 $ US |
| 2016 | 2 235 558 000 000 $ US | 118 895 618 024 $ US |
| 2015 | 2 270 622 000 000 $ US | 115 238 581 123 $ US |
| 2014 | 2 378 545 000 000 $ US | 125 763 218 896 $ US |
| 2013 | 2 287 922 000 000 $ US | 115 007 710 906 $ US |
| 2012 | 2 217 700 000 000 $ US | 102 344 215 079 $ US |
| 2011 | 2 115 864 000 000 $ US | 104 568 486 413 $ US |
| 2010 | 1 857 247 000 000 $ US | 91 465 696 293 $ US |
| 2009 | 1 582 774 000 000 $ US | 80 570 783 796 $ US |
| 2008 | 1 835 280 000 000 $ US | 95 030 426 101 $ US |
| 2007 | 1 659 295 000 000 $ US | 87 480 215 781 $ US |
| 2006 | 1 470 170 000 000 $ US | 71 977 613 140 $ US |
| 2005 | 1 301 580 000 000 $ US | 57 949 162 558 $ US |
| 2004 | 1 176 363 000 000 $ US | 50 400 230 064 $ US |
| 2003 | 1 035 165 000 000 $ US | 39 412 388 094 $ US |
| 2002 | 997 979 000 000 $ US | 32 249 319 538 $ US |
| 2001 | 1 026 812 000 000 $ US | 31 268 767 983 $ US |
| 2000 | 1 096 111 000 000 $ US | 31 345 279 140 $ US |
| 1999 | 992 910 000 000 $ US | 28 455 196 289 $ US |
| 1998 | 952 979 000 000 $ US | 25 731 039 120 $ US |
| 1997 | 953 803 000 000 $ US | 22 737 276 725 $ US |
| 1996 | 867 589 000 000 $ US | 22 562 990 228 $ US |
| 1995 | 812 810 000 000 $ US | 21 787 067 597 $ US |
| 1994 | 720 937 000 000 $ US | 18 080 553 412 $ US |
| 1993 | 654 799 000 000 $ US | 15 744 739 972 $ US |
| 1992 | 633 053 000 000 $ US | 15 301 225 847 $ US |
| 1991 | 594 931 000 000 $ US | 13 779 657 413 $ US |
| 1990 | 551 873 000 000 $ US | 12 742 102 849 $ US |
| 1989 | 504 289 000 000 $ US | 10 219 753 276 $ US |
| 1988 | 444 601 000 000 $ US | 9 327 494 240 $ US |
| 1987 | 363 943 000 000 $ US | 8 110 552 134 $ US |
| 1986 | 320 998 000 000 $ US | 6 703 202 998 $ US |
| 1985 | 303 211 000 000 $ US | 5 014 838 644 $ US |
| 1984 | 302 380 000 000 $ US | 4 532 564 926 $ US |
| 1983 | 276 996 000 000 $ US | 4 124 129 389 $ US |
| 1982 | 283 210 000 000 $ US | 4 137 952 499 $ US |
| 1981 | 305 239 000 000 $ US | 4 423 440 895 $ US |
| 1980 | 280 772 000 000 $ US | 5 383 032 142 $ US |
| 1979 | 230 129 000 000 $ US | 5 067 336 269 $ US |
| 1978 | 186 883 000 000 $ US | 3 993 266 299 $ US |
| 1977 | 159 349 000 000 $ US | 3 324 898 143 $ US |
| 1976 | 149 515 000 000 $ US | 3 047 749 216 $ US |
| 1975 | 138 706 000 000 $ US | 2 917 697 708 $ US |
| 1974 | 126 650 000 000 $ US | 3 300 803 645 $ US |
| 1973 | 95 269 000 000 $ US | 2 355 188 367 $ US |
| 1972 | 70 843 000 000 $ US | 1 592 229 860 $ US |
| 1971 | 62 963 000 000 $ US | 1 352 359 884 $ US |
| 1970 | 59 709 000 000 $ US | 1 308 913 271 $ US |
| 1969 | 51 869 339 287 $ US | - |
| 1968 | 47 834 057 455 $ US | - |
| 1967 | 43 410 585 757 $ US | - |
| 1966 | 40 867 257 476 $ US | - |
| 1965 | 37 066 116 833 $ US | - |
| 1964 | 34 943 052 213 $ US | - |
| 1963 | 31 009 633 840 $ US | - |
| 1962 | 29 013 598 685 $ US | - |
| 1961 | 27 567 636 480 $ US | - |
| 1960 | 27 024 960 774 $ US | - |
En 2025, les exportations de biens et services des États-Unis s'élevaient à 3,43 billions de dollars et celles du Luxembourg à 193 milliards de dollars : celles des États-Unis étaient 18 fois plus élevées. En 1970, les exportations des États-Unis étaient 46 fois plus élevées : 59,7 milliards de dollars pour les États-Unis et 1,31 milliard de dollars pour le Luxembourg.
Les exportations de biens et services des États-Unis sont supérieures à celles du Luxembourg chaque année depuis 1970.
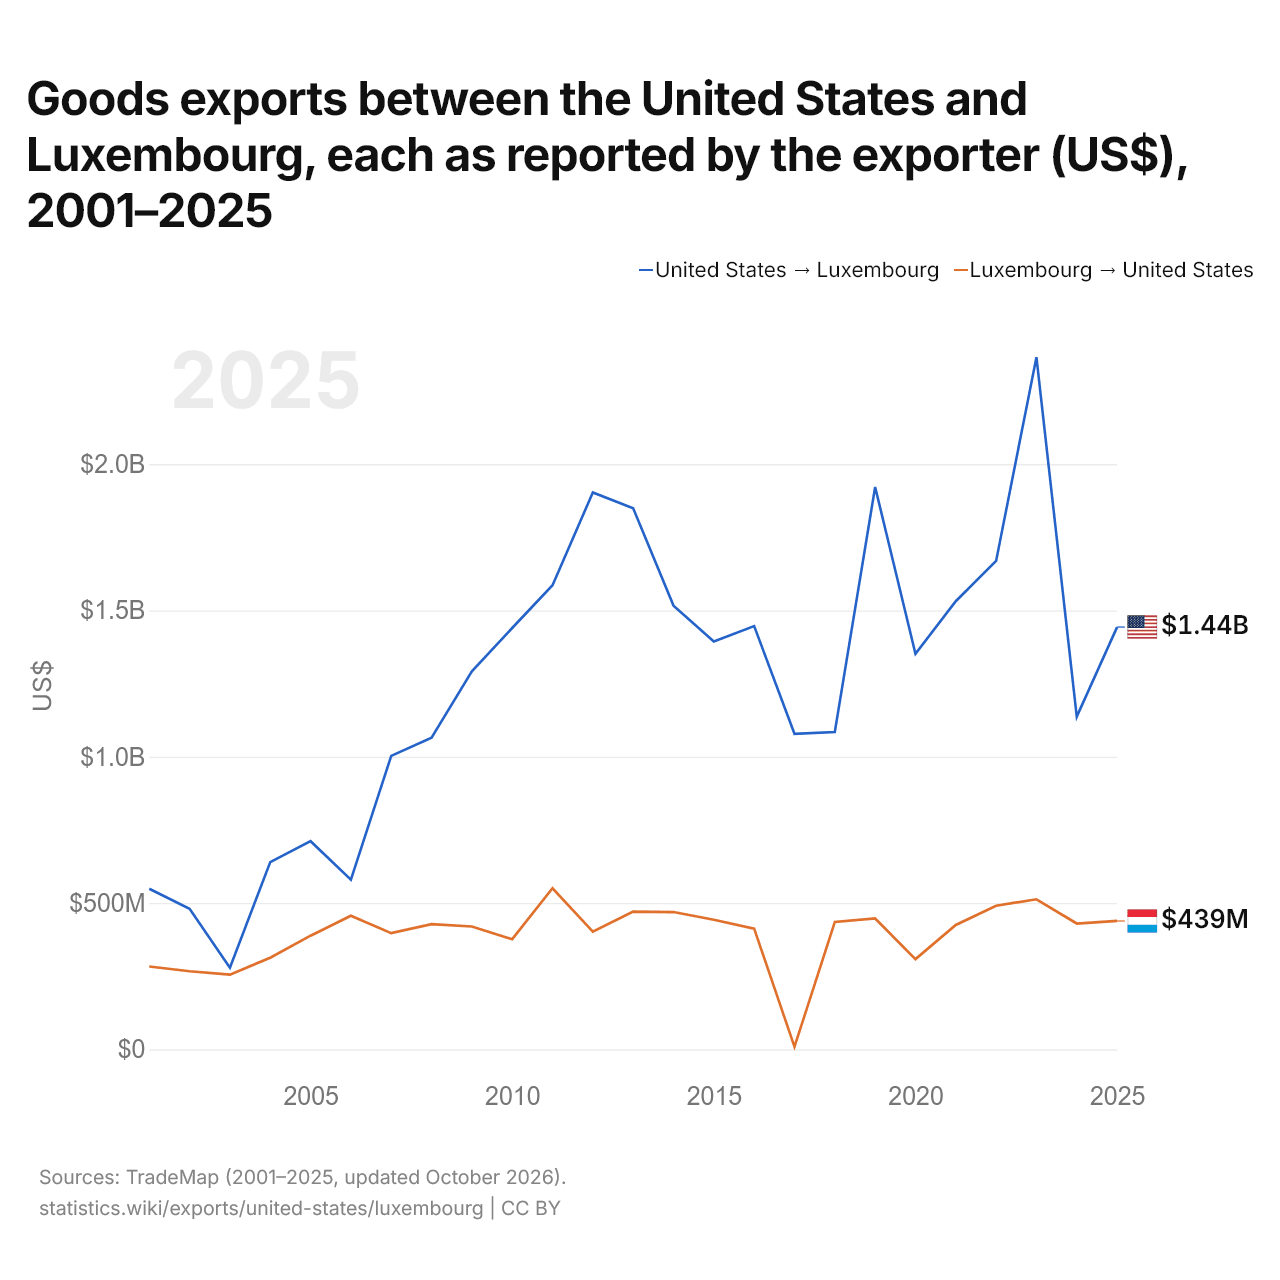
Exportations de biens entre les États-Unis et le Luxembourg, selon chaque exportateur ($ US), 2001–2025
| Année | $ US | |
|---|---|---|
| États-Unis → Luxembourg | Luxembourg → États-Unis | |
| 2025 | 1 443 011 000 $ US | 438 706 000 $ US |
| 2024 | 1 136 895 000 $ US | 429 914 000 $ US |
| 2023 | 2 365 373 000 $ US | 512 731 000 $ US |
| 2022 | 1 669 090 000 $ US | 490 912 000 $ US |
| 2021 | 1 531 482 000 $ US | 425 027 000 $ US |
| 2020 | 1 351 922 000 $ US | 308 313 000 $ US |
| 2019 | 1 921 647 000 $ US | 447 294 000 $ US |
| 2018 | 1 084 259 000 $ US | 435 112 000 $ US |
| 2017 | 1 078 266 000 $ US | 8 726 000 $ US |
| 2016 | 1 446 279 000 $ US | 412 475 000 $ US |
| 2015 | 1 393 819 000 $ US | 442 992 000 $ US |
| 2014 | 1 516 207 000 $ US | 469 107 000 $ US |
| 2013 | 1 848 773 000 $ US | 470 547 000 $ US |
| 2012 | 1 903 125 000 $ US | 401 827 000 $ US |
| 2011 | 1 585 845 000 $ US | 550 483 000 $ US |
| 2010 | 1 439 674 000 $ US | 376 296 000 $ US |
| 2009 | 1 292 117 000 $ US | 419 887 000 $ US |
| 2008 | 1 065 030 000 $ US | 427 817 000 $ US |
| 2007 | 1 002 743 000 $ US | 397 069 000 $ US |
| 2006 | 579 848 000 $ US | 456 715 000 $ US |
| 2005 | 711 383 000 $ US | 388 404 000 $ US |
| 2004 | 639 852 000 $ US | 313 065 000 $ US |
| 2003 | 279 108 000 $ US | 255 293 000 $ US |
| 2002 | 480 142 000 $ US | 266 899 000 $ US |
| 2001 | 548 567 000 $ US | 283 210 000 $ US |
En 2025, les exportations de biens des États-Unis vers le Luxembourg, selon les États-Unis, s'élevaient à 1,44 milliard de dollars, et celles du Luxembourg vers les États-Unis, selon le Luxembourg, à 439 millions de dollars : 3,3 fois plus pour celles des États-Unis. En 2001, elles s'élevaient à 549 millions de dollars pour les États-Unis et à 283 millions de dollars pour le Luxembourg.
États-Unis vs Luxembourg : chiffres des exportations
|
États-Unis
|
Luxembourg
|
|
|---|---|---|
| Exportations | 3,43 Bn $US (2025) | 193 Md $US (2025) |
| Rang mondial | 2/176 | 35/176 |
| Part mondiale | 9,83 % | 0,55 % |
| % du PIB | 11,1 % | 190,5 % |
| Première catégorie de biens | Machines, électronique et véhicules (42,1 %, 2025) | Machines, électronique et véhicules (29 %, 2025) |
| Première destination des biens | Mexique (15,5 %, 2025) | Allemagne (25,3 %, 2025) |
Comparer les exportations de 2 pays au choix
Sources :
- Banque mondiale | Économie et croissance (1960–2025, mis à jour en octobre 2026)
- TradeMap (2001–2025, mis à jour en octobre 2026)
Creative Commons Attribution (CC BY) : vous pouvez copier, partager, adapter et réutiliser ce contenu, y compris à des fins commerciales, à condition de citer statistics.wiki et d’indiquer les modifications apportées. Les sources citées ci-dessus peuvent avoir leurs propres conditions de licence.