
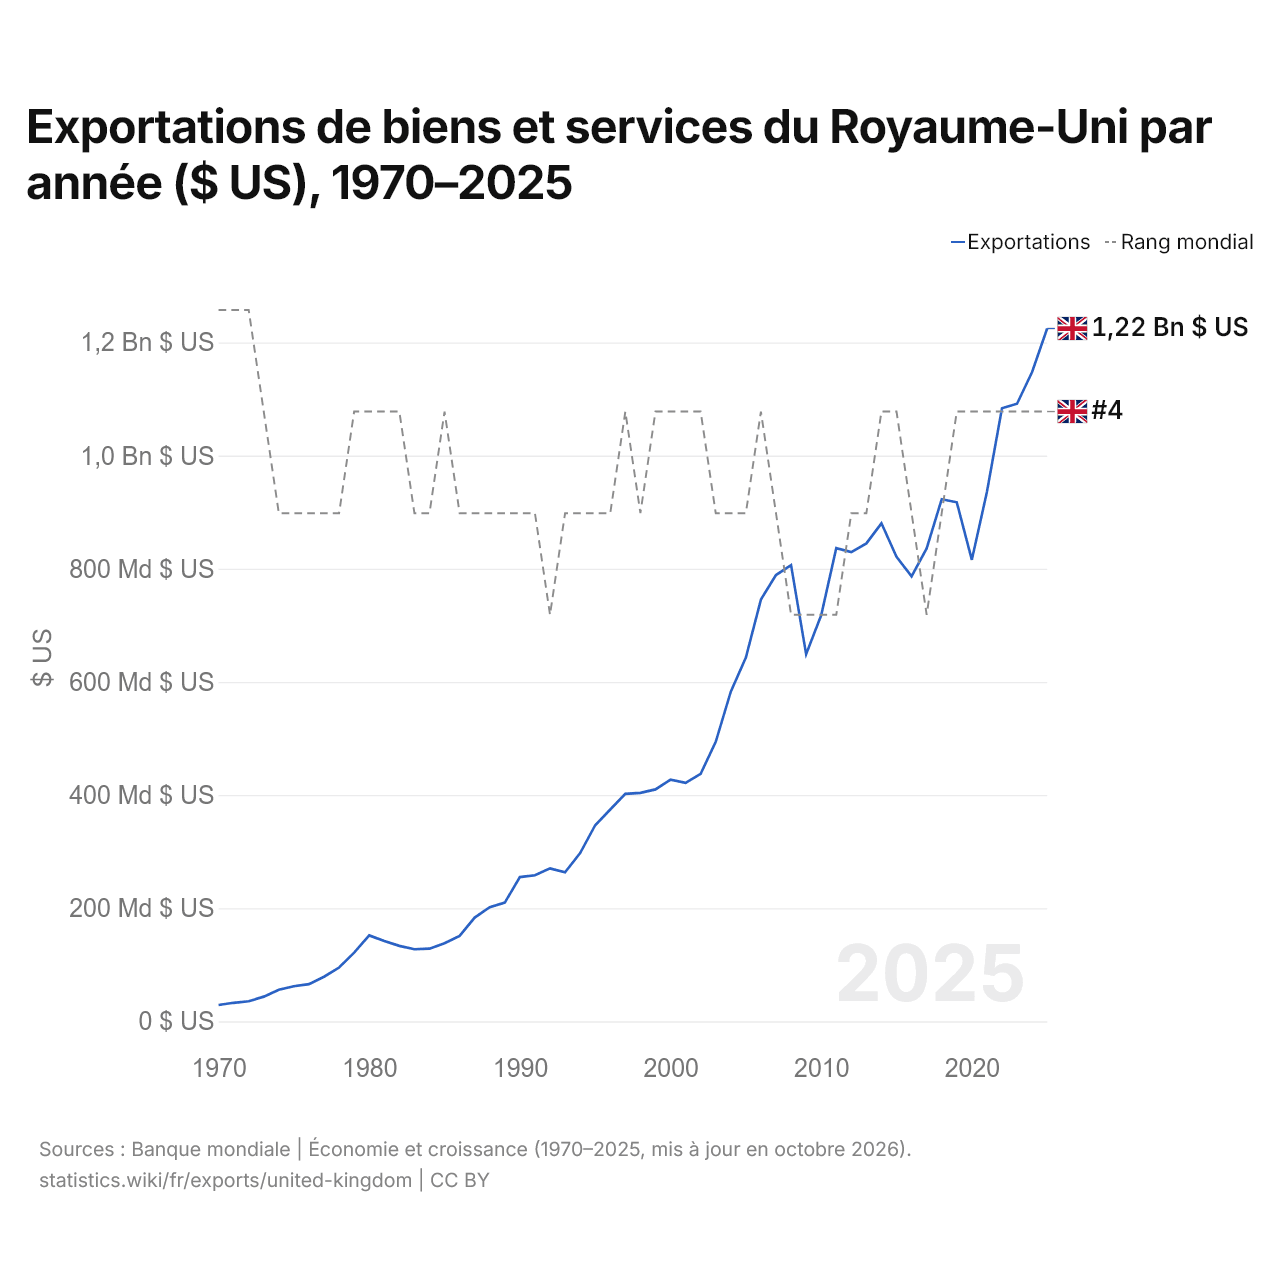
Exportations de biens et services du Royaume-Uni par année ($ US), 1970–2025
| Année | $ US | Rang mondial |
|---|---|---|
| Exportations | Rang mondial | |
| 2025 | 1 224 670 037 745 $ US | #4 |
| 2024 | 1 147 692 057 155 $ US | #4 |
| 2023 | 1 091 653 856 201 $ US | #4 |
| 2022 | 1 083 593 172 366 $ US | #4 |
| 2021 | 935 667 446 175 $ US | #4 |
| 2020 | 815 801 724 784 $ US | #4 |
| 2019 | 917 433 768 894 $ US | #4 |
| 2018 | 922 834 772 428 $ US | #5 |
| 2017 | 836 020 370 556 $ US | #6 |
| 2016 | 786 640 412 454 $ US | #5 |
| 2015 | 821 200 386 072 $ US | #4 |
| 2014 | 880 315 812 063 $ US | #4 |
| 2013 | 844 879 329 622 $ US | #5 |
| 2012 | 829 500 825 757 $ US | #5 |
| 2011 | 836 521 134 498 $ US | #6 |
| 2010 | 717 722 225 202 $ US | #6 |
| 2009 | 648 817 572 831 $ US | #6 |
| 2008 | 806 393 382 353 $ US | #6 |
| 2007 | 788 841 536 615 $ US | #5 |
| 2006 | 745 508 739 650 $ US | #4 |
| 2005 | 643 121 818 182 $ US | #5 |
| 2004 | 582 770 047 602 $ US | #5 |
| 2003 | 494 048 979 592 $ US | #5 |
| 2002 | 437 455 035 971 $ US | #4 |
| 2001 | 421 484 093 853 $ US | #4 |
| 2000 | 427 199 273 718 $ US | #4 |
| 1999 | 409 995 146 416 $ US | #4 |
| 1998 | 403 935 077 840 $ US | #5 |
| 1997 | 402 043 222 004 $ US | #4 |
| 1996 | 374 382 215 289 $ US | #5 |
| 1995 | 346 673 504 813 $ US | #5 |
| 1994 | 297 415 469 850 $ US | #5 |
| 1993 | 263 563 318 836 $ US | #5 |
| 1992 | 270 419 575 290 $ US | #6 |
| 1991 | 258 221 350 970 $ US | #5 |
| 1990 | 255 032 436 080 $ US | #5 |
| 1989 | 209 856 063 482 $ US | #5 |
| 1988 | 201 778 537 887 $ US | #5 |
| 1987 | 183 446 283 706 $ US | #5 |
| 1986 | 150 993 144 239 $ US | #5 |
| 1985 | 137 913 634 497 $ US | #4 |
| 1984 | 128 434 115 456 $ US | #5 |
| 1983 | 127 464 198 878 $ US | #5 |
| 1982 | 133 411 221 174 $ US | #4 |
| 1981 | 141 969 931 672 $ US | #4 |
| 1980 | 151 948 940 274 $ US | #4 |
| 1979 | 121 453 807 709 $ US | #4 |
| 1978 | 95 076 914 669 $ US | #5 |
| 1977 | 78 871 843 712 $ US | #5 |
| 1976 | 65 841 913 747 $ US | #5 |
| 1975 | 62 053 345 133 $ US | #5 |
| 1974 | 55 864 677 419 $ US | #5 |
| 1973 | 43 672 359 138 $ US | #4 |
| 1972 | 35 438 523 976 $ US | #3 |
| 1971 | 32 761 433 439 $ US | #3 |
| 1970 | 28 794 190 065 $ US | #3 |
En 2025, les exportations de biens et services du Royaume-Uni s'élevaient à 1,22 billion de dollars, contre 28,8 milliards de dollars en 1970. Elles se classaient au 4e rang mondial, un rang qu'elles occupent depuis 2019. Leur meilleur rang a été le 3e, occupé pour la dernière fois en 1972.
En 2025, les exportations de biens et services du Royaume-Uni étaient les 2es plus élevées de 41 pays situés en Europe, après celles de l'Allemagne. Les importations de biens et services du Royaume-Uni s'élevaient à 1,28 billion de dollars en 2025, au 4e rang mondial. En 2025, les importations du Royaume-Uni dépassaient ses exportations de 50,6 milliards de dollars, soit un déficit commercial.
Exportations de biens du Royaume-Uni par catégorie, 2025
Exportations de biens, 2025: 557 Md $US
En 2025, la première catégorie des exportations de biens du Royaume-Uni était « machines, électronique et véhicules », avec 39,9 %, suivie de « métaux précieux, pierres précieuses, bijoux, montres, instruments de musique et art », avec 20,3 %.
Destinations des exportations de biens du Royaume-Uni : les 10 premières, 2025
| Rang | Pays | Exportations de biens | Part | |
|---|---|---|---|---|
| 1 |
 États-Unis |
87,9 Md $US | 15,8 % | vs USA |
| 2 |
 Allemagne |
43,1 Md $US | 7,74 % | vs Allemagne |
| 3 |
 Chine |
36,6 Md $US | 6,57 % | vs Chine |
| 4 |
 Pays-Bas |
33,1 Md $US | 5,95 % | vs Pays-Bas |
| 5 |
 Suisse |
31,4 Md $US | 5,63 % | vs Suisse |
| 6 |
 Irlande |
30,6 Md $US | 5,5 % | vs Irlande |
| 7 |
 France |
30,0 Md $US | 5,39 % | vs France |
| 8 |
 Belgique |
20,3 Md $US | 3,64 % | vs Belgique |
| 9 |
 Espagne |
13,8 Md $US | 2,48 % | vs Espagne |
| 10 |
 Italie |
11,3 Md $US | 2,02 % | vs Italie |
| Autres partenaires et non précisés | 219 Md $US | 39,3 % |
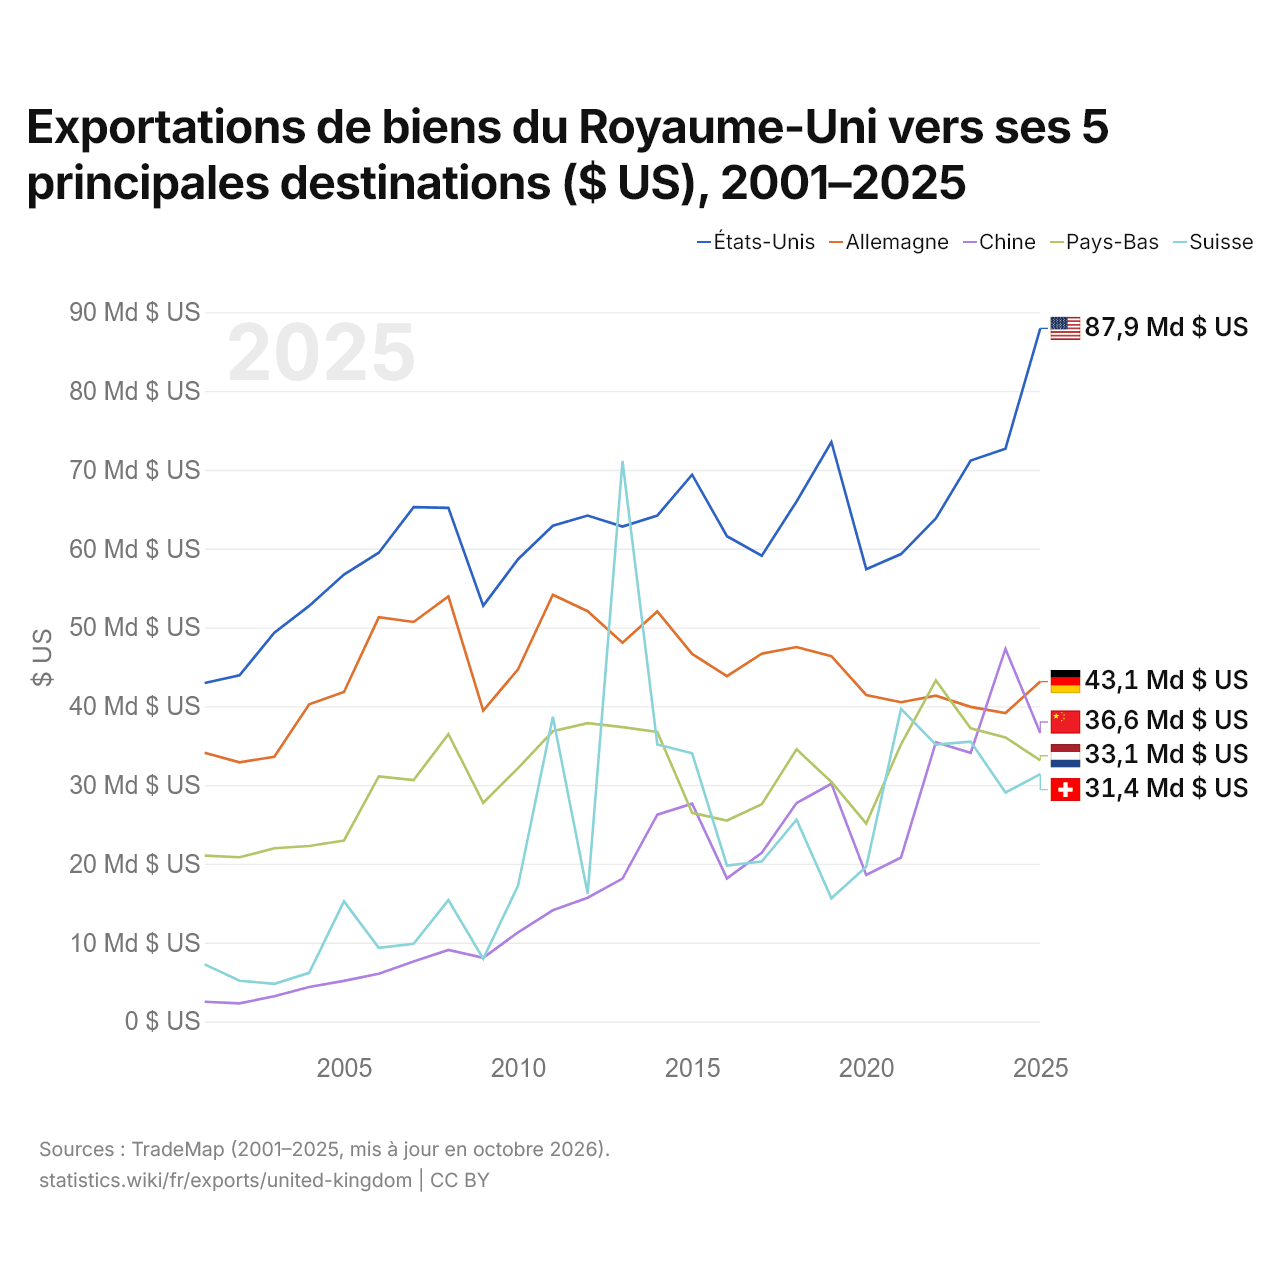
Exportations de biens du Royaume-Uni vers ses 5 principales destinations ($ US), 2001–2025
| Année | $ US | ||||
|---|---|---|---|---|---|
| États-Unis | Allemagne | Chine | Pays-Bas | Suisse | |
| 2025 | 87 943 744 000 $ US | 43 119 914 000 $ US | 36 606 487 000 $ US | 33 126 614 000 $ US | 31 374 272 000 $ US |
| 2024 | 72 674 785 000 $ US | 39 129 127 000 $ US | 47 264 634 000 $ US | 36 034 052 000 $ US | 29 037 099 000 $ US |
| 2023 | 71 175 488 000 $ US | 39 913 550 000 $ US | 34 086 439 000 $ US | 37 182 828 000 $ US | 35 503 755 000 $ US |
| 2022 | 63 818 198 000 $ US | 41 328 252 000 $ US | 35 414 586 000 $ US | 43 262 220 000 $ US | 35 117 482 000 $ US |
| 2021 | 59 301 922 000 $ US | 40 504 608 000 $ US | 20 796 979 000 $ US | 35 158 654 000 $ US | 39 662 290 000 $ US |
| 2020 | 57 379 185 000 $ US | 41 417 961 000 $ US | 18 579 294 000 $ US | 25 108 882 000 $ US | 19 605 704 000 $ US |
| 2019 | 73 528 705 000 $ US | 46 352 026 000 $ US | 30 154 261 000 $ US | 30 377 934 000 $ US | 15 618 473 000 $ US |
| 2018 | 65 985 305 000 $ US | 47 510 720 000 $ US | 27 701 868 000 $ US | 34 527 687 000 $ US | 25 596 878 000 $ US |
| 2017 | 59 098 116 000 $ US | 46 663 005 000 $ US | 21 382 916 000 $ US | 27 556 388 000 $ US | 20 287 405 000 $ US |
| 2016 | 61 568 659 000 $ US | 43 797 384 000 $ US | 18 142 280 000 $ US | 25 484 748 000 $ US | 19 774 333 000 $ US |
| 2015 | 69 381 207 000 $ US | 46 631 518 000 $ US | 27 625 409 000 $ US | 26 457 524 000 $ US | 34 021 569 000 $ US |
| 2014 | 64 197 476 000 $ US | 52 026 088 000 $ US | 26 235 500 000 $ US | 36 737 709 000 $ US | 35 132 598 000 $ US |
| 2013 | 62 795 007 000 $ US | 48 040 601 000 $ US | 18 119 205 000 $ US | 37 343 498 000 $ US | 71 112 261 000 $ US |
| 2012 | 64 195 617 000 $ US | 52 046 679 000 $ US | 15 688 191 000 $ US | 37 848 605 000 $ US | 16 207 201 000 $ US |
| 2011 | 62 900 789 000 $ US | 54 137 865 000 $ US | 14 088 514 000 $ US | 36 815 186 000 $ US | 38 653 409 000 $ US |
| 2010 | 58 649 953 000 $ US | 44 671 052 000 $ US | 11 293 784 000 $ US | 32 130 549 000 $ US | 17 217 429 000 $ US |
| 2009 | 52 754 317 000 $ US | 39 446 095 000 $ US | 8 053 613 000 $ US | 27 739 961 000 $ US | 7 938 211 000 $ US |
| 2008 | 65 168 292 000 $ US | 53 919 201 000 $ US | 9 065 641 000 $ US | 36 450 546 000 $ US | 15 386 704 000 $ US |
| 2007 | 65 259 143 000 $ US | 50 684 444 000 $ US | 7 580 755 000 $ US | 30 618 442 000 $ US | 9 837 281 000 $ US |
| 2006 | 59 470 792 000 $ US | 51 279 137 000 $ US | 6 034 544 000 $ US | 31 092 025 000 $ US | 9 315 065 000 $ US |
| 2005 | 56 706 302 000 $ US | 41 794 206 000 $ US | 5 139 824 000 $ US | 22 950 372 000 $ US | 15 230 094 000 $ US |
| 2004 | 52 721 236 000 $ US | 40 234 413 000 $ US | 4 360 575 000 $ US | 22 256 551 000 $ US | 6 151 575 000 $ US |
| 2003 | 49 326 462 000 $ US | 33 577 571 000 $ US | 3 181 390 000 $ US | 21 963 360 000 $ US | 4 763 865 000 $ US |
| 2002 | 43 917 974 000 $ US | 32 876 552 000 $ US | 2 277 914 000 $ US | 20 824 549 000 $ US | 5 155 847 000 $ US |
| 2001 | 42 945 682 000 $ US | 34 086 816 000 $ US | 2 480 855 000 $ US | 21 022 359 000 $ US | 7 231 611 000 $ US |
En 2025, les exportations de biens s'élevaient à 87,9 milliards de dollars vers les États-Unis, 43,1 milliards de dollars vers l'Allemagne, 36,6 milliards de dollars vers la Chine, 33,1 milliards de dollars vers les Pays-Bas et 31,4 milliards de dollars vers la Suisse. Le premier rang des cinq destinations du Royaume-Uni est occupé par les États-Unis depuis 2014. Le changement le plus récent dans leur ordre remonte à 2025, quand les exportations du Royaume-Uni vers l'Allemagne ont dépassé celles vers la Chine.
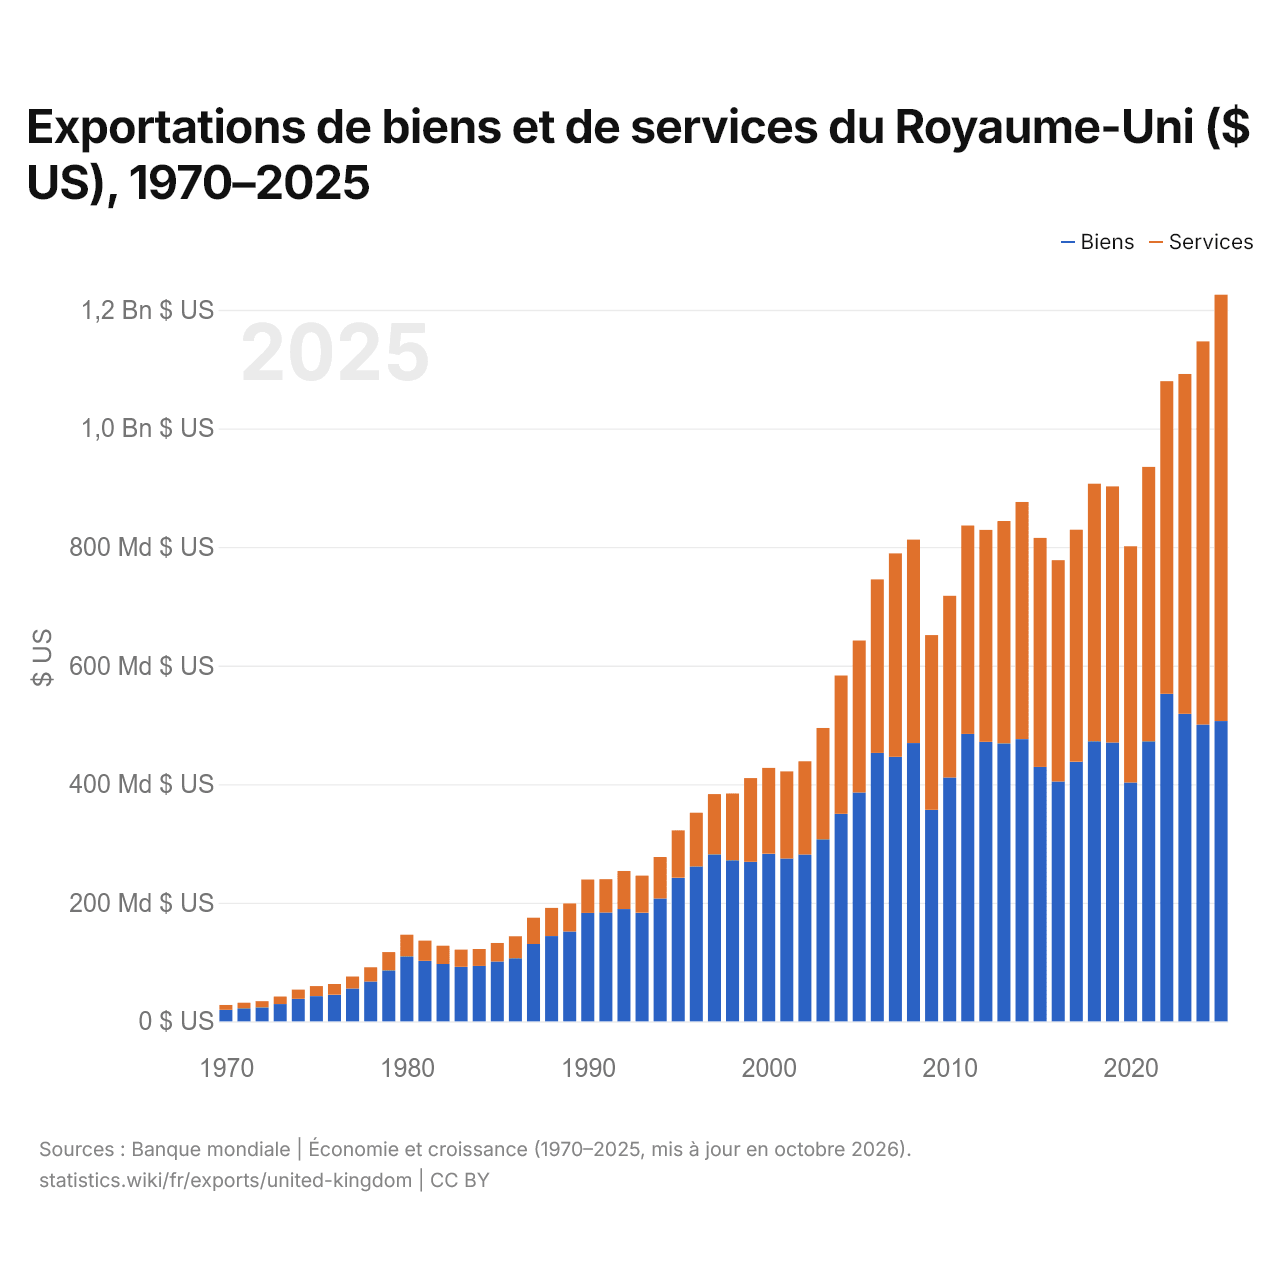
Exportations de biens et de services du Royaume-Uni ($ US), 1970–2025
| Année | $ US | |
|---|---|---|
| Biens | Services | |
| 2025 | 506 367 797 330 $ US | 719 144 937 132 $ US |
| 2024 | 500 487 444 242 $ US | 646 288 553 210 $ US |
| 2023 | 518 605 394 944 $ US | 573 144 579 330 $ US |
| 2022 | 552 488 447 053 $ US | 527 164 095 290 $ US |
| 2021 | 472 272 672 356 $ US | 462 781 135 353 $ US |
| 2020 | 402 879 198 250 $ US | 398 323 585 104 $ US |
| 2019 | 470 246 955 036 $ US | 431 906 088 266 $ US |
| 2018 | 472 455 884 330 $ US | 434 301 279 603 $ US |
| 2017 | 437 921 796 519 $ US | 391 204 357 463 $ US |
| 2016 | 404 569 157 959 $ US | 373 128 305 573 $ US |
| 2015 | 429 134 621 597 $ US | 386 119 931 035 $ US |
| 2014 | 475 943 015 978 $ US | 399 967 602 881 $ US |
| 2013 | 468 762 590 382 $ US | 374 982 336 274 $ US |
| 2012 | 471 389 180 252 $ US | 357 463 178 311 $ US |
| 2011 | 484 745 300 733 $ US | 351 459 088 555 $ US |
| 2010 | 411 131 776 110 $ US | 306 566 342 232 $ US |
| 2009 | 356 841 071 233 $ US | 294 554 605 965 $ US |
| 2008 | 469 286 165 637 $ US | 343 094 638 725 $ US |
| 2007 | 446 229 540 300 $ US | 342 996 476 975 $ US |
| 2006 | 452 713 896 332 $ US | 292 596 682 585 $ US |
| 2005 | 385 924 000 546 $ US | 256 329 504 328 $ US |
| 2004 | 349 993 037 109 $ US | 233 181 890 911 $ US |
| 2003 | 307 084 720 652 $ US | 187 648 949 403 $ US |
| 2002 | 281 214 085 175 $ US | 157 322 376 128 $ US |
| 2001 | 274 565 694 495 $ US | 147 009 399 060 $ US |
| 2000 | 282 733 656 823 $ US | 144 674 271 730 $ US |
| 1999 | 269 169 097 553 $ US | 141 102 971 304 $ US |
| 1998 | 271 723 174 227 $ US | 112 595 598 255 $ US |
| 1997 | 281 536 902 141 $ US | 101 642 106 172 $ US |
| 1996 | 261 247 038 689 $ US | 90 583 641 669 $ US |
| 1995 | 242 317 882 189 $ US | 79 796 038 341 $ US |
| 1994 | 207 187 950 825 $ US | 69 925 271 914 $ US |
| 1993 | 183 312 669 559 $ US | 62 377 056 551 $ US |
| 1992 | 189 366 178 716 $ US | 64 227 090 368 $ US |
| 1991 | 183 505 615 723 $ US | 56 277 459 670 $ US |
| 1990 | 182 804 218 155 $ US | 56 421 927 973 $ US |
| 1989 | 151 440 211 078 $ US | 47 383 388 242 $ US |
| 1988 | 143 725 235 042 $ US | 47 674 196 561 $ US |
| 1987 | 130 467 035 086 $ US | 44 256 903 669 $ US |
| 1986 | 106 429 425 335 $ US | 37 070 801 448 $ US |
| 1985 | 100 861 907 958 $ US | 31 306 057 100 $ US |
| 1984 | 93 486 501 108 $ US | 28 429 354 849 $ US |
| 1983 | 91 962 968 443 $ US | 29 069 860 715 $ US |
| 1982 | 96 659 535 129 $ US | 30 860 640 693 $ US |
| 1981 | 102 157 833 367 $ US | 34 009 692 184 $ US |
| 1980 | 109 620 156 989 $ US | 36 451 798 356 $ US |
| 1979 | 86 017 951 175 $ US | 30 737 103 823 $ US |
| 1978 | 67 121 225 448 $ US | 23 998 663 230 $ US |
| 1977 | 55 318 972 589 $ US | 20 281 632 180 $ US |
| 1976 | 45 033 449 467 $ US | 17 933 767 847 $ US |
| 1975 | 42 474 645 188 $ US | 16 965 420 710 $ US |
| 1974 | 38 105 188 027 $ US | 15 440 624 978 $ US |
| 1973 | 29 105 621 844 $ US | 12 714 091 001 $ US |
| 1972 | 23 509 598 974 $ US | 10 505 766 848 $ US |
| 1971 | 21 994 193 370 $ US | 9 467 940 897 $ US |
| 1970 | 19 507 184 422 $ US | 8 116 793 518 $ US |
En 2025, les exportations de biens du Royaume-Uni s'élevaient à 506 milliards de dollars et celles de services à 719 milliards de dollars ; les services représentaient 58,7 % du total, contre 29,4 % en 1970.
Le Royaume-Uni dans le classement mondial des exportations, 2025
| Rang | Pays | Exportations | Part mondiale | |
|---|---|---|---|---|
| 1 |
Chine
|
4,11 Bn $US | 11,8 % | vs Chine |
| 2 |
États-Unis
|
3,43 Bn $US | 9,83 % | vs USA |
| 3 |
Allemagne
|
2,04 Bn $US | 5,85 % | vs Allemagne |
| 4 |
 Royaume-Uni |
1,22 Bn $US | 3,51 % | |
| 5 |
France
|
1,12 Bn $US | 3,22 % | vs France |
| 6 |
Pays-Bas
|
1,08 Bn $US | 3,08 % | vs Pays-Bas |
| 7 |
 Singapour |
1,07 Bn $US | 3,08 % |
Exportations de biens et services du Royaume-Uni, % du PIB, 1970–2025
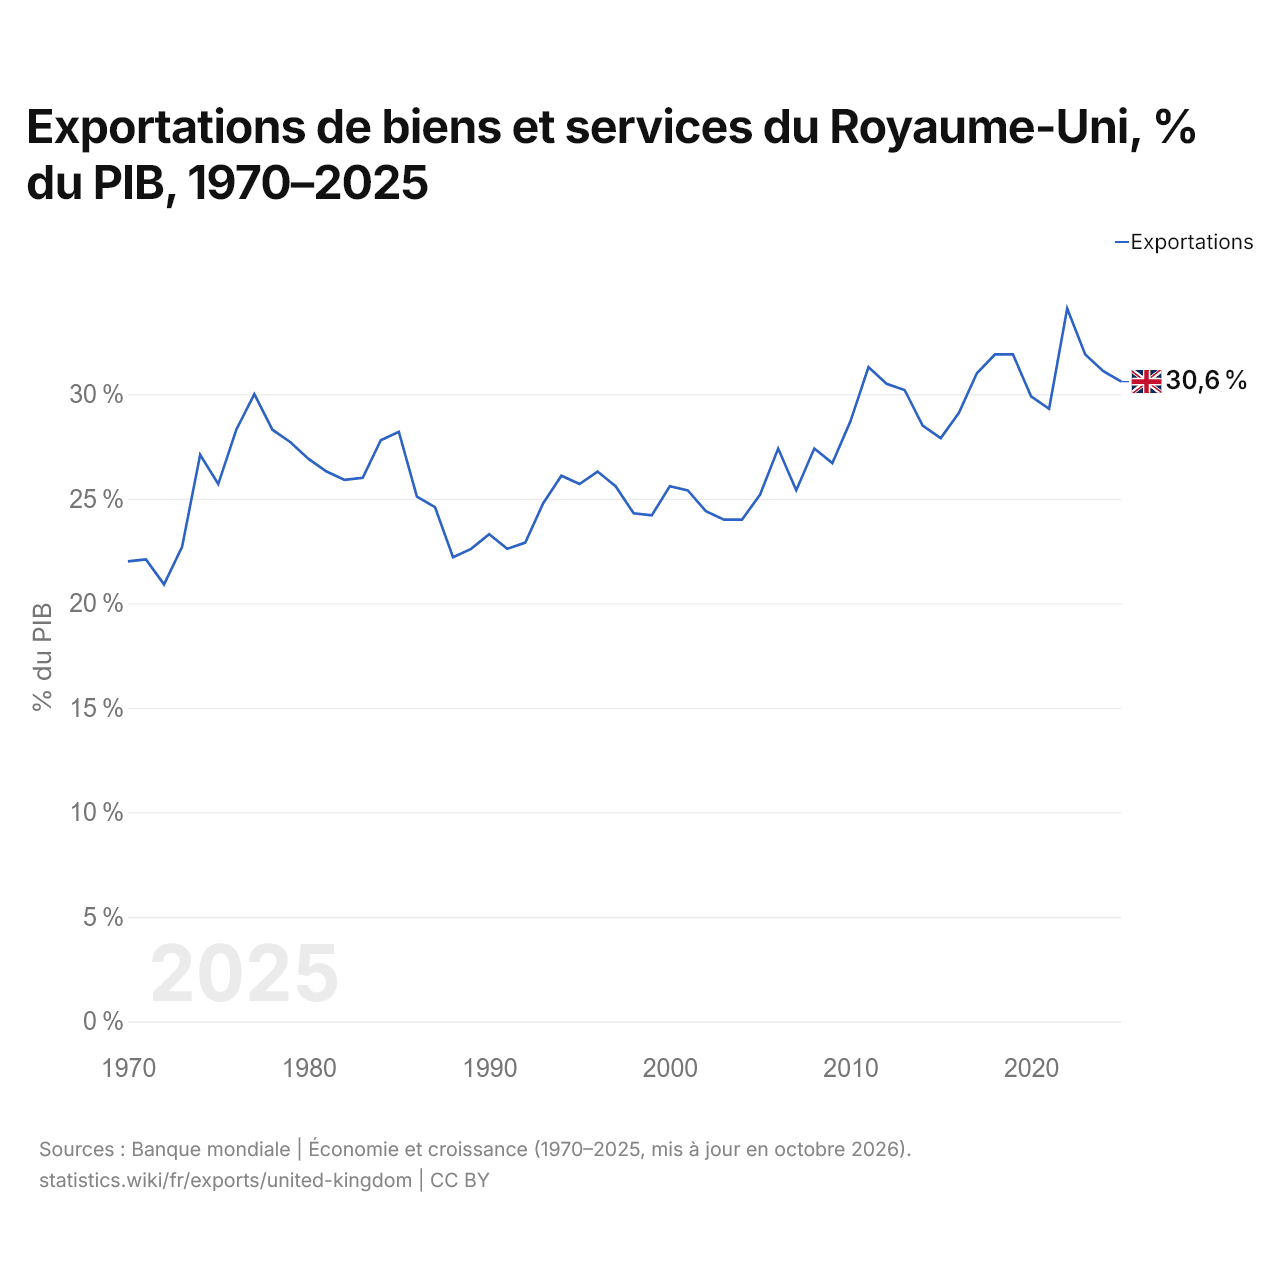
En 2025, les exportations de biens et services du Royaume-Uni équivalaient à 30,6 % de son PIB, contre 22,0 % en 1970. La part la plus élevée a été de 34,1 %, en 2022.
Comparer les exportations du Royaume-Uni avec celles d'autres pays
Sources :
- TradeMap (2001–2025, mis à jour en octobre 2026)
- Banque mondiale | Économie et croissance (1970–2025, mis à jour en octobre 2026)
Creative Commons Attribution (CC BY) : vous pouvez copier, partager, adapter et réutiliser ce contenu, y compris à des fins commerciales, à condition de citer statistics.wiki et d’indiquer les modifications apportées. Les sources citées ci-dessus peuvent avoir leurs propres conditions de licence.