
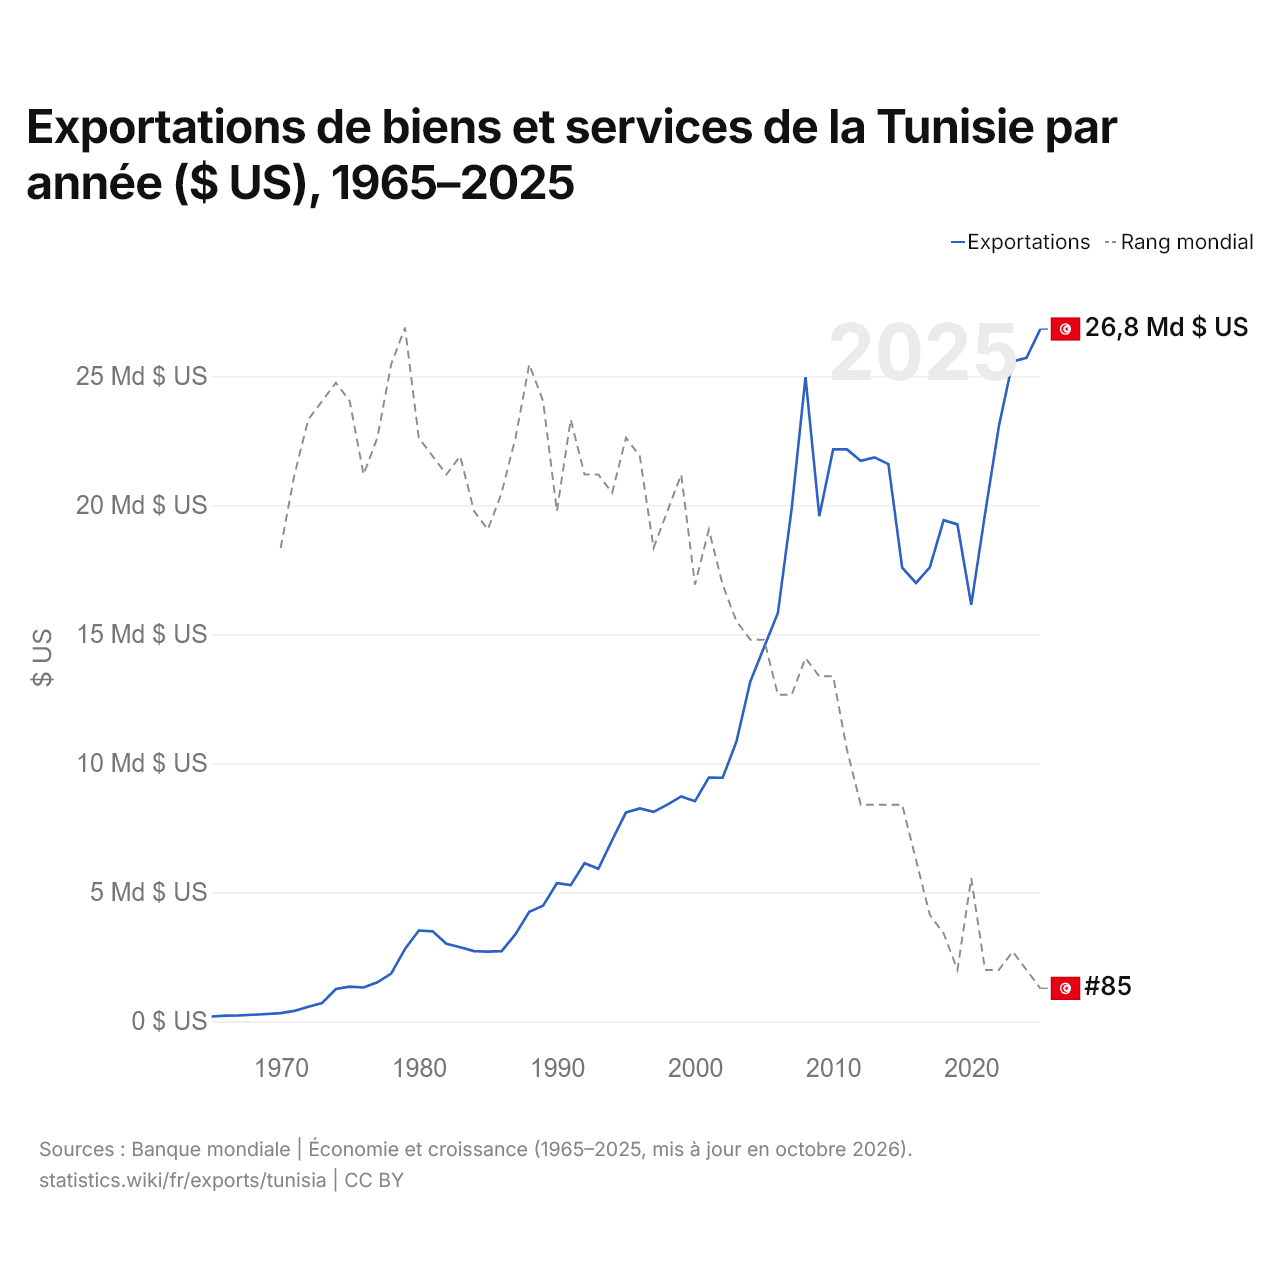
Exportations de biens et services de la Tunisie par année ($ US), 1965–2025
| Année | $ US | Rang mondial |
|---|---|---|
| Exportations | Rang mondial | |
| 2025 | 26 826 069 545 $ US | #85 |
| 2024 | 25 706 930 120 $ US | #84 |
| 2023 | 25 567 813 965 $ US | #83 |
| 2022 | 23 060 703 699 $ US | #84 |
| 2021 | 19 667 292 546 $ US | #84 |
| 2020 | 16 143 392 840 $ US | #79 |
| 2019 | 19 255 781 270 $ US | #84 |
| 2018 | 19 416 275 922 $ US | #82 |
| 2017 | 17 590 956 529 $ US | #81 |
| 2016 | 16 987 820 951 $ US | #78 |
| 2015 | 17 579 251 896 $ US | #75 |
| 2014 | 21 590 469 318 $ US | #75 |
| 2013 | 21 854 753 431 $ US | #75 |
| 2012 | 21 722 011 893 $ US | #75 |
| 2011 | 22 163 031 092 $ US | #72 |
| 2010 | 22 160 316 334 $ US | #68 |
| 2009 | 19 572 383 403 $ US | #68 |
| 2008 | 24 965 547 802 $ US | #67 |
| 2007 | 19 877 270 833 $ US | #69 |
| 2006 | 15 823 068 688 $ US | #69 |
| 2005 | 14 500 633 173 $ US | #66 |
| 2004 | 13 158 999 797 $ US | #66 |
| 2003 | 10 839 779 023 $ US | #65 |
| 2002 | 9 438 270 055 $ US | #63 |
| 2001 | 9 447 888 495 $ US | #60 |
| 2000 | 8 531 440 165 $ US | #63 |
| 1999 | 8 713 608 295 $ US | #57 |
| 1998 | 8 398 428 066 $ US | #59 |
| 1997 | 8 114 689 468 $ US | #61 |
| 1996 | 8 248 031 658 $ US | #56 |
| 1995 | 8 096 647 986 $ US | #55 |
| 1994 | 7 024 340 767 $ US | #58 |
| 1993 | 5 908 390 901 $ US | #57 |
| 1992 | 6 126 637 066 $ US | #57 |
| 1991 | 5 277 717 391 $ US | #54 |
| 1990 | 5 353 409 091 $ US | #59 |
| 1989 | 4 479 728 143 $ US | #53 |
| 1988 | 4 242 227 828 $ US | #51 |
| 1987 | 3 377 010 168 $ US | #55 |
| 1986 | 2 721 814 946 $ US | #58 |
| 1985 | 2 699 953 026 $ US | #60 |
| 1984 | 2 720 919 425 $ US | #59 |
| 1983 | 2 869 615 052 $ US | #56 |
| 1982 | 3 002 097 558 $ US | #57 |
| 1981 | 3 487 011 041 $ US | #56 |
| 1980 | 3 518 399 605 $ US | #55 |
| 1979 | 2 802 229 975 $ US | #49 |
| 1978 | 1 848 038 427 $ US | #51 |
| 1977 | 1 511 421 911 $ US | #55 |
| 1976 | 1 311 177 191 $ US | #57 |
| 1975 | 1 343 883 540 $ US | #53 |
| 1974 | 1 254 043 454 $ US | #52 |
| 1973 | 711 581 704 $ US | #53 |
| 1972 | 567 196 903 $ US | #54 |
| 1971 | 406 183 008 $ US | #57 |
| 1970 | 316 571 429 $ US | #61 |
| 1969 | 285 523 810 $ US | - |
| 1968 | 254 285 714 $ US | - |
| 1967 | 230 285 714 $ US | - |
| 1966 | 219 047 619 $ US | - |
| 1965 | 188 761 905 $ US | - |
En 2025, les exportations de biens et services de la Tunisie s'élevaient à 26,8 milliards de dollars, contre 189 millions de dollars en 1965. Elles se classaient au 85e rang mondial, en baisse par rapport au 84e rang en 2024. Leur meilleur rang a été le 49e, occupé pour la dernière fois en 1979.
En 2025, les exportations de biens et services de la Tunisie étaient les 10es plus élevées de 50 pays situés en Afrique. Les importations de biens et services de la Tunisie s'élevaient à 31,5 milliards de dollars en 2025, au 82e rang mondial. En 2025, les importations de la Tunisie dépassaient ses exportations de 4,68 milliards de dollars, soit un déficit commercial.
Exportations de biens de la Tunisie par catégorie
Exportations de biens, 2024: 19,9 Md $US
La première catégorie des exportations de biens de la Tunisie est « machines, électronique et véhicules », avec 41,4 %, suivie de « textiles, vêtements, chaussures, meubles et jouets », avec 20,8 %.
Destinations des exportations de biens de la Tunisie : les 10 premières
| Rang | Pays | Exportations de biens | Part | |
|---|---|---|---|---|
| 1 |
 France |
4,33 Md $US | 21,7 % | vs France |
| 2 |
 Italie |
3,75 Md $US | 18,8 % | vs Italie |
| 3 |
 Allemagne |
2,66 Md $US | 13,3 % | |
| 4 |
 Espagne |
1,05 Md $US | 5,29 % | vs Espagne |
| 5 |
 Libye |
790 M $US | 3,97 % | vs Libye |
| 6 |
 États-Unis |
649 M $US | 3,26 % | |
| 7 |
 Algérie |
545 M $US | 2,74 % | vs Algérie |
| 8 |
 Royaume-Uni |
429 M $US | 2,15 % | vs R.-U. |
| 9 |
 Belgique |
339 M $US | 1,7 % | vs Belgique |
| 10 |
 Pays-Bas |
329 M $US | 1,65 % | |
| Autres partenaires et non précisés | 5,06 Md $US | 25,4 % |
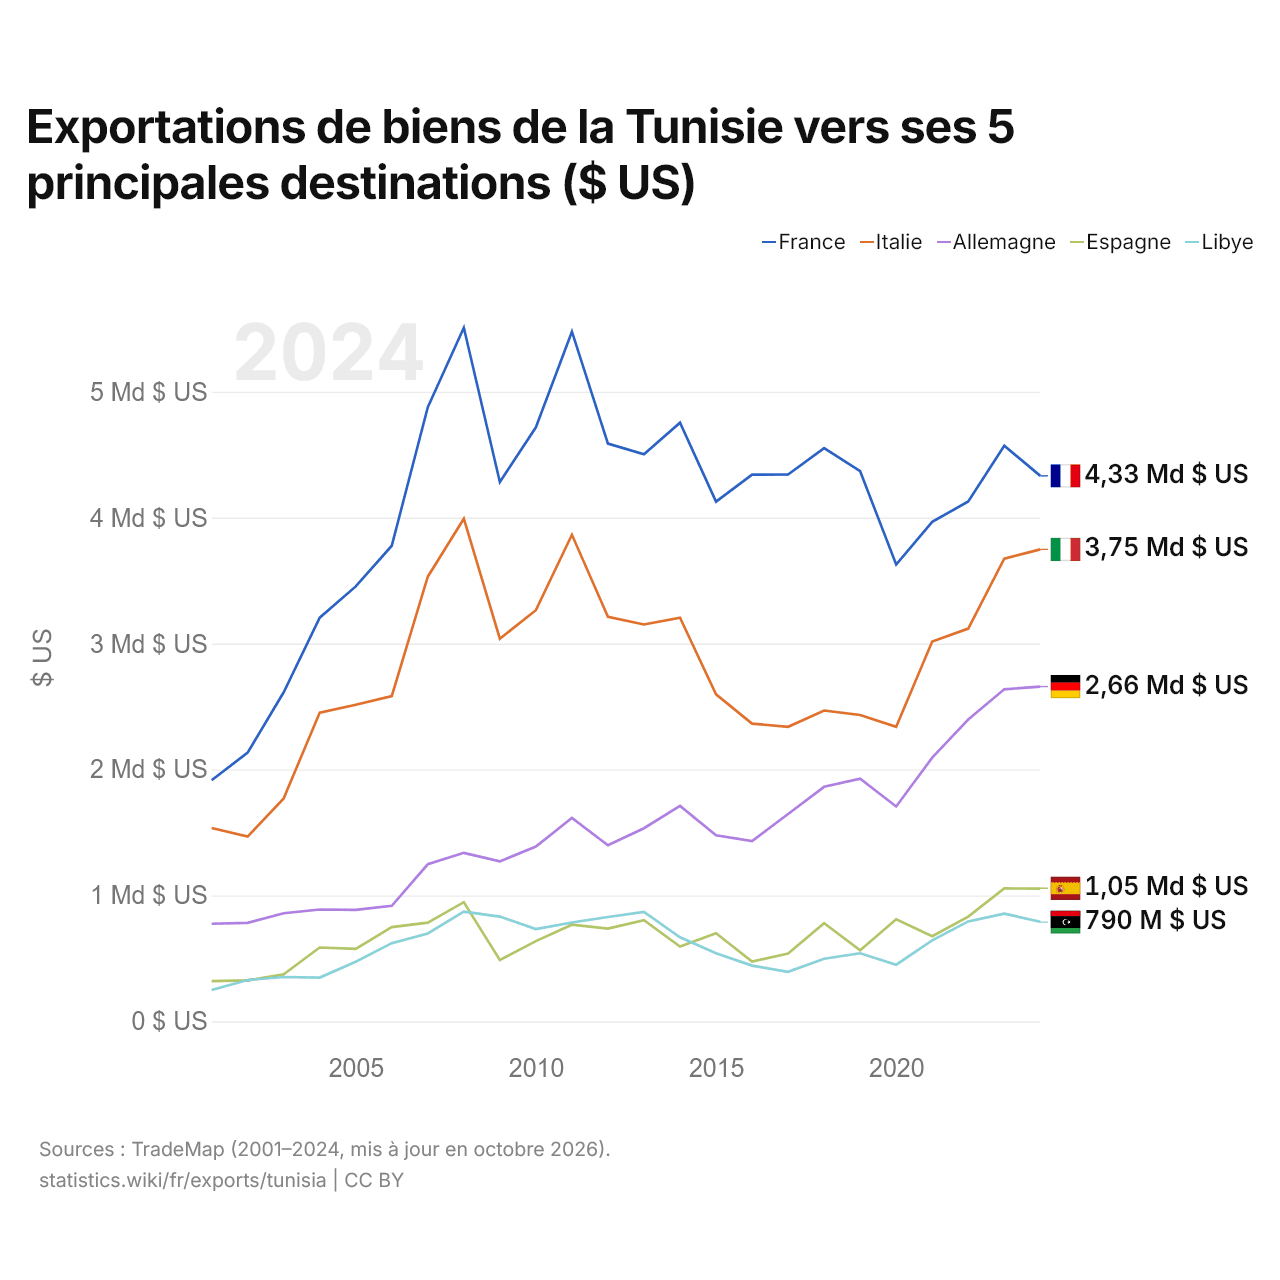
Exportations de biens de la Tunisie vers ses 5 principales destinations ($ US)
| Année | $ US | ||||
|---|---|---|---|---|---|
| France | Italie | Allemagne | Espagne | Libye | |
| 2024 | 4 331 557 000 $ US | 3 747 769 000 $ US | 2 658 351 000 $ US | 1 054 411 000 $ US | 790 378 000 $ US |
| 2023 | 4 571 290 000 $ US | 3 673 477 000 $ US | 2 636 703 000 $ US | 1 055 408 000 $ US | 855 397 000 $ US |
| 2022 | 4 127 783 000 $ US | 3 118 673 000 $ US | 2 396 192 000 $ US | 831 677 000 $ US | 793 602 000 $ US |
| 2021 | 3 966 802 000 $ US | 3 015 623 000 $ US | 2 093 785 000 $ US | 675 717 000 $ US | 642 507 000 $ US |
| 2020 | 3 627 108 000 $ US | 2 338 651 000 $ US | 1 706 235 000 $ US | 810 031 000 $ US | 449 564 000 $ US |
| 2019 | 4 368 568 000 $ US | 2 433 015 000 $ US | 1 927 000 000 $ US | 564 654 000 $ US | 540 378 000 $ US |
| 2018 | 4 552 388 000 $ US | 2 468 243 000 $ US | 1 862 401 000 $ US | 778 726 000 $ US | 497 326 000 $ US |
| 2017 | 4 342 335 000 $ US | 2 338 802 000 $ US | 1 646 121 000 $ US | 538 486 000 $ US | 393 624 000 $ US |
| 2016 | 4 341 916 000 $ US | 2 363 968 000 $ US | 1 430 883 000 $ US | 474 928 000 $ US | 442 725 000 $ US |
| 2015 | 4 126 877 000 $ US | 2 596 582 000 $ US | 1 476 872 000 $ US | 699 820 000 $ US | 540 044 000 $ US |
| 2014 | 4 753 371 000 $ US | 3 204 866 000 $ US | 1 710 359 000 $ US | 593 445 000 $ US | 667 786 000 $ US |
| 2013 | 4 502 924 000 $ US | 3 151 270 000 $ US | 1 533 390 000 $ US | 803 247 000 $ US | 868 975 000 $ US |
| 2012 | 4 587 399 000 $ US | 3 211 806 000 $ US | 1 398 391 000 $ US | 736 843 000 $ US | 828 478 000 $ US |
| 2011 | 5 476 753 000 $ US | 3 863 825 000 $ US | 1 615 551 000 $ US | 767 723 000 $ US | 784 732 000 $ US |
| 2010 | 4 717 284 000 $ US | 3 264 852 000 $ US | 1 388 065 000 $ US | 637 141 000 $ US | 732 335 000 $ US |
| 2009 | 4 283 306 000 $ US | 3 038 351 000 $ US | 1 270 073 000 $ US | 486 858 000 $ US | 831 842 000 $ US |
| 2008 | 5 507 524 000 $ US | 3 991 748 000 $ US | 1 338 022 000 $ US | 946 115 000 $ US | 871 231 000 $ US |
| 2007 | 4 877 607 000 $ US | 3 530 990 000 $ US | 1 247 543 000 $ US | 783 494 000 $ US | 697 500 000 $ US |
| 2006 | 3 776 862 000 $ US | 2 583 426 000 $ US | 917 234 000 $ US | 748 221 000 $ US | 620 703 000 $ US |
| 2005 | 3 453 805 000 $ US | 2 514 439 000 $ US | 885 436 000 $ US | 576 037 000 $ US | 472 688 000 $ US |
| 2004 | 3 205 145 000 $ US | 2 451 453 000 $ US | 887 887 000 $ US | 586 108 000 $ US | 347 569 000 $ US |
| 2003 | 2 613 224 000 $ US | 1 770 543 000 $ US | 858 030 000 $ US | 373 901 000 $ US | 352 160 000 $ US |
| 2002 | 2 133 839 000 $ US | 1 466 913 000 $ US | 782 276 000 $ US | 324 879 000 $ US | 327 715 000 $ US |
| 2001 | 1 914 474 000 $ US | 1 534 738 000 $ US | 774 634 000 $ US | 319 892 000 $ US | 248 573 000 $ US |
Les exportations de biens s'élèvent à 4,33 milliards de dollars vers la France (2024), 3,75 milliards de dollars vers l'Italie (2024), 2,66 milliards de dollars vers l'Allemagne (2024), 1,05 milliard de dollars vers l'Espagne (2024) et 790 millions de dollars vers la Libye (2024). Le premier rang des cinq destinations de la Tunisie est occupé par la France chaque année depuis 2001. Le changement le plus récent dans leur ordre remonte à 2015, quand les exportations de la Tunisie vers l'Espagne ont dépassé celles vers la Libye.
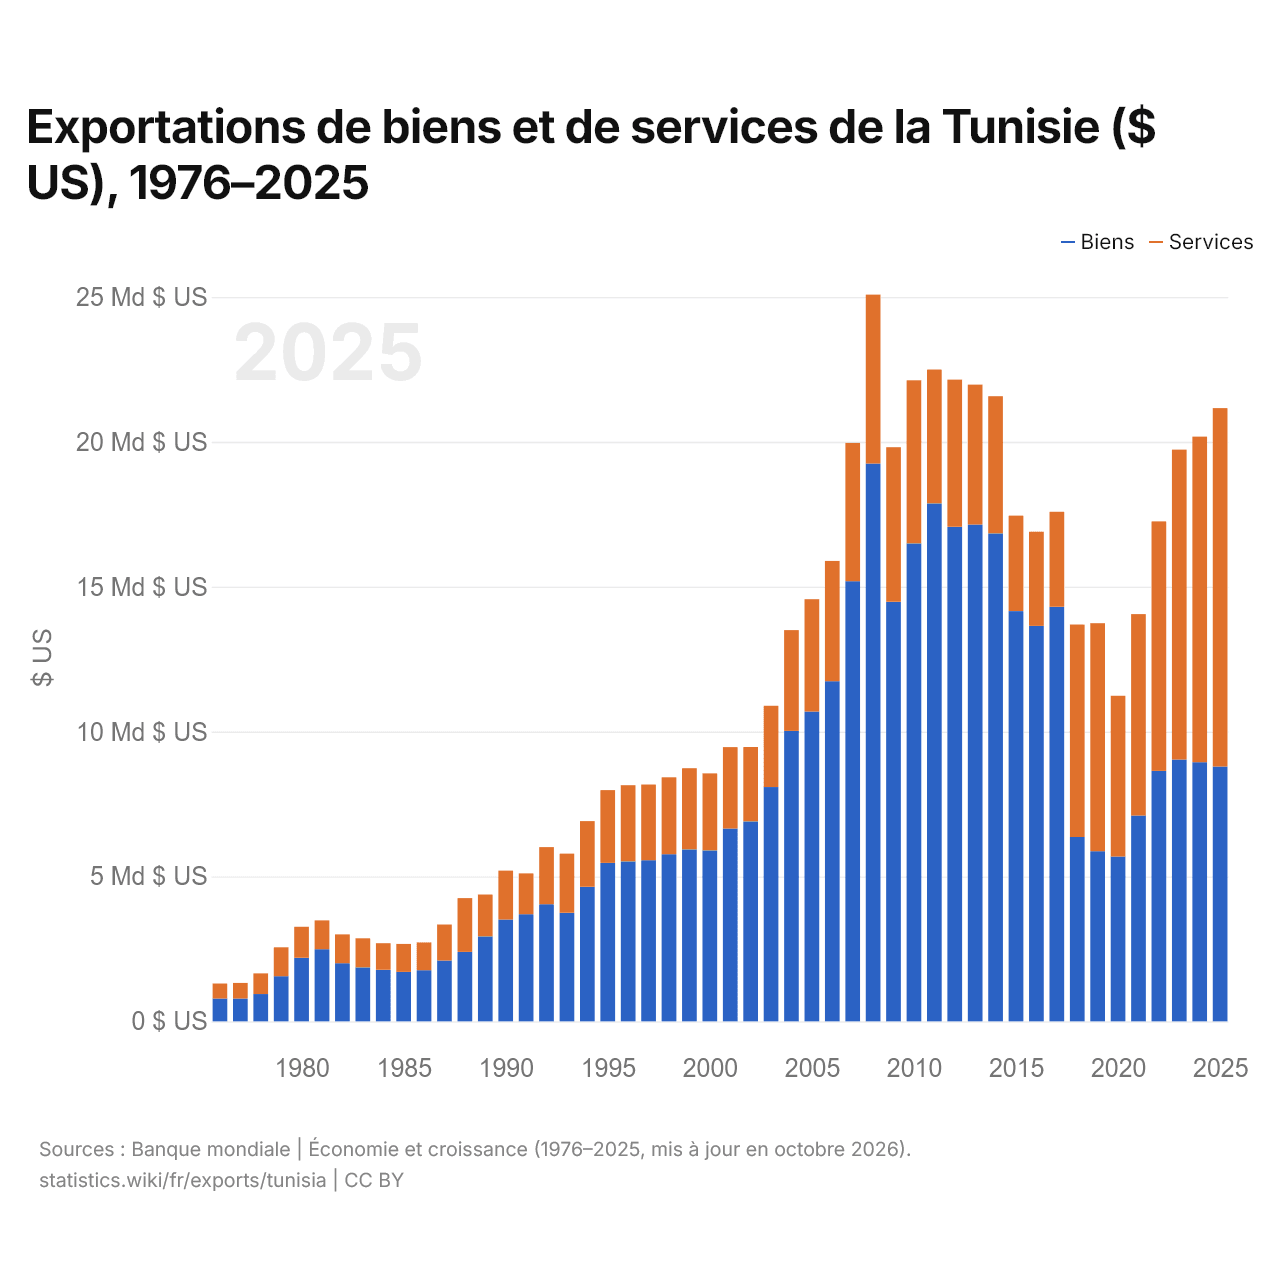
Exportations de biens et de services de la Tunisie ($ US), 1976–2025
| Année | $ US | |
|---|---|---|
| Biens | Services | |
| 2025 | 8 793 152 935 $ US | 12 369 822 489 $ US |
| 2024 | 8 945 050 720 $ US | 11 236 883 747 $ US |
| 2023 | 9 037 060 641 $ US | 10 694 747 013 $ US |
| 2022 | 8 643 740 957 $ US | 8 609 803 842 $ US |
| 2021 | 7 100 632 438 $ US | 6 953 642 421 $ US |
| 2020 | 5 686 530 875 $ US | 5 550 299 045 $ US |
| 2019 | 5 873 120 956 $ US | 7 868 159 038 $ US |
| 2018 | 6 362 089 985 $ US | 7 331 829 298 $ US |
| 2017 | 14 310 507 662 $ US | 3 273 753 061 $ US |
| 2016 | 13 650 114 058 $ US | 3 249 018 482 $ US |
| 2015 | 14 158 771 427 $ US | 3 294 156 630 $ US |
| 2014 | 16 841 268 205 $ US | 4 733 768 242 $ US |
| 2013 | 17 145 574 198 $ US | 4 830 677 219 $ US |
| 2012 | 17 071 350 446 $ US | 5 076 664 515 $ US |
| 2011 | 17 876 330 401 $ US | 4 618 324 316 $ US |
| 2010 | 16 493 433 003 $ US | 5 631 759 117 $ US |
| 2009 | 14 481 420 451 $ US | 5 333 876 433 $ US |
| 2008 | 19 248 517 148 $ US | 5 831 472 301 $ US |
| 2007 | 15 191 925 236 $ US | 4 772 123 333 $ US |
| 2006 | 11 738 021 450 $ US | 4 153 039 950 $ US |
| 2005 | 10 691 262 236 $ US | 3 876 808 057 $ US |
| 2004 | 10 025 157 906 $ US | 3 477 411 412 $ US |
| 2003 | 8 085 632 054 $ US | 2 805 678 621 $ US |
| 2002 | 6 900 731 501 $ US | 2 565 882 022 $ US |
| 2001 | 6 653 865 870 $ US | 2 810 151 437 $ US |
| 2000 | 5 899 976 897 $ US | 2 658 527 985 $ US |
| 1999 | 5 934 793 146 $ US | 2 801 323 526 $ US |
| 1998 | 5 768 732 574 $ US | 2 654 723 485 $ US |
| 1997 | 5 559 231 100 $ US | 2 613 236 480 $ US |
| 1996 | 5 518 752 836 $ US | 2 631 988 973 $ US |
| 1995 | 5 469 733 016 $ US | 2 509 119 746 $ US |
| 1994 | 4 643 349 961 $ US | 2 266 808 912 $ US |
| 1993 | 3 745 983 777 $ US | 2 040 365 632 $ US |
| 1992 | 4 041 005 540 $ US | 1 971 884 069 $ US |
| 1991 | 3 695 568 904 $ US | 1 410 307 829 $ US |
| 1990 | 3 514 611 006 $ US | 1 688 425 047 $ US |
| 1989 | 2 930 516 115 $ US | 1 446 297 133 $ US |
| 1988 | 2 399 148 990 $ US | 1 853 569 919 $ US |
| 1987 | 2 100 975 970 $ US | 1 240 553 301 $ US |
| 1986 | 1 763 159 414 $ US | 959 662 481 $ US |
| 1985 | 1 707 617 873 $ US | 964 654 307 $ US |
| 1984 | 1 781 591 934 $ US | 915 254 238 $ US |
| 1983 | 1 862 201 053 $ US | 1 003 290 283 $ US |
| 1982 | 2 004 443 978 $ US | 997 143 161 $ US |
| 1981 | 2 490 865 986 $ US | 994 321 300 $ US |
| 1980 | 2 195 310 174 $ US | 1 066 787 396 $ US |
| 1979 | 1 557 339 242 $ US | 998 862 136 $ US |
| 1978 | 941 920 888 $ US | 711 246 385 $ US |
| 1977 | 787 970 628 $ US | 538 524 305 $ US |
| 1976 | 788 292 230 $ US | 515 421 842 $ US |
En 2025, les exportations de biens de la Tunisie s'élevaient à 8,79 milliards de dollars et celles de services à 12,4 milliards de dollars ; les services représentaient 58,5 % du total, contre 39,5 % en 1976.
La Tunisie dans le classement mondial des exportations, 2025
| Rang | Pays | Exportations | Part mondiale | |
|---|---|---|---|---|
| 82 |
 Côte d’Ivoire |
29,7 Md $US | 0,09 % | |
| 83 |
 Ghana |
29,2 Md $US (2024) | 0,09 % | |
| 84 |
 Angola |
28,1 Md $US | 0,08 % | |
| 85 |
 Tunisie |
26,8 Md $US | 0,08 % | |
| 86 |
 Jordanie |
25,0 Md $US (2024) | 0,08 % | vs Jordanie |
| 87 |
 Uruguay |
23,1 Md $US | 0,07 % | |
| 88 |
 Kenya |
21,4 Md $US | 0,06 % |
Exportations de biens et services de la Tunisie, % du PIB, 1965–2025
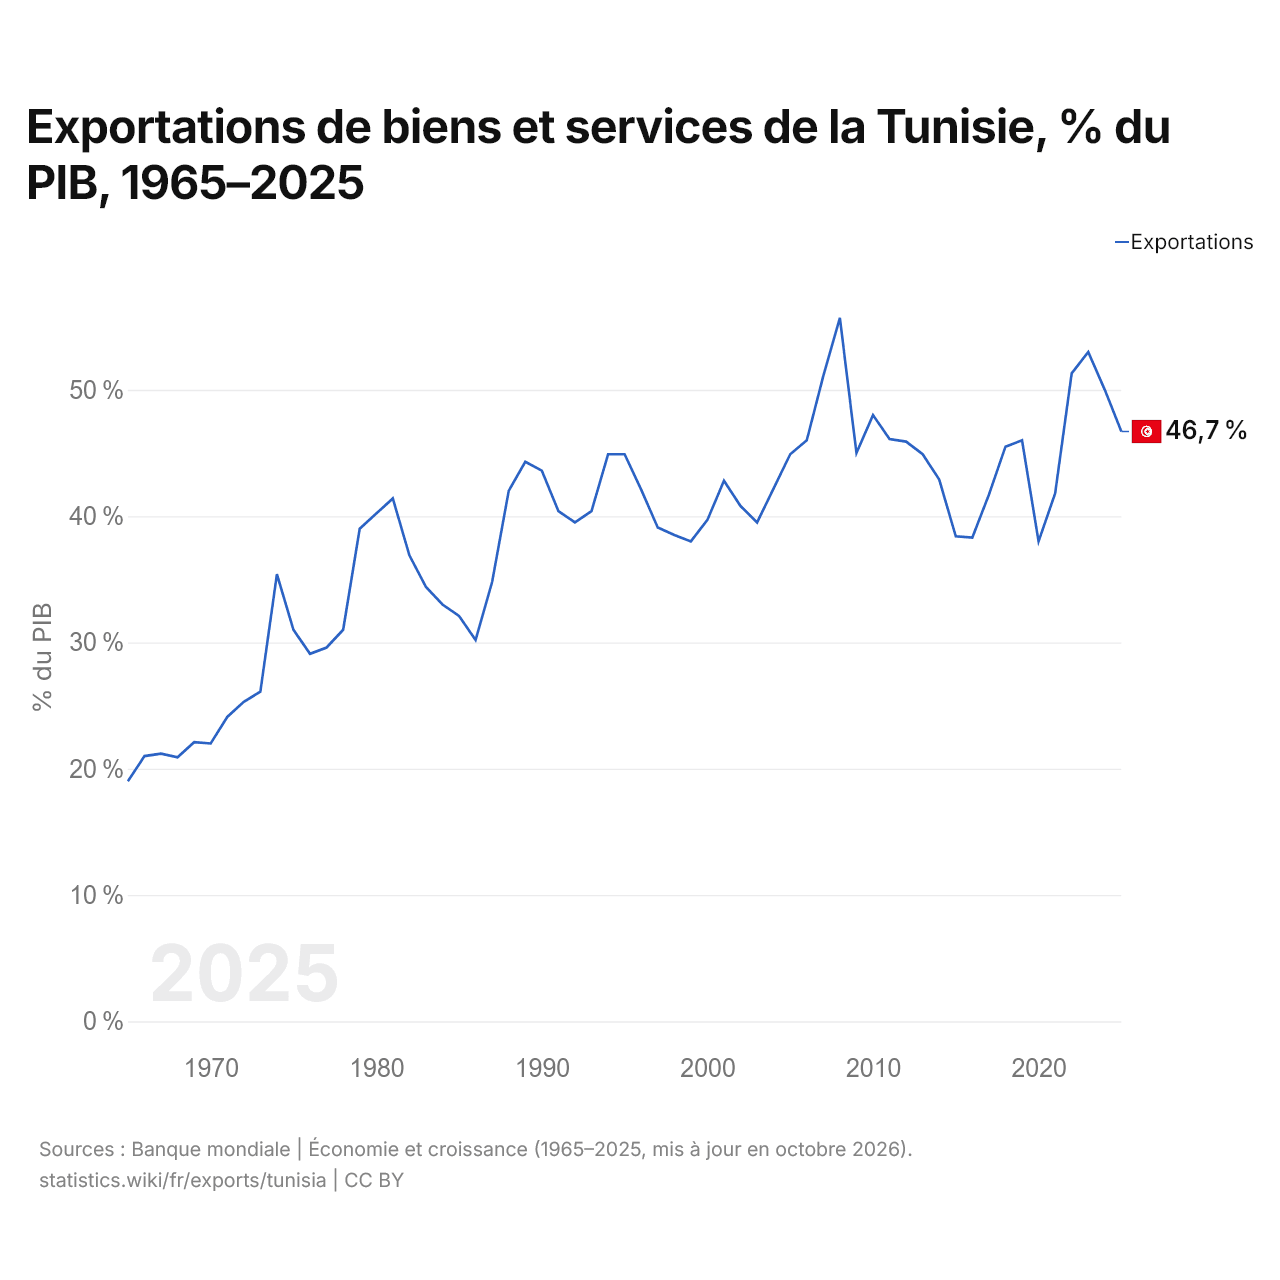
En 2025, les exportations de biens et services de la Tunisie équivalaient à 46,7 % de son PIB, contre 19,0 % en 1965. La part la plus élevée a été de 55,7 %, en 2008.
Comparer les exportations de la Tunisie avec celles d'autres pays
Sources :
- Banque mondiale | Économie et croissance (1965–2025, mis à jour en octobre 2026)
- TradeMap (2001–2024, mis à jour en octobre 2026)
Creative Commons Attribution (CC BY) : vous pouvez copier, partager, adapter et réutiliser ce contenu, y compris à des fins commerciales, à condition de citer statistics.wiki et d’indiquer les modifications apportées. Les sources citées ci-dessus peuvent avoir leurs propres conditions de licence.