
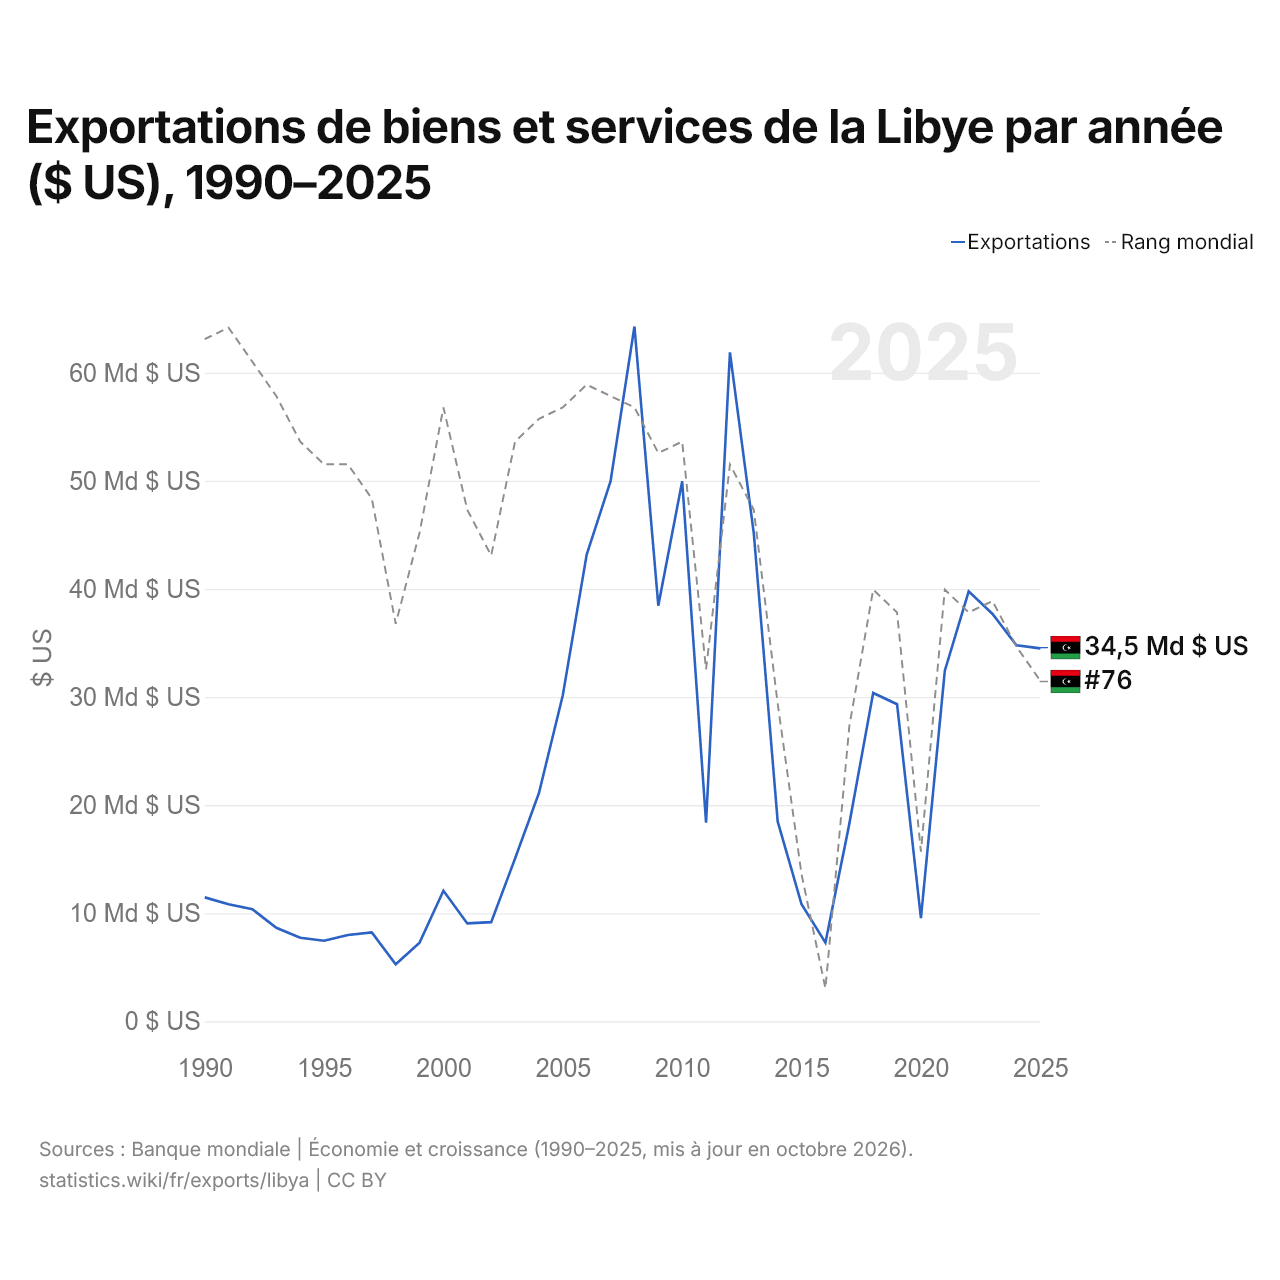
Exportations de biens et services de la Libye par année ($ US), 1990–2025
| Année | $ US | Rang mondial |
|---|---|---|
| Exportations | Rang mondial | |
| 2025 | 34 493 399 342 $ US | #76 |
| 2024 | 34 779 502 869 $ US | #73 |
| 2023 | 37 688 122 857 $ US | #69 |
| 2022 | 39 778 344 211 $ US | #70 |
| 2021 | 32 419 787 681 $ US | #68 |
| 2020 | 9 541 308 319 $ US | #91 |
| 2019 | 29 332 965 258 $ US | #70 |
| 2018 | 30 378 023 791 $ US | #68 |
| 2017 | 18 264 984 001 $ US | #80 |
| 2016 | 7 276 125 978 $ US | #103 |
| 2015 | 10 828 621 281 $ US | #93 |
| 2014 | 18 495 884 162 $ US | #78 |
| 2013 | 45 126 728 799 $ US | #61 |
| 2012 | 61 880 142 035 $ US | #57 |
| 2011 | 18 374 597 272 $ US | #75 |
| 2010 | 49 956 385 791 $ US | #55 |
| 2009 | 38 453 444 422 $ US | #56 |
| 2008 | 64 266 297 907 $ US | #52 |
| 2007 | 49 958 301 819 $ US | #51 |
| 2006 | 43 171 291 715 $ US | #50 |
| 2005 | 30 160 170 974 $ US | #52 |
| 2004 | 21 117 445 538 $ US | #53 |
| 2003 | 15 054 687 500 $ US | #55 |
| 2002 | 9 169 291 339 $ US | #65 |
| 2001 | 9 053 587 720 $ US | #61 |
| 2000 | 12 077 549 347 $ US | #52 |
| 1999 | 7 274 514 835 $ US | #63 |
| 1998 | 5 278 308 888 $ US | #71 |
| 1997 | 8 223 648 523 $ US | #60 |
| 1996 | 7 989 926 740 $ US | #57 |
| 1995 | 7 451 960 444 $ US | #57 |
| 1994 | 7 734 923 988 $ US | #55 |
| 1993 | 8 659 854 782 $ US | #51 |
| 1992 | 10 365 721 552 $ US | #48 |
| 1991 | 10 823 288 023 $ US | #45 |
| 1990 | 11 468 092 395 $ US | #46 |
En 2025, les exportations de biens et services de la Libye s'élevaient à 34,5 milliards de dollars, contre 11,5 milliards de dollars en 1990. Le maximum a été de 64,3 milliards de dollars, en 2008. Elles se classaient au 76e rang mondial, en baisse par rapport au 73e rang en 2024. Leur meilleur rang a été le 45e, occupé pour la dernière fois en 1991.
En 2025, les exportations de biens et services de la Libye étaient les 6es plus élevées de 50 pays situés en Afrique. Les importations de biens et services de la Libye s'élevaient à 31,7 milliards de dollars en 2025, au 81e rang mondial. En 2025, les exportations de la Libye dépassaient ses importations de 2,77 milliards de dollars, soit un excédent commercial.
Exportations de biens de la Libye par catégorie
Exportations de biens, 2019: 29,3 Md $US
La première catégorie des exportations de biens de la Libye est « pétrole, gaz, minerais et autres matières premières », avec 94,5 %, suivie de « métaux précieux, pierres précieuses, bijoux, montres, instruments de musique et art », avec 4,1 %.
Destinations des exportations de biens de la Libye : les 10 premières
| Rang | Pays | Exportations de biens | Part | |
|---|---|---|---|---|
| 1 |
 Italie |
9,73 Md $US | 33,2 % | |
| 2 |
 Chine |
6,58 Md $US | 22,5 % | |
| 3 |
 Espagne |
3,41 Md $US | 11,6 % | |
| 4 |
 France |
1,47 Md $US | 5 % | vs France |
| 5 |
 EAU |
1,21 Md $US | 4,13 % | |
| 6 |
 États-Unis |
777 M $US | 2,65 % | |
| 7 |
 Danemark |
739 M $US | 2,52 % | |
| 8 |
 Grèce |
694 M $US | 2,37 % | |
| 9 |
 Pays-Bas |
662 M $US | 2,26 % | |
| 10 |
 Australie |
571 M $US | 1,95 % | |
| Autres partenaires et non précisés | 3,45 Md $US | 11,8 % |
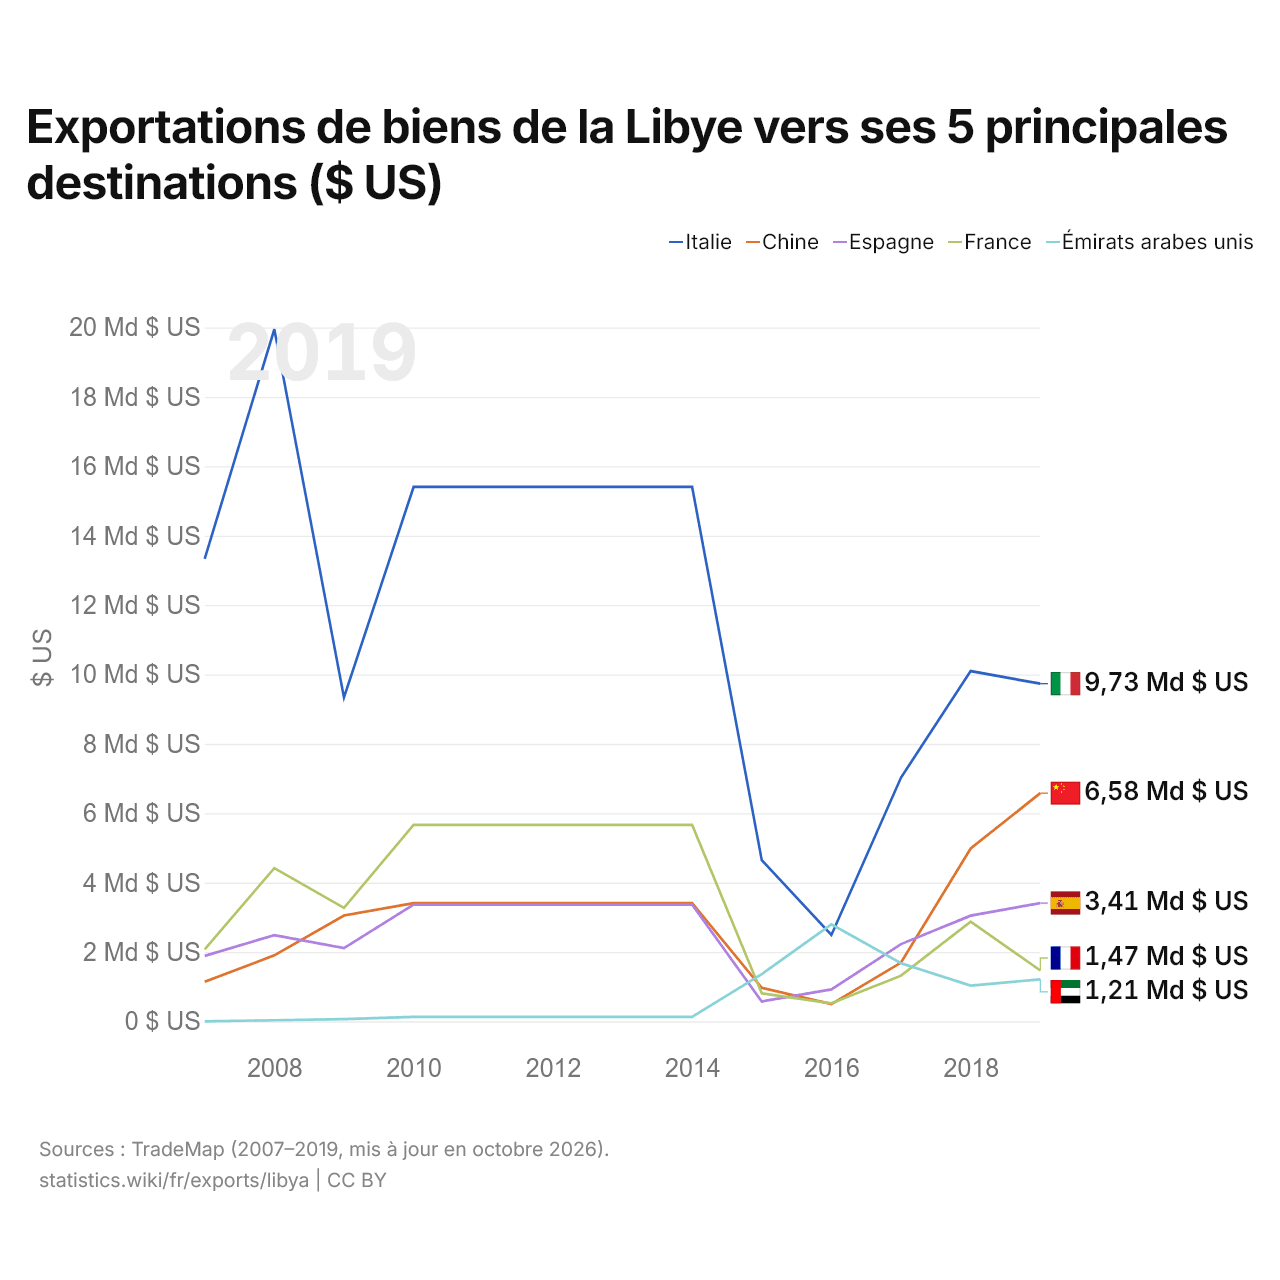
Exportations de biens de la Libye vers ses 5 principales destinations ($ US)
| Année | $ US | ||||
|---|---|---|---|---|---|
| Italie | Chine | Espagne | France | Émirats arabes unis | |
| 2019 | 9 732 906 000 $ US | 6 577 738 000 $ US | 3 409 091 000 $ US | 1 465 163 000 $ US | 1 210 753 000 $ US |
| 2018 | 10 096 075 000 $ US | 4 981 272 000 $ US | 3 045 929 000 $ US | 2 873 808 000 $ US | 1 031 553 000 $ US |
| 2017 | 7 026 846 000 $ US | 1 693 899 000 $ US | 2 226 920 000 $ US | 1 315 712 000 $ US | 1 675 288 000 $ US |
| 2016 | 2 490 189 000 $ US | 494 685 000 $ US | 920 028 000 $ US | 519 233 000 $ US | 2 796 446 000 $ US |
| 2015 | 4 644 529 000 $ US | 964 045 000 $ US | 571 425 000 $ US | 807 564 000 $ US | 1 361 318 000 $ US |
| 2014 | 15 403 950 000 $ US | 3 407 183 000 $ US | 3 364 062 000 $ US | 5 662 646 000 $ US | 130 352 000 $ US |
| 2013 | 15 403 950 000 $ US | 3 407 183 000 $ US | 3 364 062 000 $ US | 5 662 646 000 $ US | 130 352 000 $ US |
| 2012 | 15 403 950 000 $ US | 3 407 183 000 $ US | 3 364 062 000 $ US | 5 662 646 000 $ US | 130 352 000 $ US |
| 2011 | 15 403 950 000 $ US | 3 407 183 000 $ US | 3 364 062 000 $ US | 5 662 646 000 $ US | 130 352 000 $ US |
| 2010 | 15 403 950 000 $ US | 3 407 183 000 $ US | 3 364 062 000 $ US | 5 662 646 000 $ US | 130 352 000 $ US |
| 2009 | 9 336 255 000 $ US | 3 049 161 000 $ US | 2 110 099 000 $ US | 3 272 646 000 $ US | 65 652 000 $ US |
| 2008 | 19 949 114 000 $ US | 1 901 631 000 $ US | 2 484 587 000 $ US | 4 417 765 000 $ US | 31 304 000 $ US |
| 2007 | 13 332 005 000 $ US | 1 138 355 000 $ US | 1 887 474 000 $ US | 2 075 447 000 $ US | 976 000 $ US |
Les exportations de biens s'élèvent à 9,73 milliards de dollars vers l'Italie (2019), 6,58 milliards de dollars vers la Chine (2019), 3,41 milliards de dollars vers l'Espagne (2019), 1,47 milliard de dollars vers la France (2019) et 1,21 milliard de dollars vers les Émirats arabes unis (2019). Le premier rang des cinq destinations de la Libye est occupé par l'Italie depuis 2017. Le changement le plus récent dans leur ordre remonte à 2018, quand les exportations de la Libye vers la Chine ont dépassé celles vers l'Espagne.
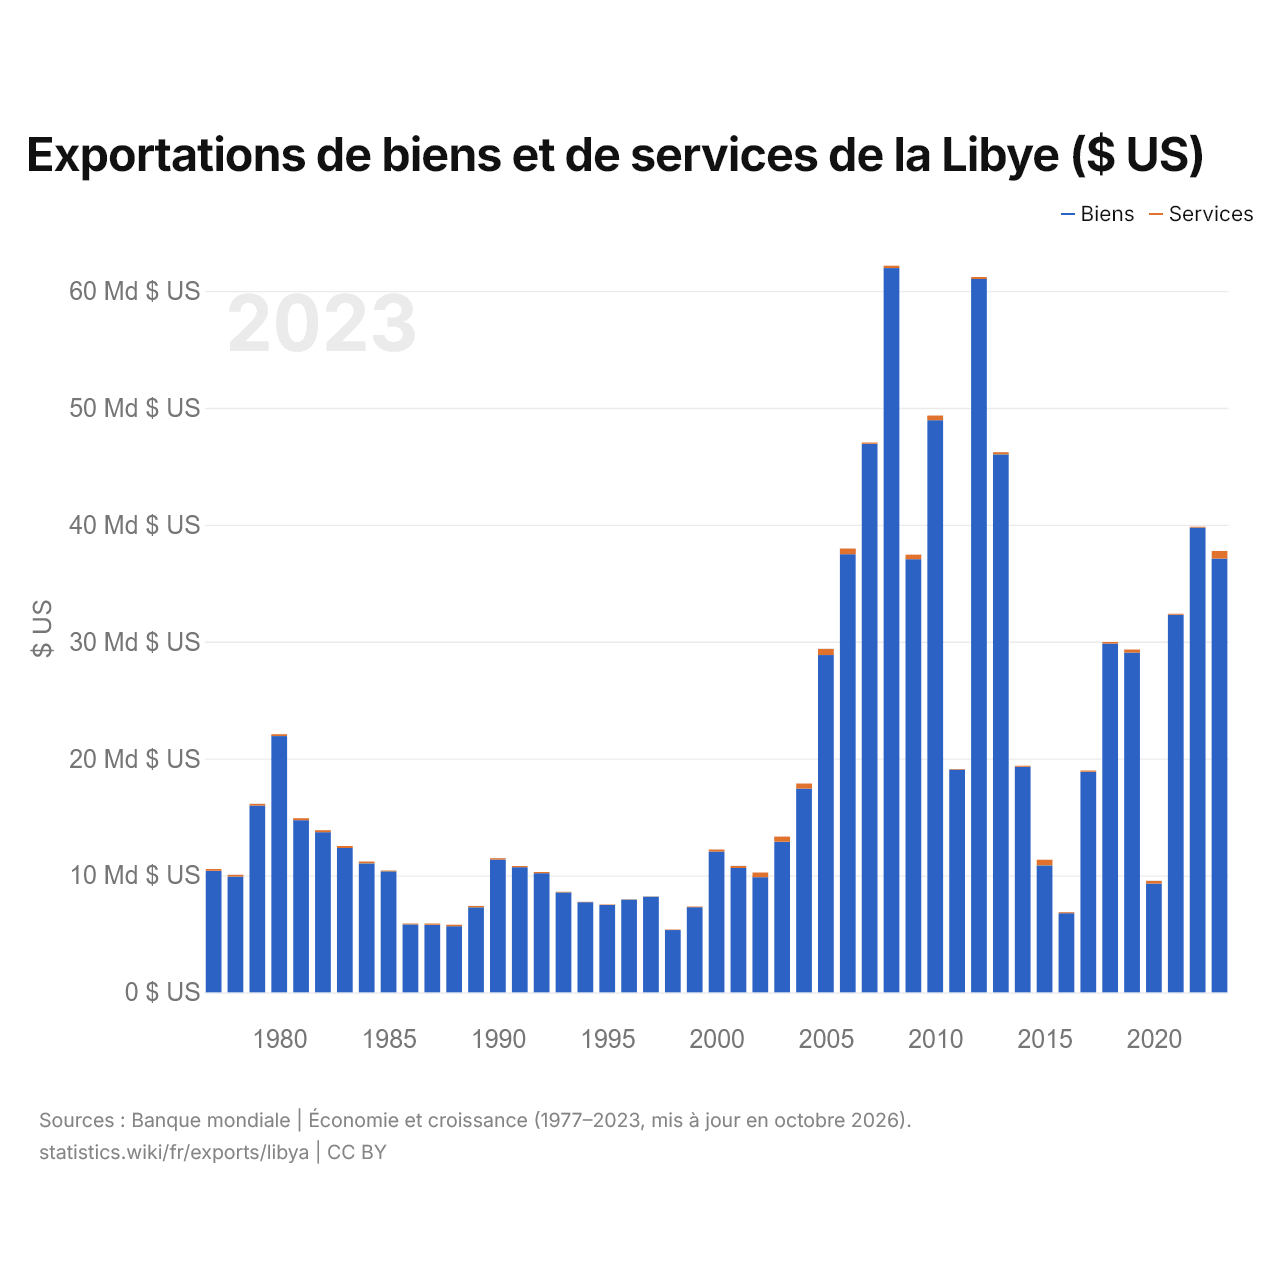
Exportations de biens et de services de la Libye ($ US)
| Année | $ US | |
|---|---|---|
| Biens | Services | |
| 2023 | 37 110 400 000 $ US | 642 200 000 $ US |
| 2022 | 39 746 900 000 $ US | 84 200 000 $ US |
| 2021 | 32 297 000 000 $ US | 82 800 000 $ US |
| 2020 | 9 311 500 000 $ US | 225 600 000 $ US |
| 2019 | 29 057 800 000 $ US | 268 100 000 $ US |
| 2018 | 29 830 400 000 $ US | 133 700 000 $ US |
| 2017 | 18 864 600 000 $ US | 107 000 000 $ US |
| 2016 | 6 764 100 000 $ US | 85 500 000 $ US |
| 2015 | 10 861 000 000 $ US | 483 000 000 $ US |
| 2014 | 19 300 000 000 $ US | 79 200 000 $ US |
| 2013 | 46 017 900 000 $ US | 179 900 000 $ US |
| 2012 | 61 026 100 000 $ US | 152 200 000 $ US |
| 2011 | 19 060 000 000 $ US | 40 200 000 $ US |
| 2010 | 48 935 000 000 $ US | 410 100 000 $ US |
| 2009 | 37 055 000 000 $ US | 385 000 000 $ US |
| 2008 | 61 950 100 000 $ US | 207 700 000 $ US |
| 2007 | 46 929 000 000 $ US | 108 500 000 $ US |
| 2006 | 37 473 000 000 $ US | 489 000 000 $ US |
| 2005 | 28 849 000 000 $ US | 534 000 000 $ US |
| 2004 | 17 425 000 000 $ US | 437 000 000 $ US |
| 2003 | 12 878 000 000 $ US | 442 000 000 $ US |
| 2002 | 9 851 000 000 $ US | 401 000 000 $ US |
| 2001 | 10 634 000 000 $ US | 184 000 000 $ US |
| 2000 | 12 038 000 000 $ US | 172 000 000 $ US |
| 1999 | 7 275 812 095 $ US | 59 075 817 $ US |
| 1998 | 5 326 210 760 $ US | 39 565 893 $ US |
| 1997 | 8 176 561 207 $ US | 27 556 810 $ US |
| 1996 | 7 930 178 183 $ US | 25 641 039 $ US |
| 1995 | 7 482 812 162 $ US | 30 611 396 $ US |
| 1994 | 7 704 491 748 $ US | 36 742 733 $ US |
| 1993 | 8 544 199 923 $ US | 54 867 392 $ US |
| 1992 | 10 191 318 833 $ US | 100 158 636 $ US |
| 1991 | 10 701 806 034 $ US | 98 671 913 $ US |
| 1990 | 11 351 549 902 $ US | 116 887 946 $ US |
| 1989 | 7 273 658 058 $ US | 117 489 337 $ US |
| 1988 | 5 653 222 833 $ US | 128 426 665 $ US |
| 1987 | 5 779 913 932 $ US | 112 783 735 $ US |
| 1986 | 5 806 989 140 $ US | 82 119 038 $ US |
| 1985 | 10 353 213 783 $ US | 62 826 588 $ US |
| 1984 | 11 027 755 180 $ US | 170 239 788 $ US |
| 1983 | 12 348 126 893 $ US | 161 119 800 $ US |
| 1982 | 13 700 925 218 $ US | 163 484 242 $ US |
| 1981 | 14 730 870 582 $ US | 163 147 153 $ US |
| 1980 | 21 919 214 938 $ US | 164 498 824 $ US |
| 1979 | 15 980 692 570 $ US | 142 543 008 $ US |
| 1978 | 9 899 645 703 $ US | 153 351 957 $ US |
| 1977 | 10 405 639 604 $ US | 136 125 195 $ US |
Les exportations de biens de la Libye s'élèvent à 37,1 milliards de dollars (2023) et celles de services à 642 millions de dollars ; les services représentent 1,7 % du total, contre 1,3 % en 1977.
La Libye dans le classement mondial des exportations, 2025
| Rang | Pays | Exportations | Part mondiale | |
|---|---|---|---|---|
| 73 |
 Panama |
38,4 Md $US (2024) | 0,12 % | |
| 74 |
 Estonie |
36,9 Md $US | 0,11 % | |
| 75 |
 Cambodge |
35,2 Md $US | 0,1 % | |
| 76 |
 Libye |
34,5 Md $US | 0,1 % | |
| 77 |
 Malte |
33,1 Md $US | 0,09 % | |
| 78 |
 Azerbaïdjan |
32,7 Md $US | 0,09 % | |
| 79 |
 Ouzbékistan |
32,4 Md $US | 0,09 % |
Exportations de biens et services de la Libye, % du PIB, 1990–2025
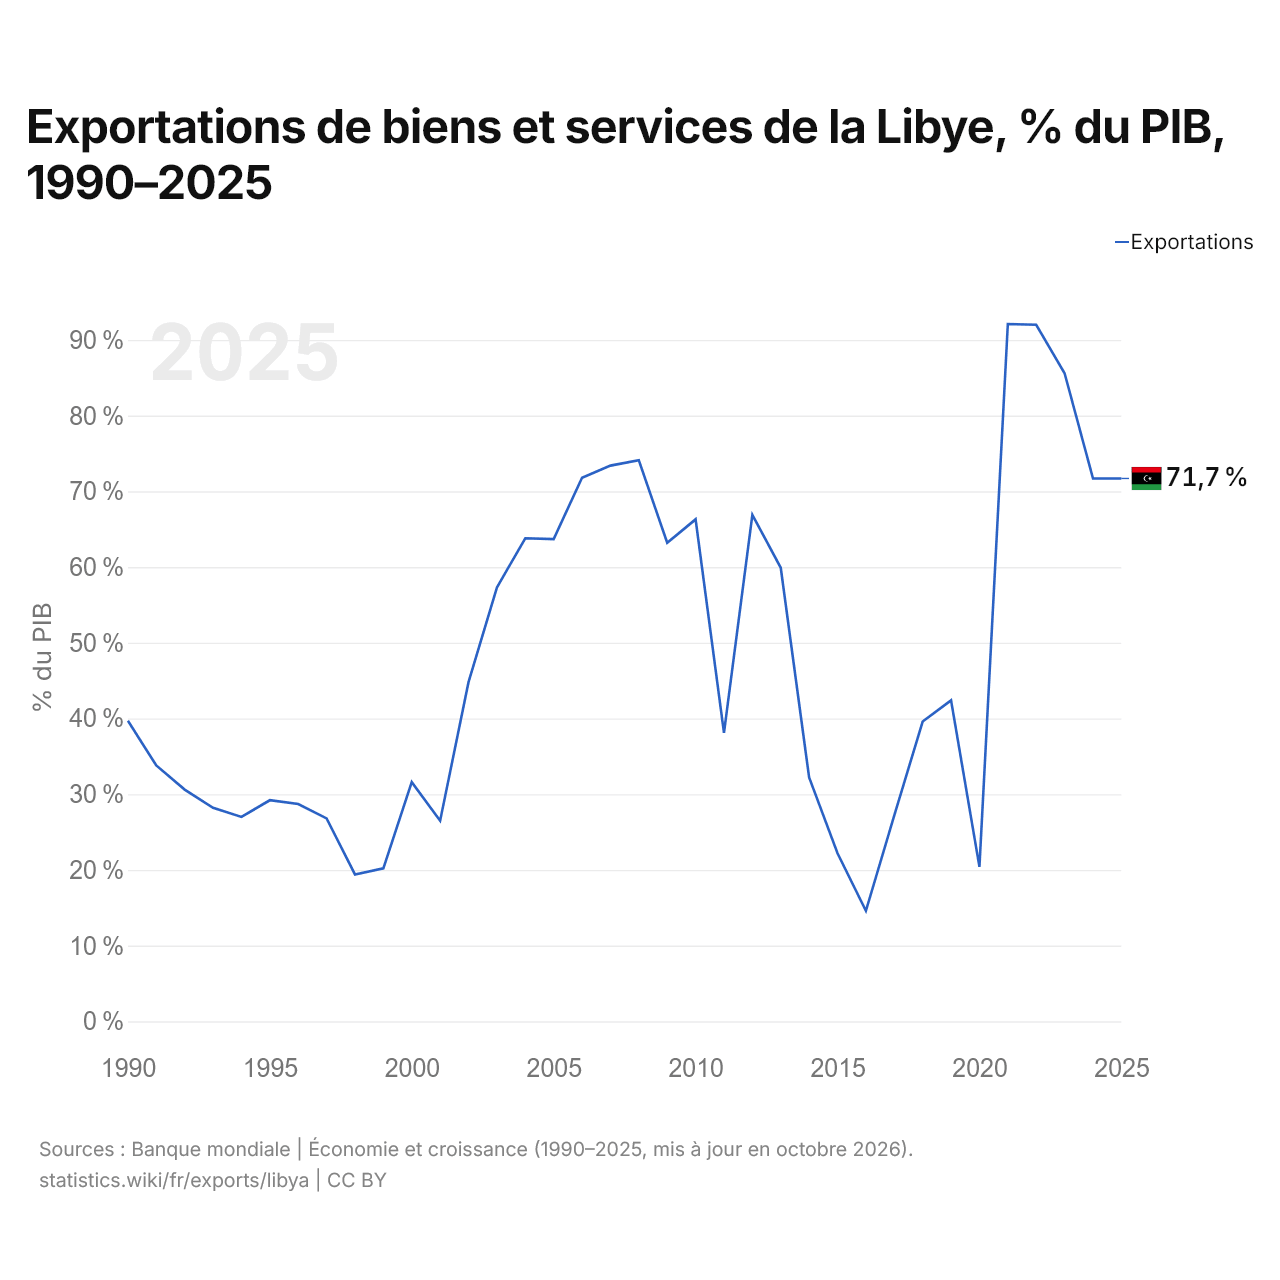
En 2025, les exportations de biens et services de la Libye équivalaient à 71,7 % de son PIB, contre 39,7 % en 1990. La part la plus élevée a été de 92,1 %, en 2021.
Comparer les exportations de la Libye avec celles d'autres pays
Sources :
- Banque mondiale | Économie et croissance (1977–2025, mis à jour en octobre 2026)
- TradeMap (2007–2019, mis à jour en octobre 2026)
Creative Commons Attribution (CC BY) : vous pouvez copier, partager, adapter et réutiliser ce contenu, y compris à des fins commerciales, à condition de citer statistics.wiki et d’indiquer les modifications apportées. Les sources citées ci-dessus peuvent avoir leurs propres conditions de licence.