
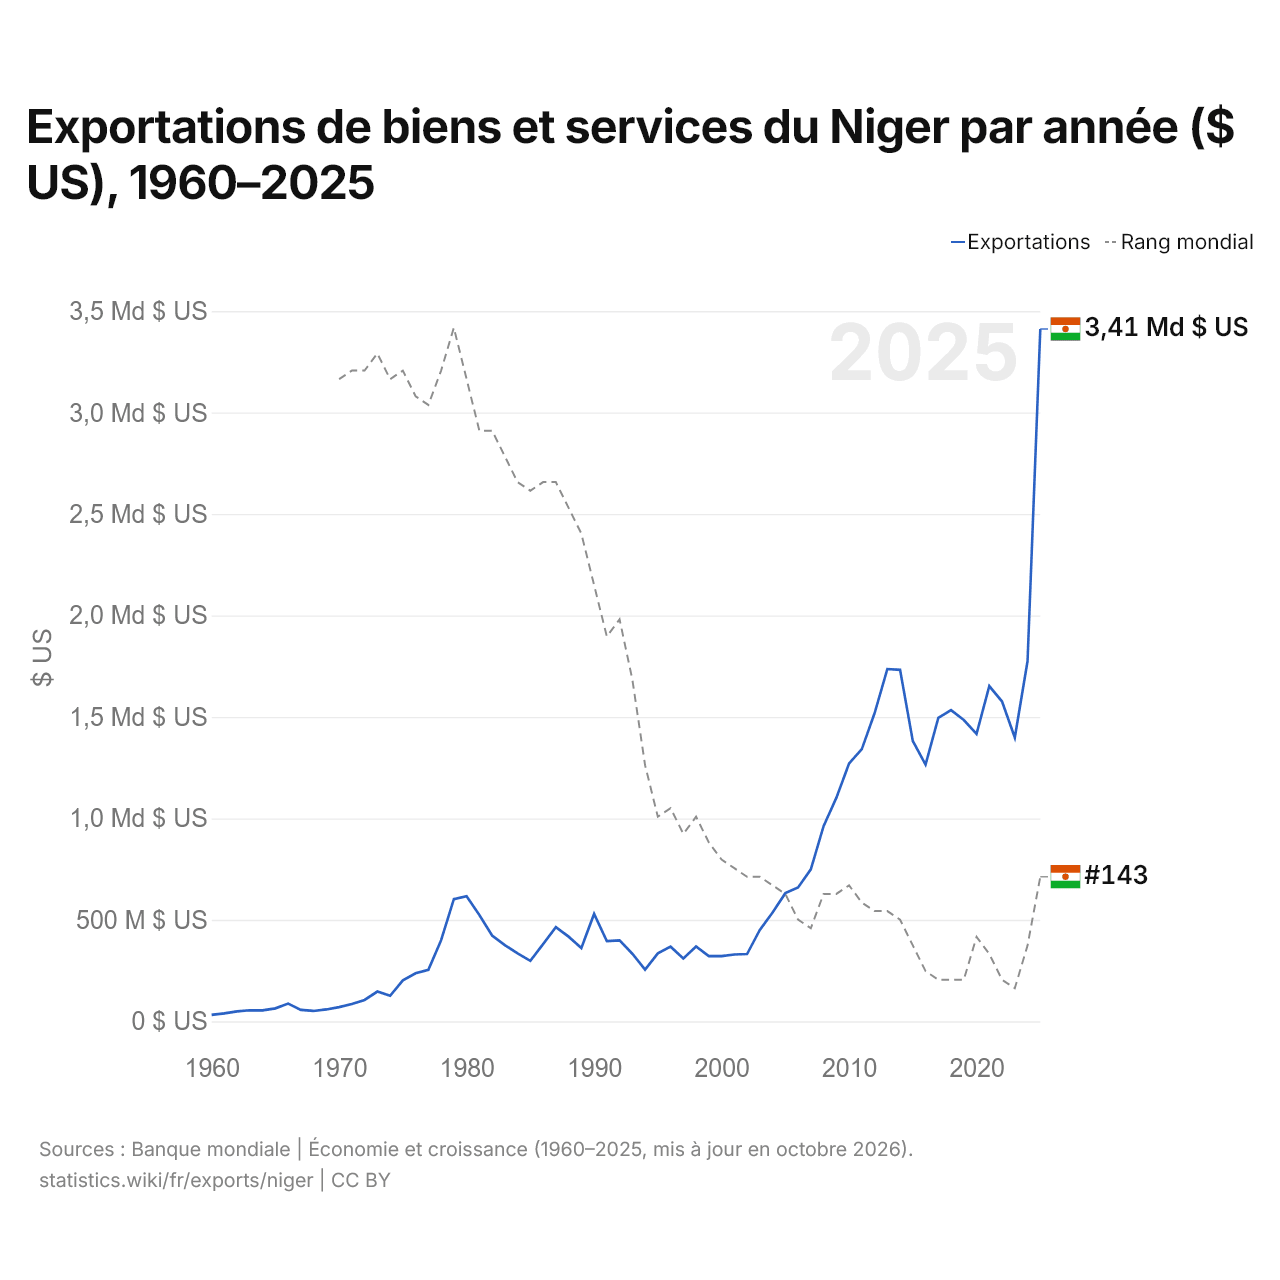
Exportations de biens et services du Niger par année ($ US), 1960–2025
| Année | $ US | Rang mondial |
|---|---|---|
| Exportations | Rang mondial | |
| 2025 | 3 411 837 458 $ US | #143 |
| 2024 | 1 775 252 490 $ US | #151 |
| 2023 | 1 398 553 093 $ US | #156 |
| 2022 | 1 575 783 108 $ US | #155 |
| 2021 | 1 652 265 675 $ US | #152 |
| 2020 | 1 416 889 905 $ US | #150 |
| 2019 | 1 485 042 917 $ US | #155 |
| 2018 | 1 533 317 906 $ US | #155 |
| 2017 | 1 495 756 314 $ US | #155 |
| 2016 | 1 265 134 823 $ US | #154 |
| 2015 | 1 381 730 102 $ US | #151 |
| 2014 | 1 732 190 087 $ US | #148 |
| 2013 | 1 736 088 772 $ US | #147 |
| 2012 | 1 517 787 336 $ US | #147 |
| 2011 | 1 341 345 173 $ US | #146 |
| 2010 | 1 270 669 545 $ US | #144 |
| 2009 | 1 101 191 245 $ US | #145 |
| 2008 | 961 860 898 $ US | #145 |
| 2007 | 748 906 704 $ US | #149 |
| 2006 | 659 728 358 $ US | #148 |
| 2005 | 631 697 899 $ US | #145 |
| 2004 | 536 185 488 $ US | #144 |
| 2003 | 450 538 549 $ US | #143 |
| 2002 | 331 604 229 $ US | #143 |
| 2001 | 329 494 484 $ US | #142 |
| 2000 | 321 460 766 $ US | #141 |
| 1999 | 321 173 939 $ US | #139 |
| 1998 | 369 279 336 $ US | #136 |
| 1997 | 310 060 813 $ US | #138 |
| 1996 | 367 972 057 $ US | #135 |
| 1995 | 334 744 119 $ US | #136 |
| 1994 | 254 680 843 $ US | #130 |
| 1993 | 333 024 231 $ US | #120 |
| 1992 | 398 954 556 $ US | #113 |
| 1991 | 394 885 756 $ US | #115 |
| 1990 | 529 264 181 $ US | #109 |
| 1989 | 361 801 929 $ US | #103 |
| 1988 | 417 302 495 $ US | #100 |
| 1987 | 464 530 515 $ US | #97 |
| 1986 | 380 827 485 $ US | #97 |
| 1985 | 297 998 035 $ US | #98 |
| 1984 | 334 702 554 $ US | #97 |
| 1983 | 375 494 052 $ US | #94 |
| 1982 | 423 104 824 $ US | #91 |
| 1981 | 524 397 196 $ US | #91 |
| 1980 | 616 701 299 $ US | #85 |
| 1979 | 602 012 072 $ US | #79 |
| 1978 | 399 776 063 $ US | #84 |
| 1977 | 253 675 833 $ US | #88 |
| 1976 | 237 000 515 $ US | #87 |
| 1975 | 201 836 609 $ US | #84 |
| 1974 | 125 912 801 $ US | #85 |
| 1973 | 146 829 467 $ US | #82 |
| 1972 | 105 576 520 $ US | #84 |
| 1971 | 85 780 084 $ US | #84 |
| 1970 | 70 011 508 $ US | #85 |
| 1969 | 58 566 573 $ US | - |
| 1968 | 51 153 497 $ US | - |
| 1967 | 56 105 882 $ US | - |
| 1966 | 87 454 925 $ US | - |
| 1965 | 63 869 423 $ US | - |
| 1964 | 54 007 617 $ US | - |
| 1963 | 54 590 795 $ US | - |
| 1962 | 49 364 166 $ US | - |
| 1961 | 39 451 761 $ US | - |
| 1960 | 31 918 254 $ US | - |
En 2025, les exportations de biens et services du Niger s'élevaient à 3,41 milliards de dollars, contre 31,9 millions de dollars en 1960. Elles se classaient au 143e rang mondial, en hausse par rapport au 151e rang en 2024. Leur meilleur rang a été le 79e, occupé pour la dernière fois en 1979.
En 2025, les exportations de biens et services du Niger étaient les 36es plus élevées de 50 pays situés en Afrique. Les importations de biens et services du Niger s'élevaient à 3,93 milliards de dollars en 2025, au 145e rang mondial. En 2025, les importations du Niger dépassaient ses exportations de 516 millions de dollars, soit un déficit commercial.
Exportations de biens du Niger par catégorie, 2025
Exportations de biens, 2025: 2,13 Md $US
En 2025, la première catégorie des exportations de biens du Niger était « pétrole, gaz, minerais et autres matières premières », avec 93,0 %, suivie de « métaux précieux, pierres précieuses, bijoux, montres, instruments de musique et art », avec 3,3 %.
Destinations des exportations de biens du Niger : les 10 premières, 2025
| Rang | Pays | Exportations de biens | Part | |
|---|---|---|---|---|
| 1 |
 Italie |
859 M $US | 40,4 % | |
| 2 |
 Pays-Bas |
628 M $US | 29,6 % | |
| 3 |
 Chine |
164 M $US | 7,7 % | |
| 4 |
 Singapour |
88,9 M $US | 4,18 % | |
| 5 |
 Royaume-Uni |
85,4 M $US | 4,02 % | |
| 6 |
 EAU |
70,6 M $US | 3,32 % | |
| 7 |
 Allemagne |
67,0 M $US | 3,15 % | |
| 8 |
 Tchad |
49,1 M $US | 2,31 % | |
| 9 |
 Nigeria |
36,5 M $US | 1,72 % | |
| 10 |
 Burkina Faso |
23,5 M $US | 1,11 % | |
| Autres partenaires et non précisés | 53,2 M $US | 2,5 % |
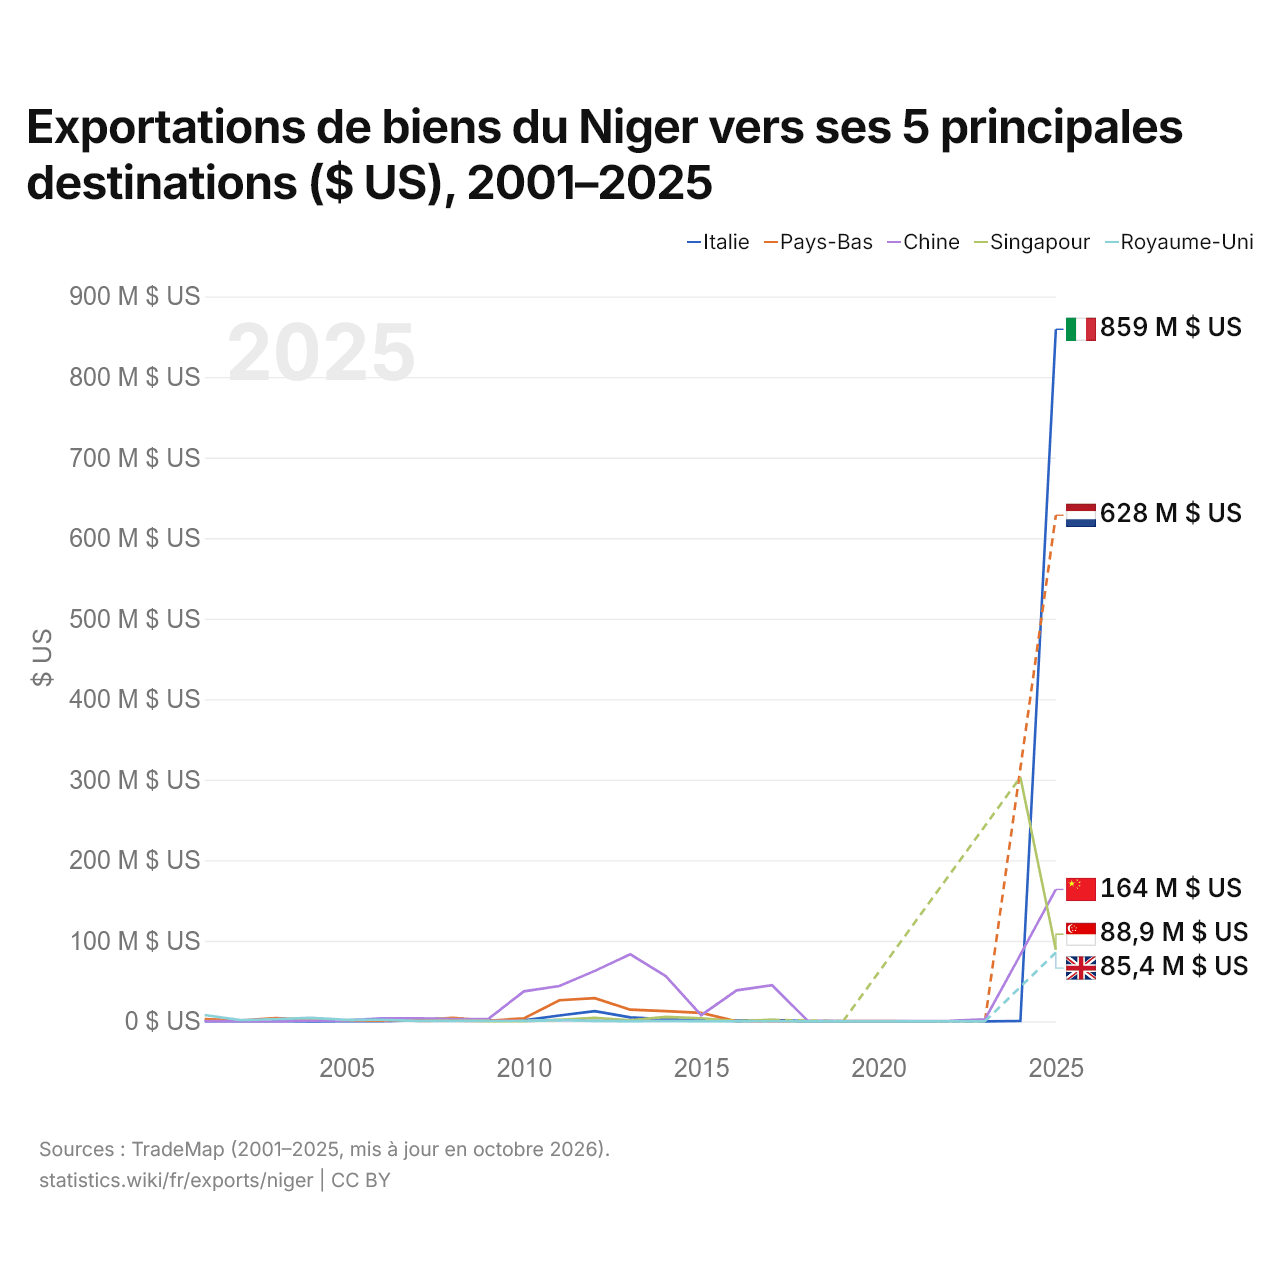
Exportations de biens du Niger vers ses 5 principales destinations ($ US), 2001–2025
| Année | $ US | ||||
|---|---|---|---|---|---|
| Italie | Pays-Bas | Chine | Singapour | Royaume-Uni | |
| 2025 | 859 270 000 $ US | 628 355 000 $ US | 163 755 000 $ US | 88 857 000 $ US | 85 388 000 $ US |
| 2024 | 446 000 $ US | - | 82 727 000 $ US | 303 159 000 $ US | - |
| 2023 | 1 000 $ US | 132 000 $ US | 2 414 000 $ US | - | 21 000 $ US |
| 2022 | - | 72 000 $ US | 581 000 $ US | - | 52 000 $ US |
| 2021 | 78 000 $ US | 43 000 $ US | 314 000 $ US | - | 29 000 $ US |
| 2020 | 39 000 $ US | 213 000 $ US | 158 000 $ US | - | 39 000 $ US |
| 2019 | 69 000 $ US | 157 000 $ US | 280 000 $ US | 147 000 $ US | 29 000 $ US |
| 2018 | 171 000 $ US | 124 000 $ US | 860 000 $ US | - | 39 000 $ US |
| 2017 | 1 505 000 $ US | 318 000 $ US | 44 830 000 $ US | 1 869 000 $ US | 63 000 $ US |
| 2016 | 850 000 $ US | 101 000 $ US | 38 485 000 $ US | 342 000 $ US | 23 000 $ US |
| 2015 | 2 139 000 $ US | 10 472 000 $ US | 7 666 000 $ US | 3 853 000 $ US | 197 000 $ US |
| 2014 | 2 582 000 $ US | 12 664 000 $ US | 56 278 000 $ US | 5 539 000 $ US | 578 000 $ US |
| 2013 | 4 906 000 $ US | 14 494 000 $ US | 83 176 000 $ US | 1 340 000 $ US | 324 000 $ US |
| 2012 | 12 595 000 $ US | 28 766 000 $ US | 62 644 000 $ US | 4 294 000 $ US | 468 000 $ US |
| 2011 | 7 270 000 $ US | 26 223 000 $ US | 43 843 000 $ US | 1 840 000 $ US | 1 603 000 $ US |
| 2010 | 1 254 000 $ US | 3 658 000 $ US | 37 224 000 $ US | 182 000 $ US | 495 000 $ US |
| 2009 | 904 000 $ US | 774 000 $ US | 3 063 000 $ US | 265 000 $ US | 386 000 $ US |
| 2008 | 1 767 000 $ US | 4 225 000 $ US | 2 788 000 $ US | 759 000 $ US | 387 000 $ US |
| 2007 | 1 154 000 $ US | 1 615 000 $ US | 3 876 000 $ US | 409 000 $ US | 555 000 $ US |
| 2006 | 207 000 $ US | 870 000 $ US | 3 793 000 $ US | - | 1 864 000 $ US |
| 2005 | 302 000 $ US | 1 226 000 $ US | 1 233 000 $ US | - | 1 735 000 $ US |
| 2004 | 49 000 $ US | 1 946 000 $ US | 860 000 $ US | - | 4 316 000 $ US |
| 2003 | 73 000 $ US | 3 916 000 $ US | 144 000 $ US | - | 2 643 000 $ US |
| 2002 | 146 000 $ US | 1 041 000 $ US | 210 000 $ US | - | 1 489 000 $ US |
| 2001 | 102 000 $ US | 2 805 000 $ US | 337 000 $ US | - | 7 871 000 $ US |
En 2025, les exportations de biens s'élevaient à 859 millions de dollars vers l'Italie, 628 millions de dollars vers les Pays-Bas, 164 millions de dollars vers la Chine, 88,9 millions de dollars vers Singapour et 85,4 millions de dollars vers le Royaume-Uni. Le changement le plus récent dans leur ordre remonte à 2025, quand les exportations du Niger vers l'Italie ont dépassé celles vers les Pays-Bas.
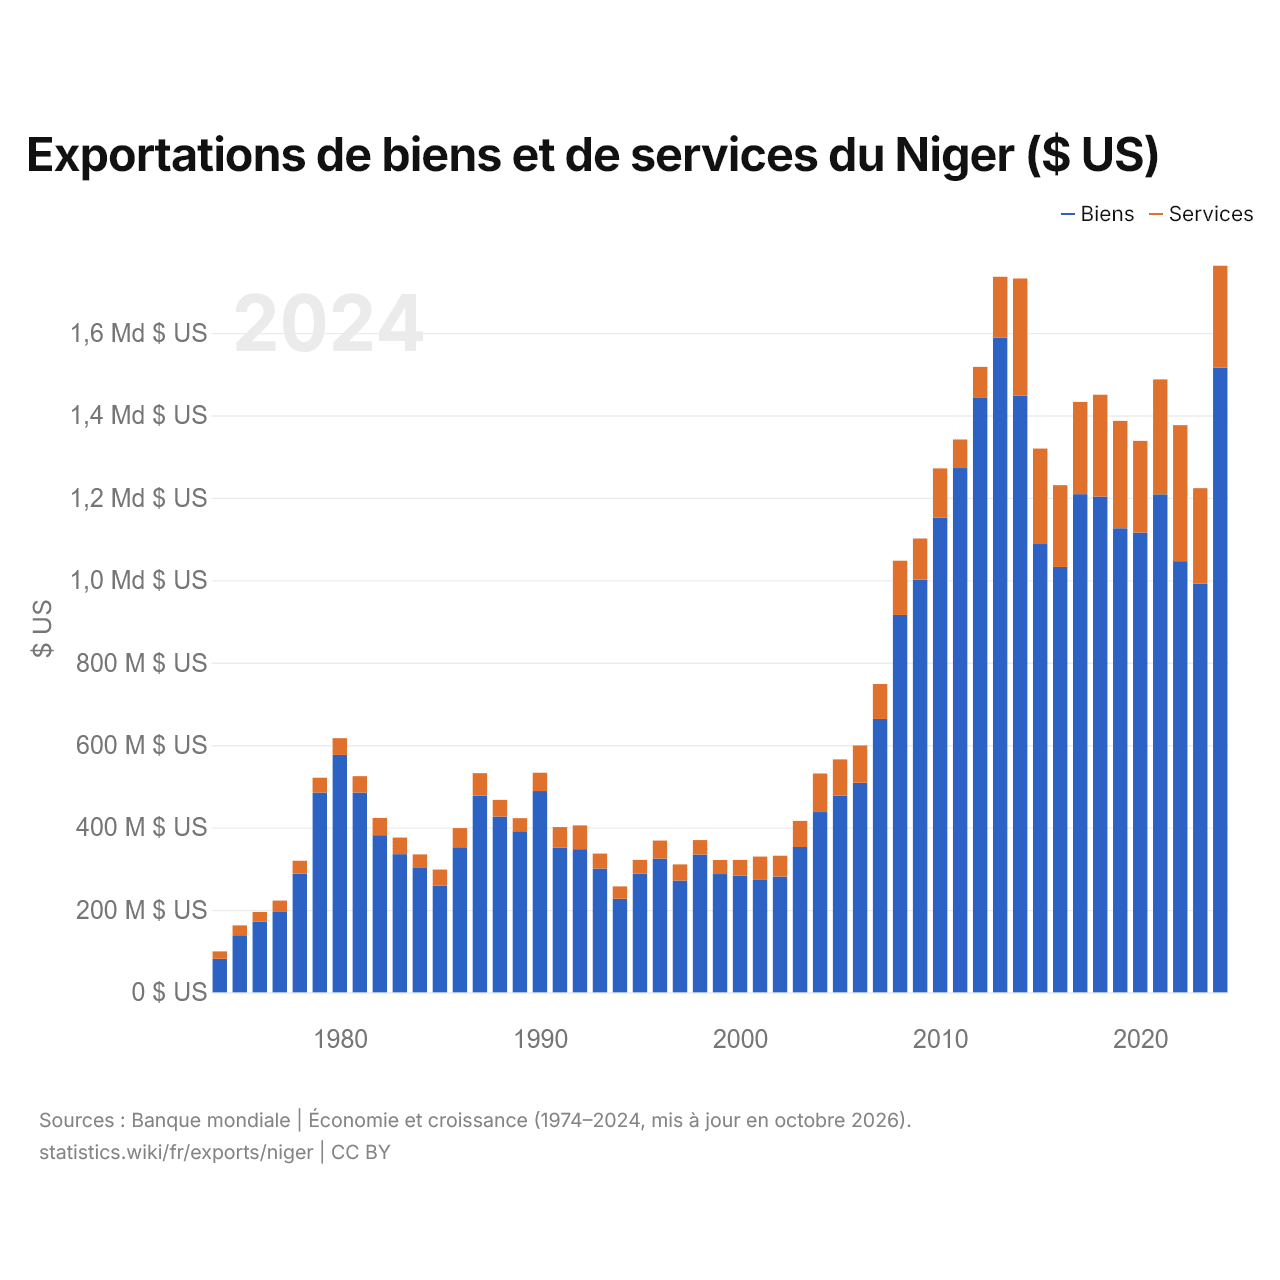
Exportations de biens et de services du Niger ($ US)
| Année | $ US | |
|---|---|---|
| Biens | Services | |
| 2024 | 1 515 515 027 $ US | 247 645 773 $ US |
| 2023 | 991 833 338 $ US | 231 236 836 $ US |
| 2022 | 1 046 190 238 $ US | 329 845 387 $ US |
| 2021 | 1 208 259 579 $ US | 278 877 269 $ US |
| 2020 | 1 115 530 529 $ US | 222 476 170 $ US |
| 2019 | 1 125 986 686 $ US | 260 668 065 $ US |
| 2018 | 1 203 027 402 $ US | 246 955 702 $ US |
| 2017 | 1 208 704 799 $ US | 223 827 967 $ US |
| 2016 | 1 032 292 902 $ US | 198 366 514 $ US |
| 2015 | 1 087 745 053 $ US | 231 599 764 $ US |
| 2014 | 1 448 276 221 $ US | 283 798 116 $ US |
| 2013 | 1 588 600 117 $ US | 147 572 495 $ US |
| 2012 | 1 442 271 782 $ US | 75 439 275 $ US |
| 2011 | 1 272 054 638 $ US | 69 368 903 $ US |
| 2010 | 1 152 139 472 $ US | 119 152 554 $ US |
| 2009 | 1 000 866 643 $ US | 100 324 601 $ US |
| 2008 | 915 849 691 $ US | 131 504 472 $ US |
| 2007 | 663 400 817 $ US | 84 745 388 $ US |
| 2006 | 508 403 469 $ US | 90 636 825 $ US |
| 2005 | 477 741 119 $ US | 87 575 662 $ US |
| 2004 | 437 434 787 $ US | 93 577 548 $ US |
| 2003 | 352 600 289 $ US | 63 466 397 $ US |
| 2002 | 280 762 990 $ US | 50 794 765 $ US |
| 2001 | 272 730 242 $ US | 56 764 242 $ US |
| 2000 | 283 797 150 $ US | 37 615 742 $ US |
| 1999 | 286 896 257 $ US | 34 115 206 $ US |
| 1998 | 333 990 012 $ US | 35 319 836 $ US |
| 1997 | 271 335 121 $ US | 39 171 149 $ US |
| 1996 | 324 742 861 $ US | 43 586 930 $ US |
| 1995 | 288 064 617 $ US | 33 282 685 $ US |
| 1994 | 226 815 445 $ US | 30 388 792 $ US |
| 1993 | 300 417 520 $ US | 36 459 620 $ US |
| 1992 | 347 286 919 $ US | 57 697 292 $ US |
| 1991 | 351 526 308 $ US | 49 552 136 $ US |
| 1990 | 488 388 532 $ US | 44 449 376 $ US |
| 1989 | 390 789 206 $ US | 31 698 235 $ US |
| 1988 | 426 311 094 $ US | 40 708 654 $ US |
| 1987 | 477 399 485 $ US | 54 113 216 $ US |
| 1986 | 351 989 379 $ US | 46 539 778 $ US |
| 1985 | 259 424 902 $ US | 38 560 935 $ US |
| 1984 | 303 272 636 $ US | 31 355 512 $ US |
| 1983 | 335 227 987 $ US | 40 334 217 $ US |
| 1982 | 381 328 715 $ US | 41 803 830 $ US |
| 1981 | 484 629 213 $ US | 39 837 126 $ US |
| 1980 | 576 085 082 $ US | 40 557 639 $ US |
| 1979 | 484 948 301 $ US | 35 685 132 $ US |
| 1978 | 287 650 407 $ US | 31 517 019 $ US |
| 1977 | 196 642 224 $ US | 26 025 758 $ US |
| 1976 | 171 638 063 $ US | 23 373 042 $ US |
| 1975 | 138 517 093 $ US | 23 904 301 $ US |
| 1974 | 81 514 830 $ US | 17 860 061 $ US |
Les exportations de biens du Niger s'élèvent à 1,52 milliard de dollars (2024) et celles de services à 248 millions de dollars ; les services représentent 14,0 % du total, contre 18,0 % en 1974.
Le Niger dans le classement mondial des exportations, 2025
| Rang | Pays | Exportations | Part mondiale | |
|---|---|---|---|---|
| 140 |
 Monténégro |
3,70 Md $US | 0,01 % | |
| 141 |
 Palestine |
3,64 Md $US | 0,01 % | |
| 142 |
 Rwanda |
3,53 Md $US | 0,01 % | |
| 143 |
 Niger |
3,41 Md $US | 0,01 % | |
| 144 |
 Fidji |
3,25 Md $US (2024) | 0,01 % | |
| 145 |
 Suriname |
3,18 Md $US | 0,009 % | |
| 146 |
 Afghanistan |
2,79 Md $US (2024) | 0,009 % |
Exportations de biens et services du Niger, % du PIB, 1960–2025
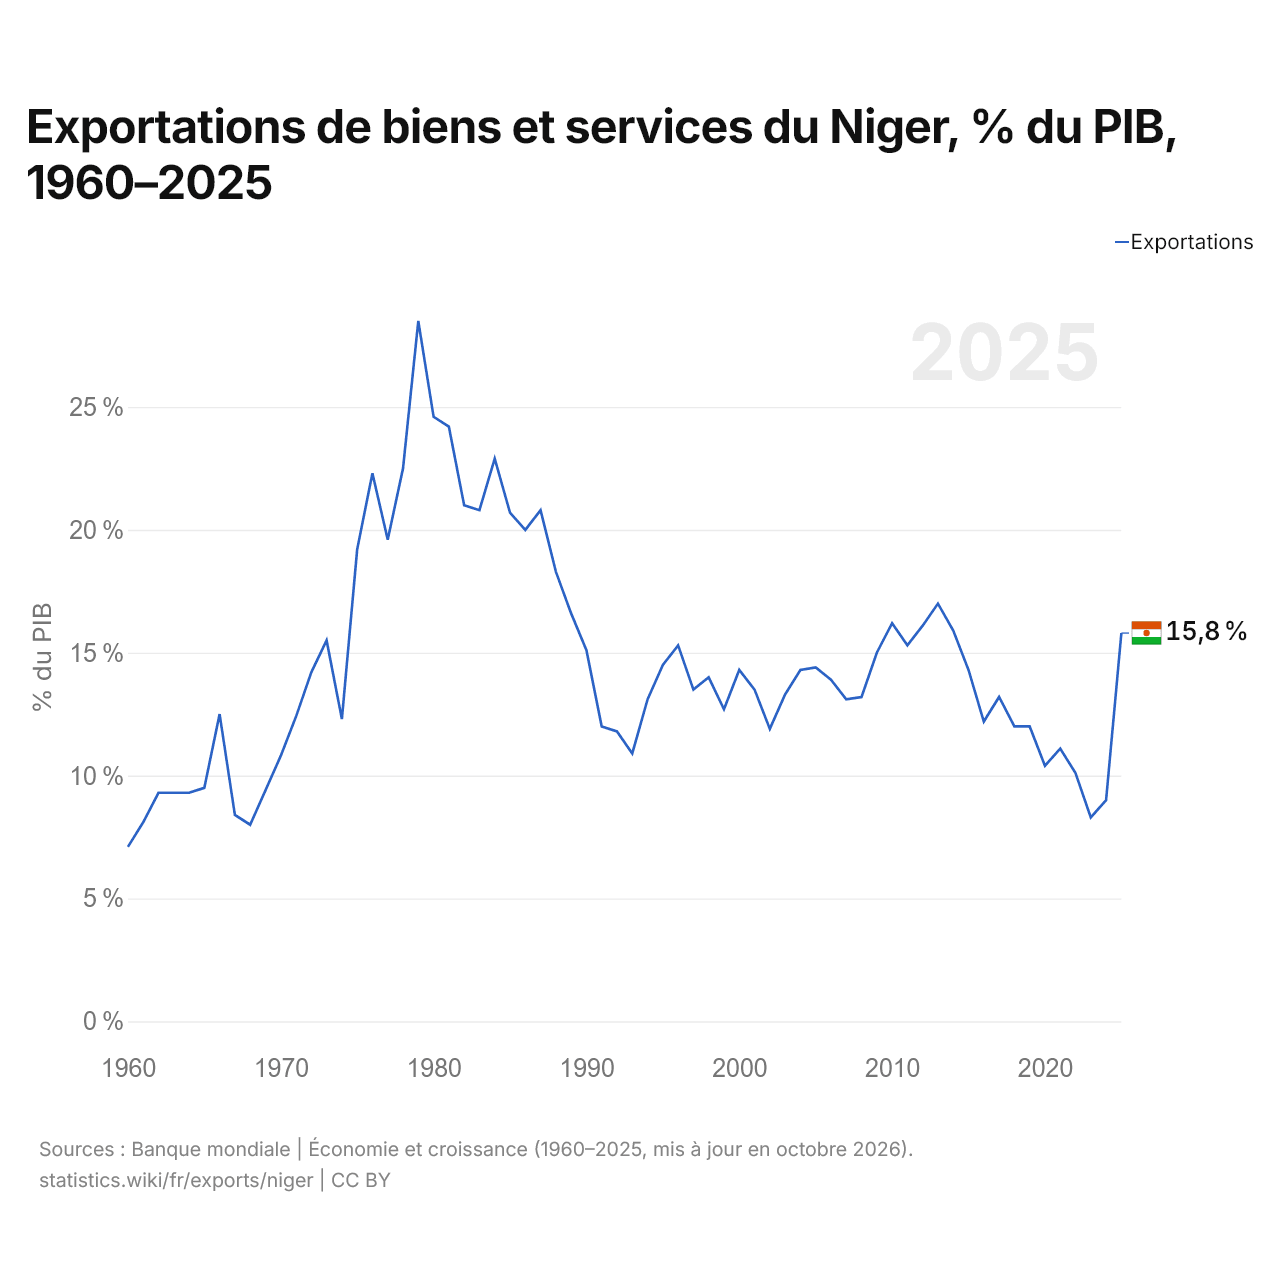
En 2025, les exportations de biens et services du Niger équivalaient à 15,8 % de son PIB, contre 7,1 % en 1960. La part la plus élevée a été de 28,5 %, en 1979.
Comparer les exportations du Niger avec celles d'autres pays
Sources :
- Banque mondiale | Économie et croissance (1960–2025, mis à jour en octobre 2026)
- TradeMap (2001–2025, mis à jour en octobre 2026)
Creative Commons Attribution (CC BY) : vous pouvez copier, partager, adapter et réutiliser ce contenu, y compris à des fins commerciales, à condition de citer statistics.wiki et d’indiquer les modifications apportées. Les sources citées ci-dessus peuvent avoir leurs propres conditions de licence.