
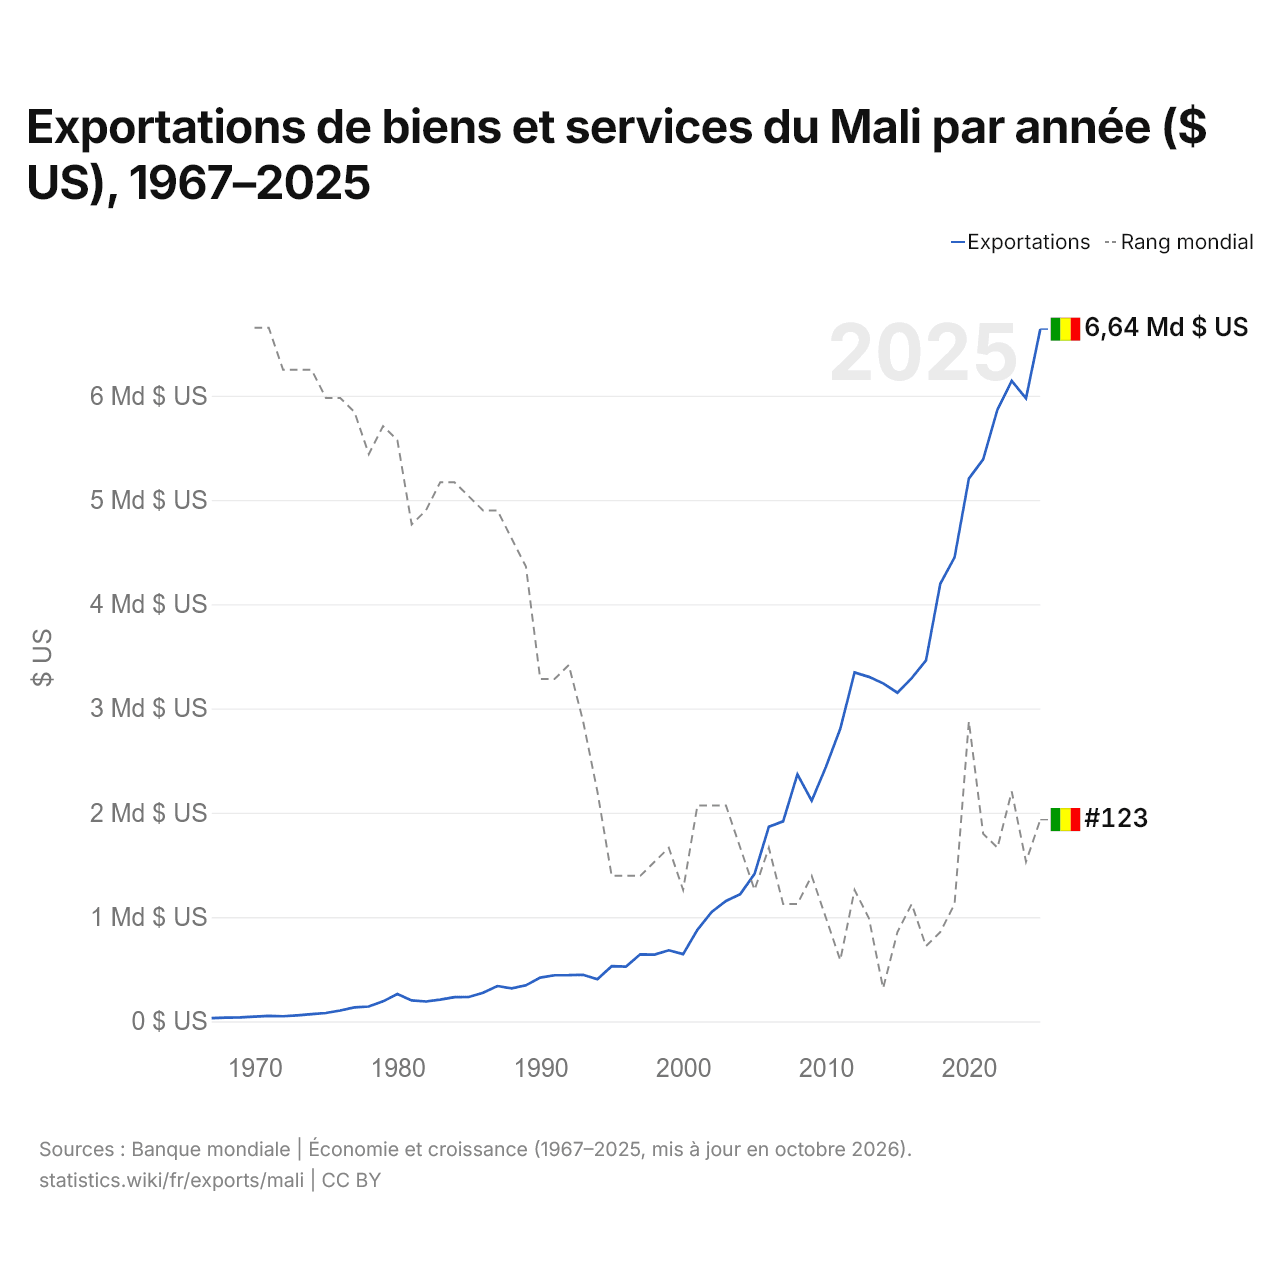
Exportations de biens et services du Mali par année ($ US), 1967–2025
| Année | $ US | Rang mondial |
|---|---|---|
| Exportations | Rang mondial | |
| 2025 | 6 638 297 560 $ US | #123 |
| 2024 | 5 974 568 257 $ US | #126 |
| 2023 | 6 141 554 207 $ US | #121 |
| 2022 | 5 866 178 905 $ US | #125 |
| 2021 | 5 389 820 861 $ US | #124 |
| 2020 | 5 204 085 878 $ US | #116 |
| 2019 | 4 449 175 629 $ US | #129 |
| 2018 | 4 195 619 517 $ US | #131 |
| 2017 | 3 461 471 859 $ US | #132 |
| 2016 | 3 291 642 790 $ US | #129 |
| 2015 | 3 151 534 393 $ US | #131 |
| 2014 | 3 240 763 523 $ US | #135 |
| 2013 | 3 303 494 040 $ US | #130 |
| 2012 | 3 346 608 913 $ US | #128 |
| 2011 | 2 804 916 883 $ US | #133 |
| 2010 | 2 442 195 564 $ US | #130 |
| 2009 | 2 116 109 706 $ US | #127 |
| 2008 | 2 369 022 701 $ US | #129 |
| 2007 | 1 917 811 428 $ US | #129 |
| 2006 | 1 865 640 023 $ US | #125 |
| 2005 | 1 413 791 680 $ US | #128 |
| 2004 | 1 220 024 941 $ US | #125 |
| 2003 | 1 154 685 243 $ US | #122 |
| 2002 | 1 049 462 475 $ US | #122 |
| 2001 | 877 132 747 $ US | #122 |
| 2000 | 644 739 309 $ US | #128 |
| 1999 | 681 012 428 $ US | #125 |
| 1998 | 639 603 127 $ US | #126 |
| 1997 | 642 627 518 $ US | #127 |
| 1996 | 524 706 725 $ US | #127 |
| 1995 | 529 401 649 $ US | #127 |
| 1994 | 403 923 097 $ US | #121 |
| 1993 | 446 775 137 $ US | #116 |
| 1992 | 442 363 532 $ US | #112 |
| 1991 | 441 641 080 $ US | #113 |
| 1990 | 419 775 179 $ US | #113 |
| 1989 | 345 038 046 $ US | #105 |
| 1988 | 316 268 468 $ US | #103 |
| 1987 | 338 394 767 $ US | #101 |
| 1986 | 273 746 416 $ US | #101 |
| 1985 | 233 359 989 $ US | #100 |
| 1984 | 232 746 192 $ US | #99 |
| 1983 | 208 756 469 $ US | #99 |
| 1982 | 190 197 233 $ US | #101 |
| 1981 | 200 381 661 $ US | #102 |
| 1980 | 262 685 142 $ US | #96 |
| 1979 | 191 329 840 $ US | #95 |
| 1978 | 141 808 859 $ US | #97 |
| 1977 | 133 914 204 $ US | #94 |
| 1976 | 103 368 693 $ US | #93 |
| 1975 | 80 256 489 $ US | #93 |
| 1974 | 68 548 732 $ US | #91 |
| 1973 | 57 427 641 $ US | #91 |
| 1972 | 48 804 175 $ US | #91 |
| 1971 | 53 022 180 $ US | #88 |
| 1970 | 44 862 009 $ US | #88 |
| 1969 | 38 082 699 $ US | - |
| 1968 | 35 142 331 $ US | - |
| 1967 | 31 300 692 $ US | - |
En 2025, les exportations de biens et services du Mali s'élevaient à 6,64 milliards de dollars, contre 31,3 millions de dollars en 1967. Elles se classaient au 123e rang mondial, en hausse par rapport au 126e rang en 2024. Leur meilleur rang a été le 88e, occupé pour la dernière fois en 1971.
En 2025, les exportations de biens et services du Mali étaient les 26es plus élevées de 50 pays situés en Afrique. Les importations de biens et services du Mali s'élevaient à 8,03 milliards de dollars en 2025, au 125e rang mondial. En 2025, les importations du Mali dépassaient ses exportations de 1,39 milliard de dollars, soit un déficit commercial.
Exportations de biens du Mali par catégorie
Exportations de biens, 2024: 3,61 Md $US
La première catégorie des exportations de biens du Mali est « métaux précieux, pierres précieuses, bijoux, montres, instruments de musique et art », avec 73,1 %, suivie de « textiles, vêtements, chaussures, meubles et jouets », avec 9,3 %.
Destinations des exportations de biens du Mali : les 10 premières
| Rang | Pays | Exportations de biens | Part | |
|---|---|---|---|---|
| 1 |
 Afrique du Sud |
2,03 Md $US | 56,2 % | |
| 2 |
 Australie |
419 M $US | 11,6 % | |
| 3 |
 Côte d’Ivoire |
178 M $US | 4,92 % | vs Côte d’Ivoire |
| 4 |
 Bangladesh |
159 M $US | 4,41 % | |
| 5 |
 Inde |
156 M $US | 4,33 % | |
| 6 |
 Sénégal |
129 M $US | 3,57 % | vs Sénégal |
| 7 |
 Suisse |
118 M $US | 3,26 % | |
| 8 |
 EAU |
85,8 M $US | 2,37 % | |
| 9 |
 Guinée |
47,5 M $US | 1,31 % | vs Guinée |
| 10 |
 Burkina Faso |
44,4 M $US | 1,23 % | vs Burkina Faso |
| Autres partenaires et non précisés | 245 M $US | 6,77 % |
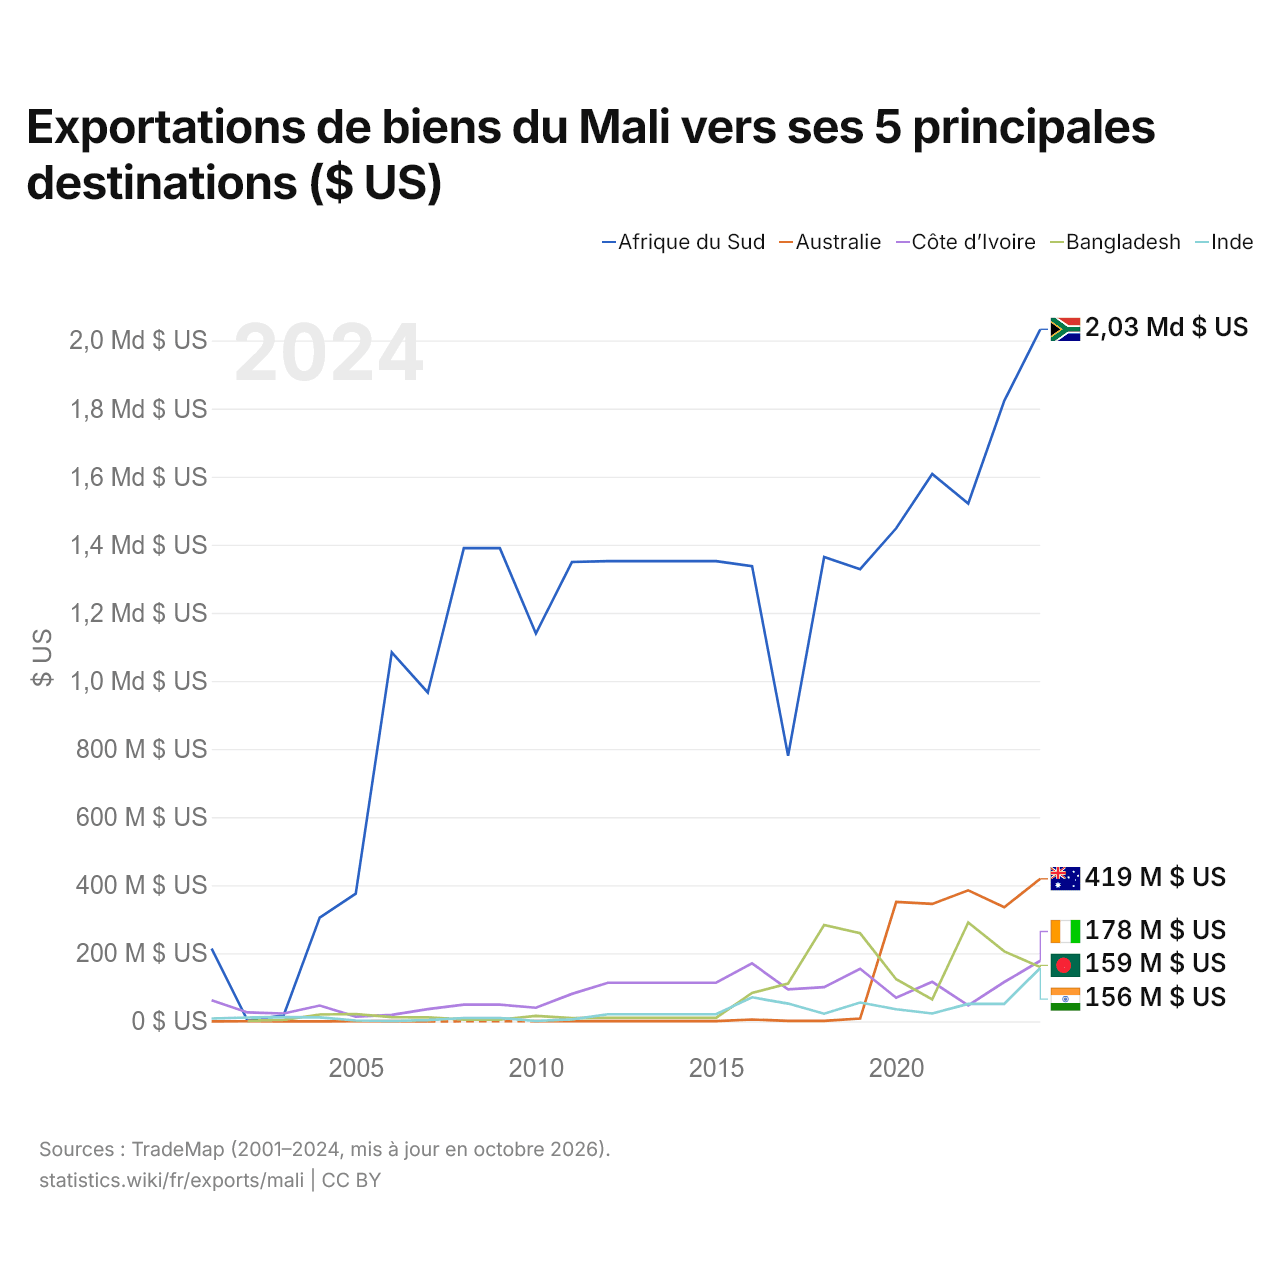
Exportations de biens du Mali vers ses 5 principales destinations ($ US)
| Année | $ US | ||||
|---|---|---|---|---|---|
| Afrique du Sud | Australie | Côte d’Ivoire | Bangladesh | Inde | |
| 2024 | 2 032 935 000 $ US | 418 667 000 $ US | 177 963 000 $ US | 159 231 000 $ US | 156 439 000 $ US |
| 2023 | 1 822 529 000 $ US | 334 946 000 $ US | 115 489 000 $ US | 205 453 000 $ US | 51 415 000 $ US |
| 2022 | 1 521 158 000 $ US | 384 758 000 $ US | 47 068 000 $ US | 290 524 000 $ US | 51 091 000 $ US |
| 2021 | 1 608 012 000 $ US | 344 823 000 $ US | 116 171 000 $ US | 64 628 000 $ US | 22 998 000 $ US |
| 2020 | 1 448 319 000 $ US | 350 562 000 $ US | 69 252 000 $ US | 123 683 000 $ US | 35 529 000 $ US |
| 2019 | 1 328 070 000 $ US | 8 446 000 $ US | 154 399 000 $ US | 258 545 000 $ US | 55 244 000 $ US |
| 2018 | 1 364 040 000 $ US | 1 129 000 $ US | 100 457 000 $ US | 283 146 000 $ US | 22 313 000 $ US |
| 2017 | 780 215 000 $ US | 1 285 000 $ US | 93 860 000 $ US | 111 206 000 $ US | 52 159 000 $ US |
| 2016 | 1 337 309 000 $ US | 5 326 000 $ US | 170 286 000 $ US | 83 312 000 $ US | 70 595 000 $ US |
| 2015 | 1 351 834 000 $ US | 732 000 $ US | 113 370 000 $ US | 10 195 000 $ US | 20 753 000 $ US |
| 2014 | 1 351 834 000 $ US | 732 000 $ US | 113 370 000 $ US | 10 195 000 $ US | 20 753 000 $ US |
| 2013 | 1 351 834 000 $ US | 732 000 $ US | 113 370 000 $ US | 10 195 000 $ US | 20 753 000 $ US |
| 2012 | 1 351 834 000 $ US | 732 000 $ US | 113 370 000 $ US | 10 195 000 $ US | 20 753 000 $ US |
| 2011 | 1 349 260 000 $ US | 147 000 $ US | 80 616 000 $ US | 9 450 000 $ US | 5 774 000 $ US |
| 2010 | 1 139 153 000 $ US | 430 000 $ US | 39 880 000 $ US | 16 092 000 $ US | 943 000 $ US |
| 2009 | 1 390 108 000 $ US | - | 49 140 000 $ US | 5 240 000 $ US | 9 899 000 $ US |
| 2008 | 1 390 108 000 $ US | - | 49 140 000 $ US | 5 240 000 $ US | 9 899 000 $ US |
| 2007 | 965 983 000 $ US | 3 000 $ US | 35 978 000 $ US | 11 830 000 $ US | 3 526 000 $ US |
| 2006 | 1 083 956 000 $ US | 717 000 $ US | 18 843 000 $ US | 12 446 000 $ US | 1 063 000 $ US |
| 2005 | 375 003 000 $ US | 298 000 $ US | 13 973 000 $ US | 21 449 000 $ US | 2 388 000 $ US |
| 2004 | 304 667 000 $ US | 7 000 $ US | 46 426 000 $ US | 20 184 000 $ US | 11 700 000 $ US |
| 2003 | 17 732 000 $ US | 5 000 $ US | 22 903 000 $ US | 4 310 000 $ US | 12 520 000 $ US |
| 2002 | 1 804 000 $ US | 176 000 $ US | 26 224 000 $ US | 1 392 000 $ US | 11 368 000 $ US |
| 2001 | 213 636 000 $ US | 72 000 $ US | 61 786 000 $ US | - | 8 209 000 $ US |
Les exportations de biens s'élèvent à 2,03 milliards de dollars vers l'Afrique du Sud (2024), 419 millions de dollars vers l'Australie (2024), 178 millions de dollars vers la Côte d’Ivoire (2024), 159 millions de dollars vers le Bangladesh (2024) et 156 millions de dollars vers l'Inde (2024). Le premier rang des cinq destinations du Mali est occupé par l'Afrique du Sud depuis 2004. Le changement le plus récent dans leur ordre remonte à 2024, quand les exportations du Mali vers la Côte d’Ivoire ont dépassé celles vers le Bangladesh.
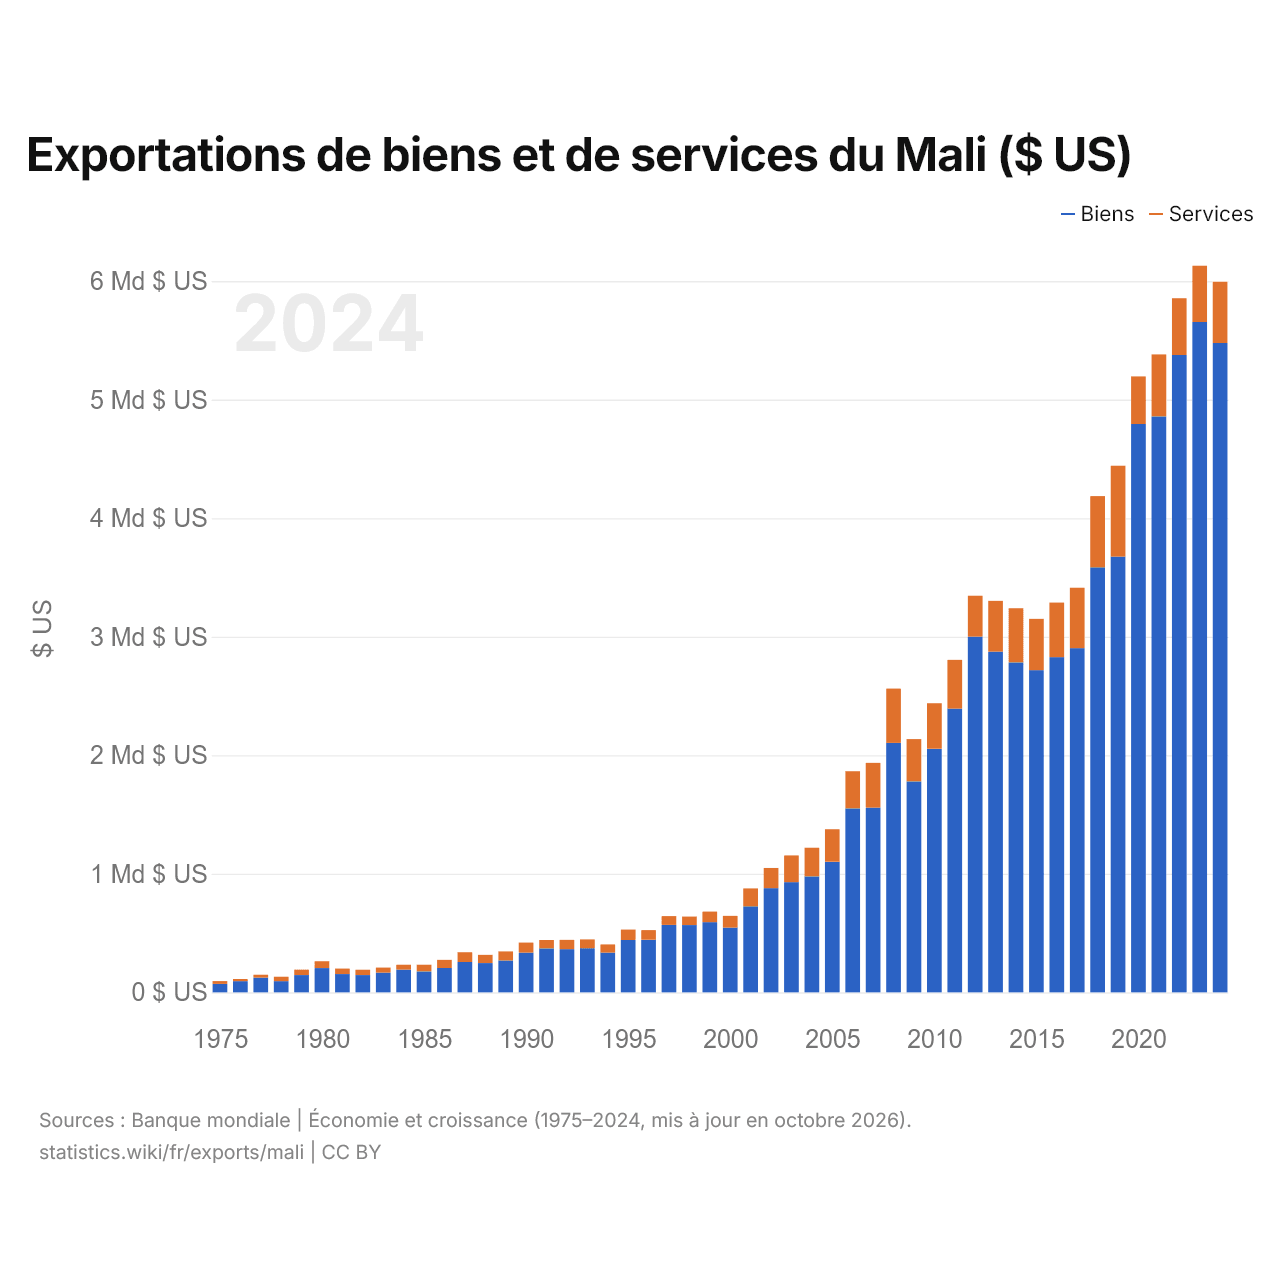
Exportations de biens et de services du Mali ($ US)
| Année | $ US | |
|---|---|---|
| Biens | Services | |
| 2024 | 5 477 651 122 $ US | 516 357 596 $ US |
| 2023 | 5 654 906 100 $ US | 474 869 395 $ US |
| 2022 | 5 376 433 946 $ US | 478 624 203 $ US |
| 2021 | 4 857 868 683 $ US | 523 148 805 $ US |
| 2020 | 4 794 043 320 $ US | 401 503 213 $ US |
| 2019 | 3 675 281 453 $ US | 766 679 427 $ US |
| 2018 | 3 585 281 659 $ US | 600 949 749 $ US |
| 2017 | 2 903 428 336 $ US | 509 925 477 $ US |
| 2016 | 2 827 967 889 $ US | 459 963 748 $ US |
| 2015 | 2 717 798 728 $ US | 433 072 131 $ US |
| 2014 | 2 783 096 628 $ US | 456 985 621 $ US |
| 2013 | 2 874 116 180 $ US | 428 682 246 $ US |
| 2012 | 3 000 961 529 $ US | 344 942 089 $ US |
| 2011 | 2 392 908 835 $ US | 411 417 645 $ US |
| 2010 | 2 054 591 327 $ US | 384 078 827 $ US |
| 2009 | 1 779 357 224 $ US | 357 223 792 $ US |
| 2008 | 2 104 147 787 $ US | 457 623 276 $ US |
| 2007 | 1 557 746 501 $ US | 377 679 200 $ US |
| 2006 | 1 551 627 565 $ US | 313 633 161 $ US |
| 2005 | 1 101 300 693 $ US | 274 419 545 $ US |
| 2004 | 978 186 606 $ US | 241 581 286 $ US |
| 2003 | 929 773 052 $ US | 224 912 190 $ US |
| 2002 | 879 245 165 $ US | 170 217 311 $ US |
| 2001 | 725 755 972 $ US | 151 376 774 $ US |
| 2000 | 545 450 083 $ US | 99 289 226 $ US |
| 1999 | 591 346 482 $ US | 89 665 946 $ US |
| 1998 | 567 351 459 $ US | 72 251 668 $ US |
| 1997 | 569 342 878 $ US | 73 284 640 $ US |
| 1996 | 443 643 675 $ US | 81 063 050 $ US |
| 1995 | 441 832 506 $ US | 87 569 143 $ US |
| 1994 | 334 921 519 $ US | 69 001 578 $ US |
| 1993 | 371 941 802 $ US | 74 833 334 $ US |
| 1992 | 364 046 033 $ US | 78 317 500 $ US |
| 1991 | 370 604 181 $ US | 71 036 899 $ US |
| 1990 | 334 894 573 $ US | 84 880 605 $ US |
| 1989 | 268 488 312 $ US | 76 549 733 $ US |
| 1988 | 247 105 725 $ US | 69 162 744 $ US |
| 1987 | 255 875 689 $ US | 82 519 078 $ US |
| 1986 | 205 598 574 $ US | 68 147 842 $ US |
| 1985 | 176 066 150 $ US | 57 293 839 $ US |
| 1984 | 192 009 887 $ US | 40 736 305 $ US |
| 1983 | 166 768 995 $ US | 41 987 473 $ US |
| 1982 | 145 767 159 $ US | 44 430 074 $ US |
| 1981 | 154 196 357 $ US | 46 185 305 $ US |
| 1980 | 204 941 741 $ US | 57 743 401 $ US |
| 1979 | 145 730 352 $ US | 45 599 497 $ US |
| 1978 | 94 169 945 $ US | 37 224 825 $ US |
| 1977 | 124 593 125 $ US | 23 892 899 $ US |
| 1976 | 94 371 012 $ US | 17 848 885 $ US |
| 1975 | 71 857 550 $ US | 22 887 096 $ US |
Les exportations de biens du Mali s'élèvent à 5,48 milliards de dollars (2024) et celles de services à 516 millions de dollars ; les services représentent 8,6 % du total, contre 24,2 % en 1975.
Le Mali dans le classement mondial des exportations, 2025







Exportations de biens et services du Mali, % du PIB, 1967–2025
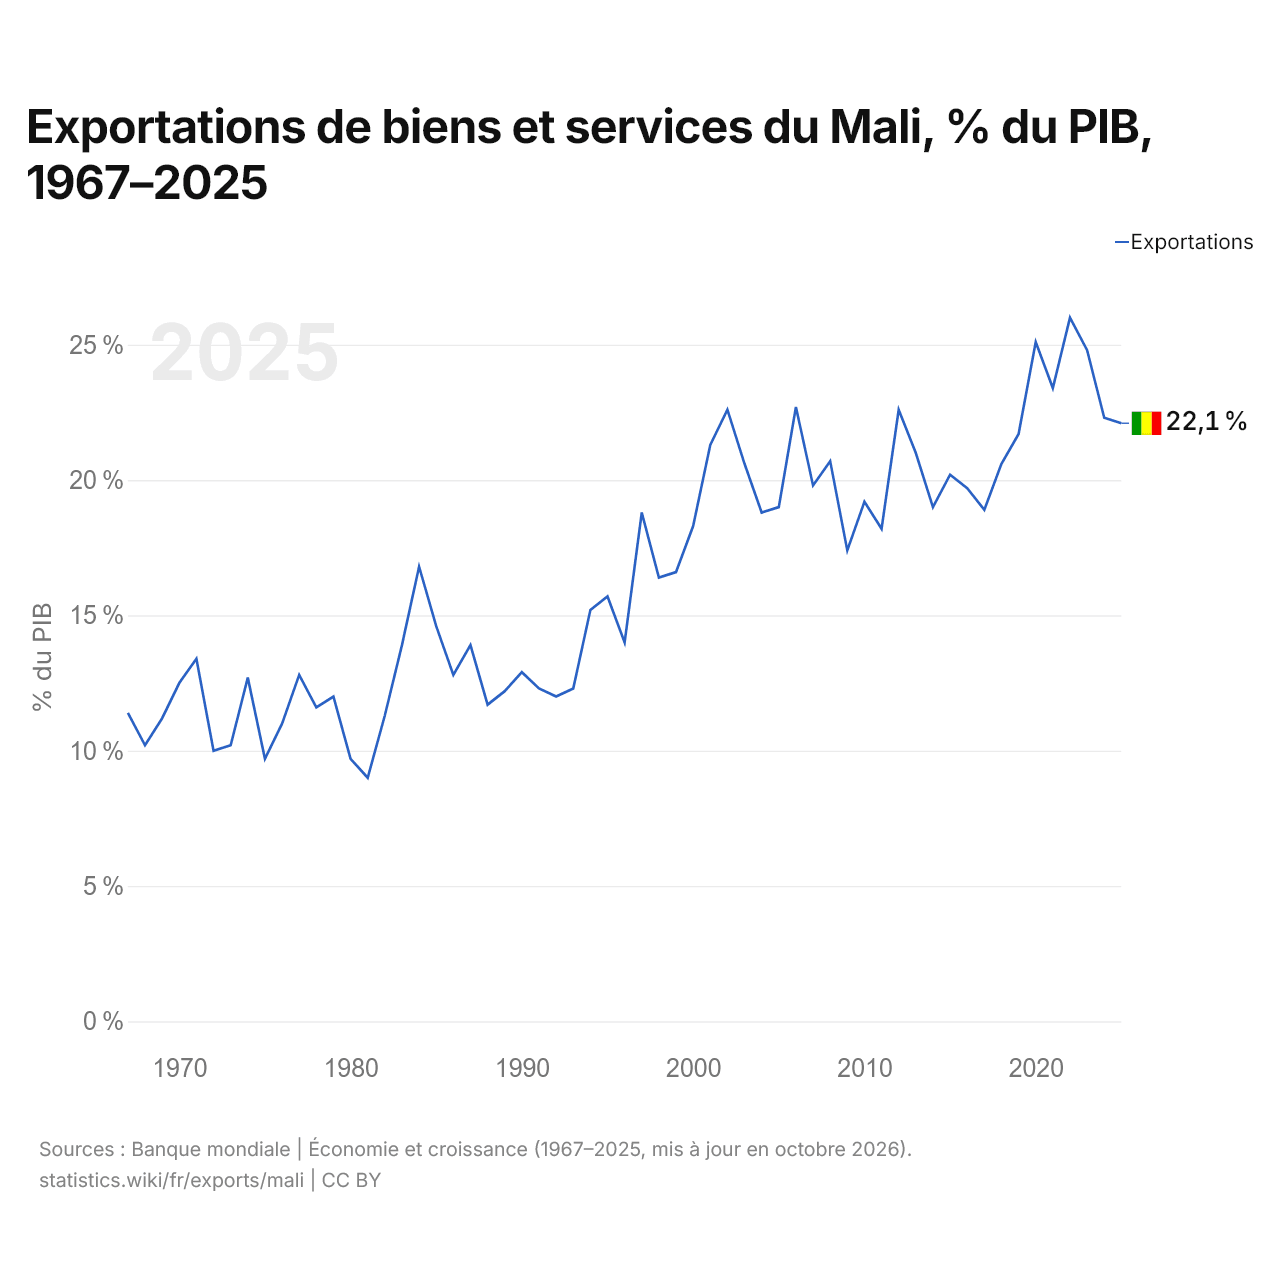
En 2025, les exportations de biens et services du Mali équivalaient à 22,1 % de son PIB, contre 11,4 % en 1967. La part la plus élevée a été de 26,0 %, en 2022.
Comparer les exportations du Mali avec celles d'autres pays
Sources :
- Banque mondiale | Économie et croissance (1967–2025, mis à jour en octobre 2026)
- TradeMap (2001–2024, mis à jour en octobre 2026)
Creative Commons Attribution (CC BY) : vous pouvez copier, partager, adapter et réutiliser ce contenu, y compris à des fins commerciales, à condition de citer statistics.wiki et d’indiquer les modifications apportées. Les sources citées ci-dessus peuvent avoir leurs propres conditions de licence.