
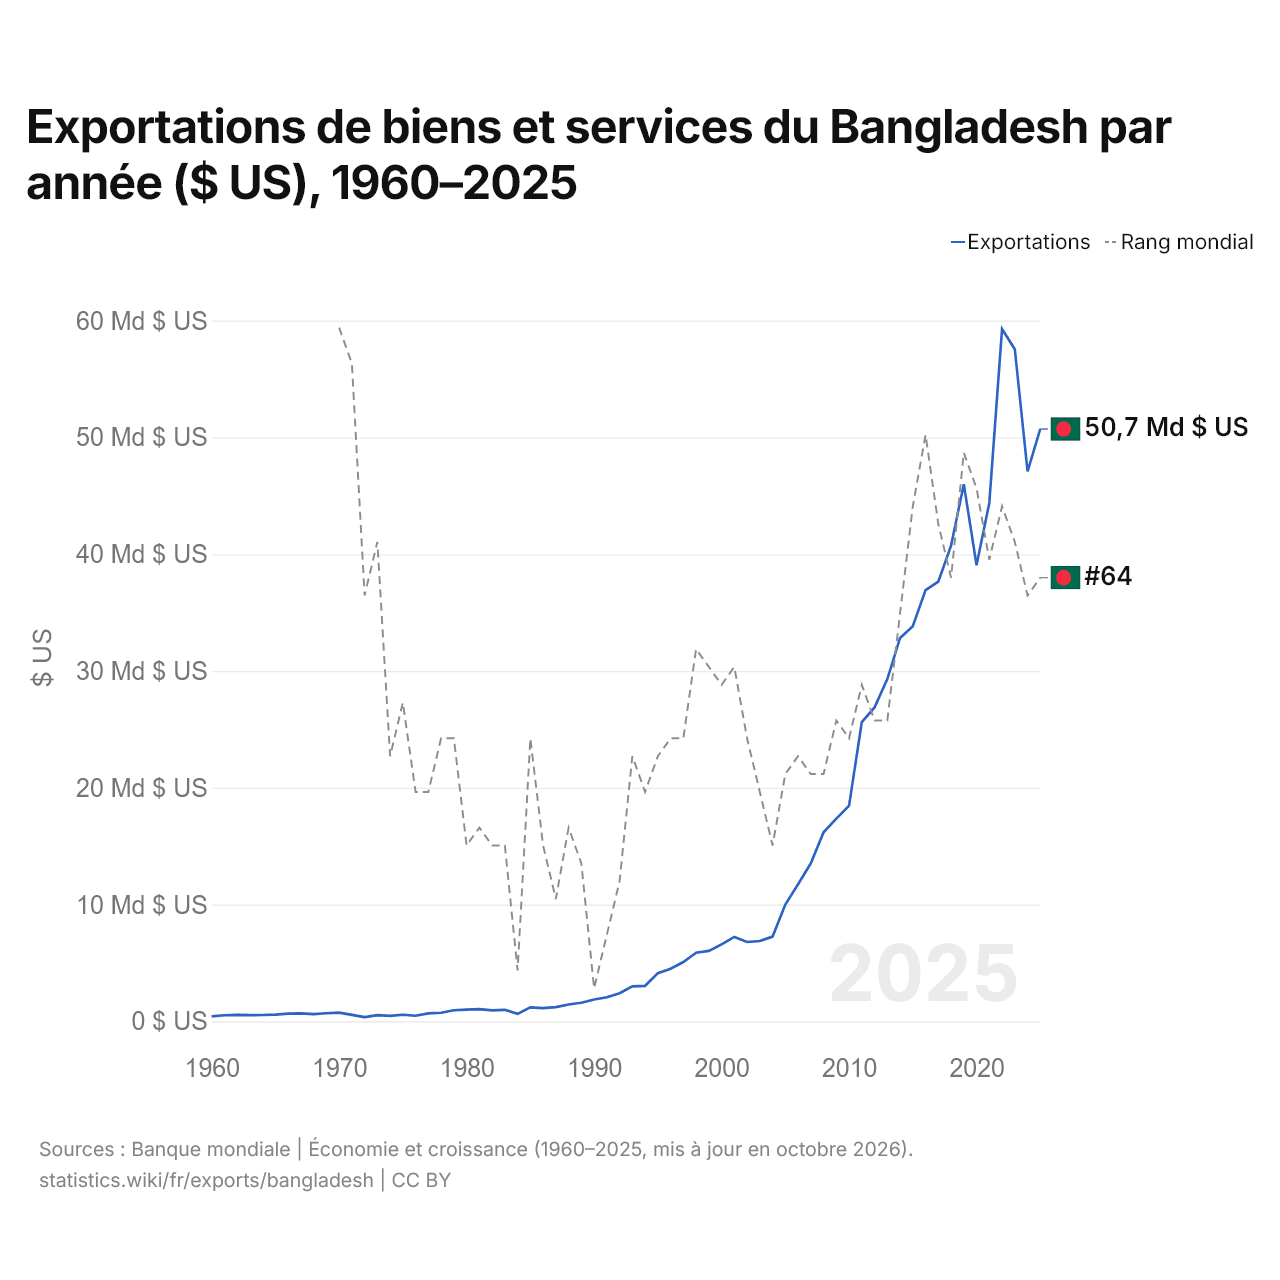
Exportations de biens et services du Bangladesh par année ($ US), 1960–2025
| Année | $ US | Rang mondial |
|---|---|---|
| Exportations | Rang mondial | |
| 2025 | 50 724 940 945 $ US | #64 |
| 2024 | 47 087 839 244 $ US | #65 |
| 2023 | 57 551 452 001 $ US | #62 |
| 2022 | 59 275 206 086 $ US | #60 |
| 2021 | 44 386 125 442 $ US | #63 |
| 2020 | 39 053 880 560 $ US | #59 |
| 2019 | 45 992 932 855 $ US | #57 |
| 2018 | 40 732 047 404 $ US | #64 |
| 2017 | 37 655 756 193 $ US | #61 |
| 2016 | 36 922 447 162 $ US | #56 |
| 2015 | 33 831 931 004 $ US | #60 |
| 2014 | 32 830 579 730 $ US | #66 |
| 2013 | 29 306 607 470 $ US | #72 |
| 2012 | 26 877 564 843 $ US | #72 |
| 2011 | 25 621 279 024 $ US | #70 |
| 2010 | 18 471 882 437 $ US | #73 |
| 2009 | 17 359 427 993 $ US | #72 |
| 2008 | 16 182 047 683 $ US | #75 |
| 2007 | 13 530 265 640 $ US | #75 |
| 2006 | 11 741 089 556 $ US | #74 |
| 2005 | 9 999 571 015 $ US | #75 |
| 2004 | 7 257 329 710 $ US | #79 |
| 2003 | 6 876 856 649 $ US | #76 |
| 2002 | 6 791 241 511 $ US | #73 |
| 2001 | 7 227 575 982 $ US | #69 |
| 2000 | 6 588 073 942 $ US | #70 |
| 1999 | 6 028 722 962 $ US | #69 |
| 1998 | 5 876 850 220 $ US | #68 |
| 1997 | 5 075 480 094 $ US | #73 |
| 1996 | 4 507 555 012 $ US | #73 |
| 1995 | 4 122 014 925 $ US | #74 |
| 1994 | 3 039 700 748 $ US | #76 |
| 1993 | 2 990 714 286 $ US | #74 |
| 1992 | 2 405 649 867 $ US | #81 |
| 1991 | 2 062 577 031 $ US | #84 |
| 1990 | 1 866 929 978 $ US | #87 |
| 1989 | 1 594 548 386 $ US | #80 |
| 1988 | 1 442 788 415 $ US | #78 |
| 1987 | 1 212 483 871 $ US | #82 |
| 1986 | 1 128 533 333 $ US | #79 |
| 1985 | 1 199 576 923 $ US | #73 |
| 1984 | 642 600 000 $ US | #86 |
| 1983 | 986 784 512 $ US | #79 |
| 1982 | 940 219 561 $ US | #79 |
| 1981 | 1 038 984 088 $ US | #78 |
| 1980 | 996 555 891 $ US | #79 |
| 1979 | 950 929 356 $ US | #73 |
| 1978 | 738 155 880 $ US | #73 |
| 1977 | 679 513 484 $ US | #76 |
| 1976 | 480 166 471 $ US | #76 |
| 1975 | 563 045 020 $ US | #71 |
| 1974 | 463 095 606 $ US | #74 |
| 1973 | 528 824 097 $ US | #62 |
| 1972 | 356 841 000 $ US | #65 |
| 1971 | 550 621 104 $ US | #52 |
| 1970 | 747 575 146 $ US | #50 |
| 1969 | 690 047 542 $ US | - |
| 1968 | 623 451 562 $ US | - |
| 1967 | 675 028 063 $ US | - |
| 1966 | 662 275 583 $ US | - |
| 1965 | 570 741 563 $ US | - |
| 1964 | 540 135 792 $ US | - |
| 1963 | 531 067 354 $ US | - |
| 1962 | 546 086 875 $ US | - |
| 1961 | 519 448 542 $ US | - |
| 1960 | 427 347 708 $ US | - |
En 2025, les exportations de biens et services du Bangladesh s'élevaient à 50,7 milliards de dollars, contre 427 millions de dollars en 1960. Le maximum a été de 59,3 milliards de dollars, en 2022. Elles se classaient au 64e rang mondial, en hausse par rapport au 65e rang en 2024. Leur meilleur rang a été le 50e, occupé pour la dernière fois en 1970.
En 2025, les exportations de biens et services du Bangladesh étaient les 22es plus élevées de 44 pays situés en Asie. Les importations de biens et services du Bangladesh s'élevaient à 76,8 milliards de dollars en 2025, au 54e rang mondial. En 2025, les importations du Bangladesh dépassaient ses exportations de 26,1 milliards de dollars, soit un déficit commercial.
Exportations de biens du Bangladesh par catégorie
Exportations de biens, 2018: 40,1 Md $US
La première catégorie des exportations de biens du Bangladesh est « textiles, vêtements, chaussures, meubles et jouets », avec 91,2 %, suivie de « machines, électronique et véhicules », avec 2,1 %.
Destinations des exportations de biens du Bangladesh : les 10 premières
| Rang | Pays | Exportations de biens | Part | |
|---|---|---|---|---|
| 1 |
 États-Unis |
6,54 Md $US | 16,3 % | |
| 2 |
 Allemagne |
6,23 Md $US | 15,5 % | |
| 3 |
 Royaume-Uni |
4,05 Md $US | 10,1 % | |
| 4 |
 Espagne |
2,55 Md $US | 6,36 % | |
| 5 |
 France |
2,13 Md $US | 5,32 % | vs France |
| 6 |
 Italie |
1,61 Md $US | 4,03 % | |
| 7 |
 Japon |
1,37 Md $US | 3,42 % | |
| 8 |
 Pays-Bas |
1,26 Md $US | 3,14 % | |
| 9 |
 Inde |
1,23 Md $US | 3,07 % | vs Inde |
| 10 |
 Canada |
1,22 Md $US | 3,04 % | vs Canada |
| Autres partenaires et non précisés | 11,9 Md $US | 29,6 % |
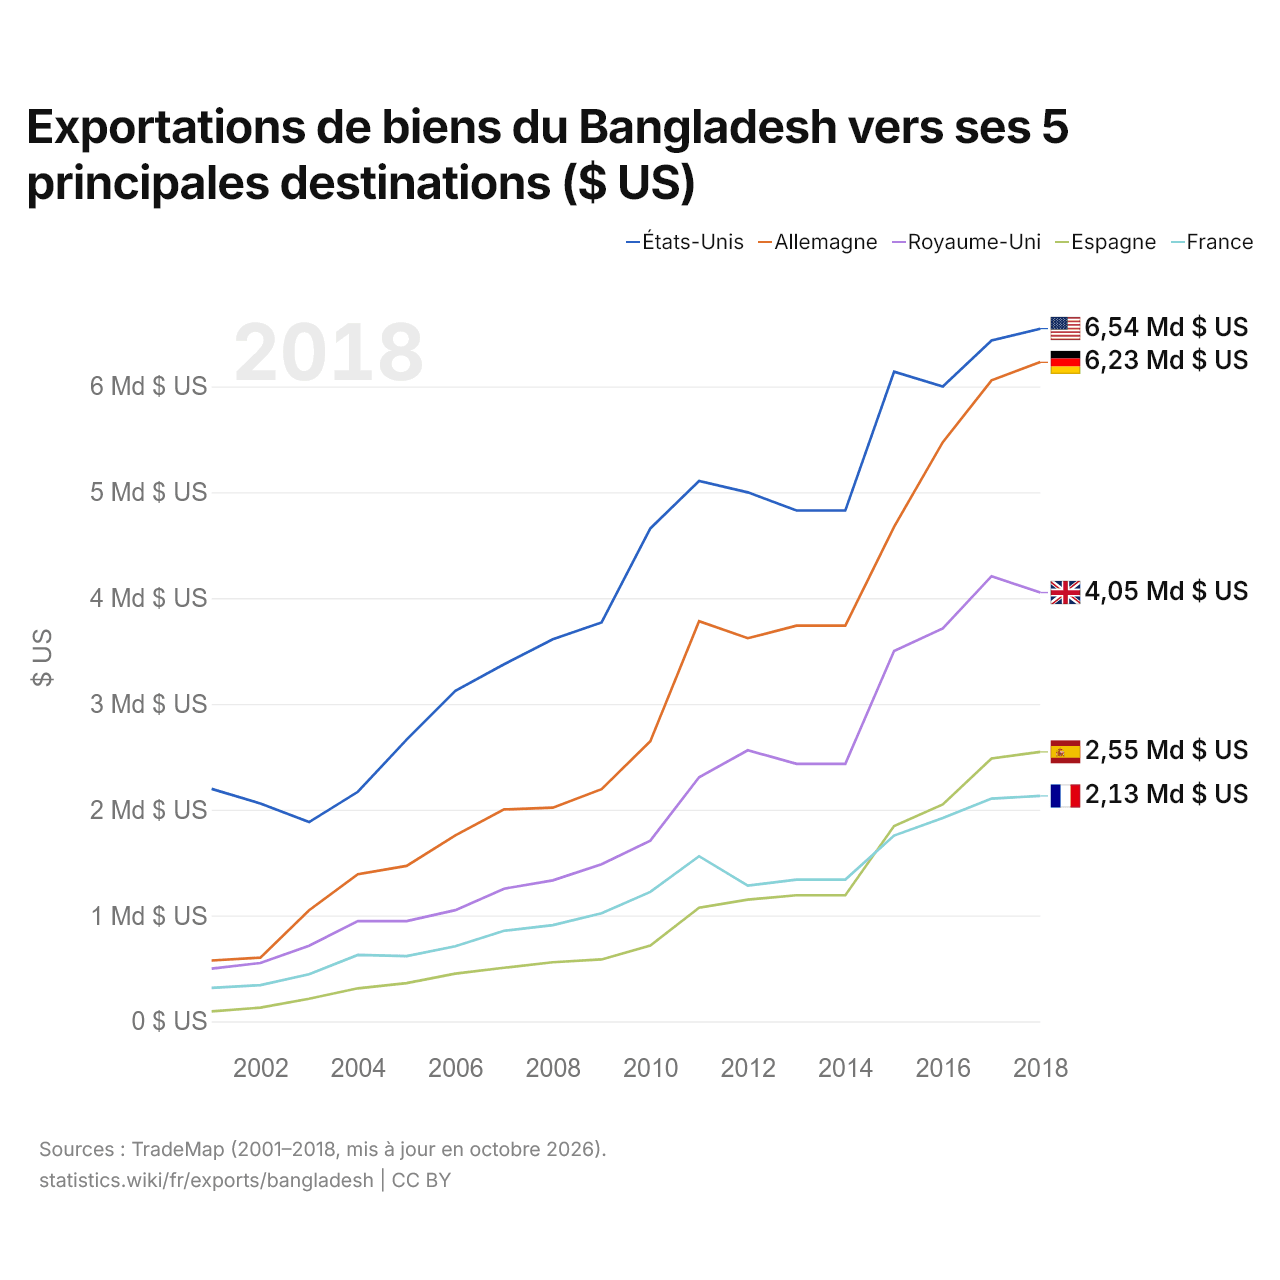
Exportations de biens du Bangladesh vers ses 5 principales destinations ($ US)
| Année | $ US | ||||
|---|---|---|---|---|---|
| États-Unis | Allemagne | Royaume-Uni | Espagne | France | |
| 2018 | 6 544 540 000 $ US | 6 229 689 000 $ US | 4 052 399 000 $ US | 2 546 306 000 $ US | 2 129 923 000 $ US |
| 2017 | 6 433 273 000 $ US | 6 057 612 000 $ US | 4 206 916 000 $ US | 2 484 062 000 $ US | 2 104 726 000 $ US |
| 2016 | 5 998 684 000 $ US | 5 472 994 000 $ US | 3 712 239 000 $ US | 2 049 632 000 $ US | 1 921 653 000 $ US |
| 2015 | 6 139 352 000 $ US | 4 673 196 000 $ US | 3 499 880 000 $ US | 1 845 435 000 $ US | 1 755 411 000 $ US |
| 2014 | 4 827 754 000 $ US | 3 738 953 000 $ US | 2 432 741 000 $ US | 1 191 446 000 $ US | 1 339 545 000 $ US |
| 2013 | 4 827 754 000 $ US | 3 738 953 000 $ US | 2 432 741 000 $ US | 1 191 446 000 $ US | 1 339 545 000 $ US |
| 2012 | 4 999 130 000 $ US | 3 620 296 000 $ US | 2 561 657 000 $ US | 1 150 672 000 $ US | 1 282 472 000 $ US |
| 2011 | 5 106 780 000 $ US | 3 781 865 000 $ US | 2 306 383 000 $ US | 1 072 977 000 $ US | 1 560 386 000 $ US |
| 2010 | 4 657 985 000 $ US | 2 647 153 000 $ US | 1 707 025 000 $ US | 716 628 000 $ US | 1 223 391 000 $ US |
| 2009 | 3 769 580 000 $ US | 2 194 220 000 $ US | 1 483 687 000 $ US | 584 901 000 $ US | 1 020 875 000 $ US |
| 2008 | 3 610 291 000 $ US | 2 019 000 000 $ US | 1 332 145 000 $ US | 558 660 000 $ US | 908 740 000 $ US |
| 2007 | 3 374 525 000 $ US | 2 002 495 000 $ US | 1 253 504 000 $ US | 506 166 000 $ US | 855 729 000 $ US |
| 2006 | 3 123 244 000 $ US | 1 758 079 000 $ US | 1 050 582 000 $ US | 451 361 000 $ US | 708 841 000 $ US |
| 2005 | 2 662 019 000 $ US | 1 469 052 000 $ US | 946 504 000 $ US | 361 416 000 $ US | 615 816 000 $ US |
| 2004 | 2 169 308 000 $ US | 1 390 360 000 $ US | 947 365 000 $ US | 312 040 000 $ US | 627 224 000 $ US |
| 2003 | 1 883 191 000 $ US | 1 049 604 000 $ US | 713 591 000 $ US | 212 846 000 $ US | 444 182 000 $ US |
| 2002 | 2 058 805 000 $ US | 602 018 000 $ US | 551 261 000 $ US | 129 221 000 $ US | 342 235 000 $ US |
| 2001 | 2 196 555 000 $ US | 574 547 000 $ US | 498 247 000 $ US | 94 300 000 $ US | 316 213 000 $ US |
Les exportations de biens s'élèvent à 6,54 milliards de dollars vers les États-Unis (2018), 6,23 milliards de dollars vers l'Allemagne (2018), 4,05 milliards de dollars vers le Royaume-Uni (2018), 2,55 milliards de dollars vers l'Espagne (2018) et 2,13 milliards de dollars vers la France (2018). Le premier rang des cinq destinations du Bangladesh est occupé par les États-Unis chaque année depuis 2001. Le changement le plus récent dans leur ordre remonte à 2015, quand les exportations du Bangladesh vers l'Espagne ont dépassé celles vers la France.
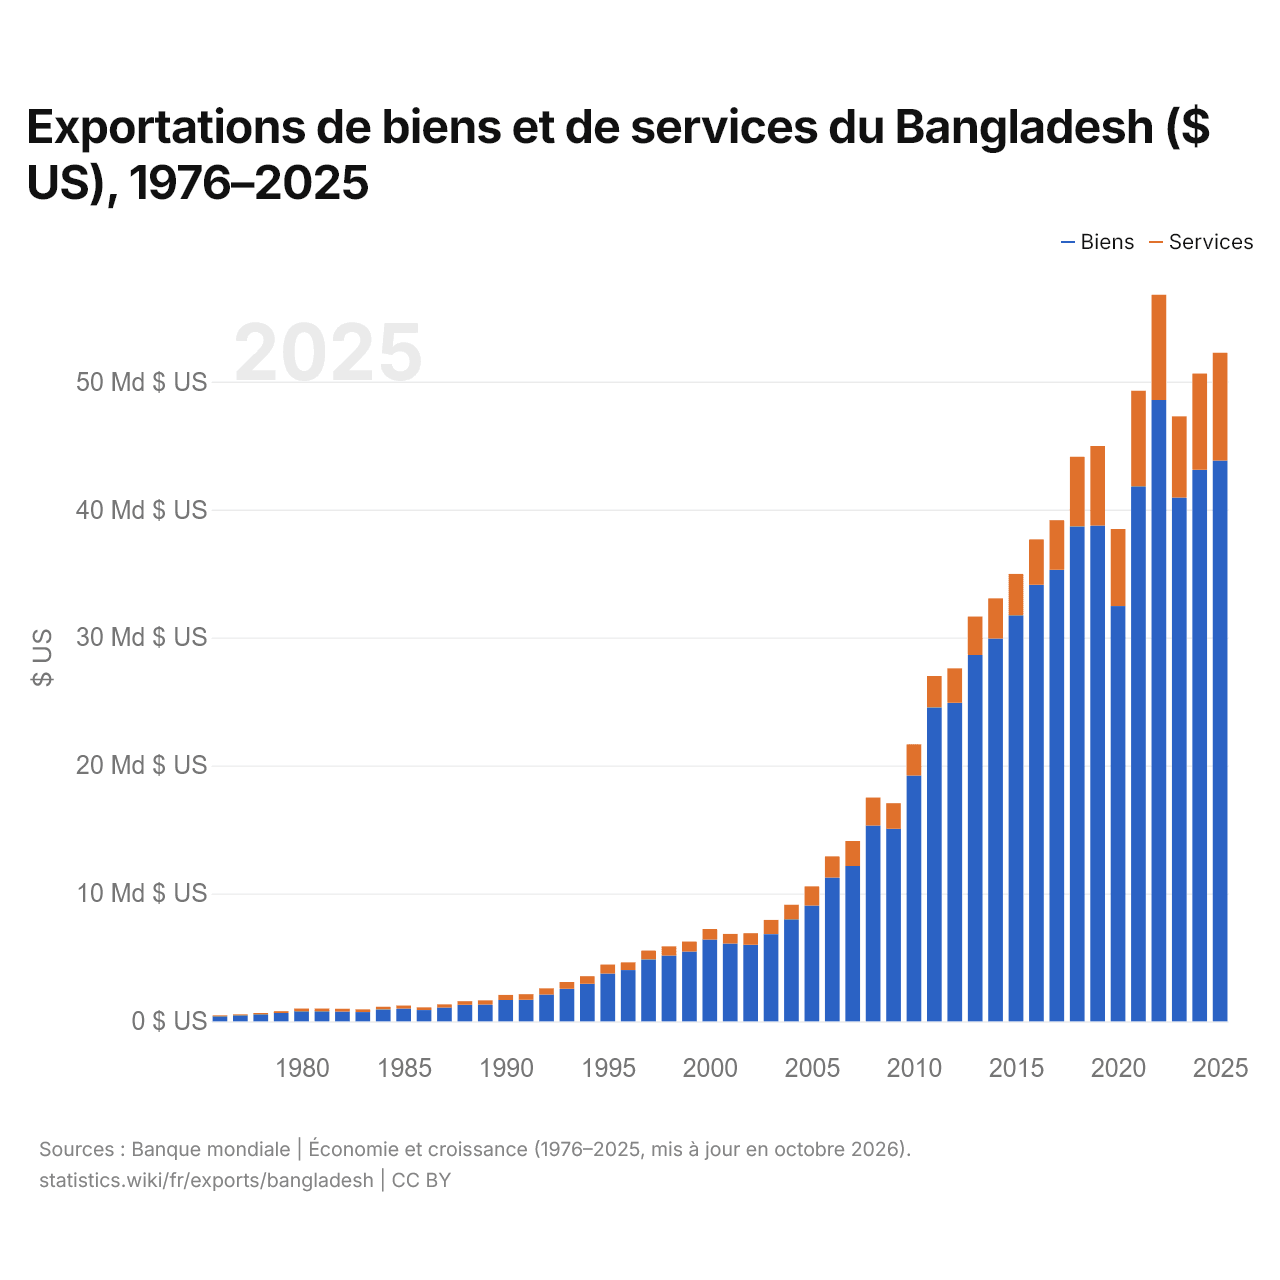
Exportations de biens et de services du Bangladesh ($ US), 1976–2025
| Année | $ US | |
|---|---|---|
| Biens | Services | |
| 2025 | 43 825 264 975 $ US | 8 424 862 919 $ US |
| 2024 | 43 116 111 627 $ US | 7 517 097 895 $ US |
| 2023 | 40 931 164 437 $ US | 6 355 392 803 $ US |
| 2022 | 48 560 352 934 $ US | 8 234 092 677 $ US |
| 2021 | 41 815 967 657 $ US | 7 474 532 386 $ US |
| 2020 | 32 456 147 197 $ US | 6 019 825 463 $ US |
| 2019 | 38 747 293 729 $ US | 6 213 746 401 $ US |
| 2018 | 38 681 904 956 $ US | 5 446 134 026 $ US |
| 2017 | 35 300 765 073 $ US | 3 869 669 932 $ US |
| 2016 | 34 122 050 870 $ US | 3 540 624 812 $ US |
| 2015 | 31 736 035 719 $ US | 3 233 220 375 $ US |
| 2014 | 29 924 488 670 $ US | 3 132 746 364 $ US |
| 2013 | 28 638 191 700 $ US | 2 997 008 179 $ US |
| 2012 | 24 904 204 338 $ US | 2 686 850 391 $ US |
| 2011 | 24 537 200 415 $ US | 2 452 886 215 $ US |
| 2010 | 19 209 407 428 $ US | 2 445 056 547 $ US |
| 2009 | 15 051 721 757 $ US | 1 995 733 631 $ US |
| 2008 | 15 298 332 386 $ US | 2 196 741 916 $ US |
| 2007 | 12 137 743 126 $ US | 1 952 599 359 $ US |
| 2006 | 11 233 798 031 $ US | 1 653 727 737 $ US |
| 2005 | 9 054 546 740 $ US | 1 496 927 265 $ US |
| 2004 | 7 977 826 434 $ US | 1 139 597 987 $ US |
| 2003 | 6 814 326 706 $ US | 1 113 937 305 $ US |
| 2002 | 5 989 425 301 $ US | 895 594 798 $ US |
| 2001 | 6 083 646 029 $ US | 753 284 305 $ US |
| 2000 | 6 398 441 703 $ US | 815 814 069 $ US |
| 1999 | 5 457 697 105 $ US | 778 247 680 $ US |
| 1998 | 5 140 892 903 $ US | 724 481 231 $ US |
| 1997 | 4 839 709 275 $ US | 687 501 414 $ US |
| 1996 | 4 008 737 693 $ US | 605 387 325 $ US |
| 1995 | 3 733 288 294 $ US | 698 193 828 $ US |
| 1994 | 2 934 413 942 $ US | 589 796 980 $ US |
| 1993 | 2 544 671 069 $ US | 529 414 582 $ US |
| 1992 | 2 097 866 552 $ US | 483 351 807 $ US |
| 1991 | 1 688 658 601 $ US | 431 049 174 $ US |
| 1990 | 1 672 401 690 $ US | 391 568 085 $ US |
| 1989 | 1 304 772 234 $ US | 334 397 273 $ US |
| 1988 | 1 291 023 746 $ US | 277 644 150 $ US |
| 1987 | 1 076 878 928 $ US | 247 940 898 $ US |
| 1986 | 879 997 898 $ US | 215 034 176 $ US |
| 1985 | 999 457 039 $ US | 237 887 455 $ US |
| 1984 | 931 742 139 $ US | 207 480 734 $ US |
| 1983 | 723 946 924 $ US | 215 907 277 $ US |
| 1982 | 768 435 439 $ US | 218 190 161 $ US |
| 1981 | 790 466 640 $ US | 211 134 164 $ US |
| 1980 | 793 230 498 $ US | 211 479 159 $ US |
| 1979 | 655 590 633 $ US | 132 627 678 $ US |
| 1978 | 549 261 813 $ US | 101 003 293 $ US |
| 1977 | 476 434 799 $ US | 64 143 706 $ US |
| 1976 | 399 293 224 $ US | 67 969 721 $ US |
En 2025, les exportations de biens du Bangladesh s'élevaient à 43,8 milliards de dollars et celles de services à 8,42 milliards de dollars ; les services représentaient 16,1 % du total, contre 14,5 % en 1976.
Le Bangladesh dans le classement mondial des exportations, 2025







Exportations de biens et services du Bangladesh, % du PIB, 1960–2025
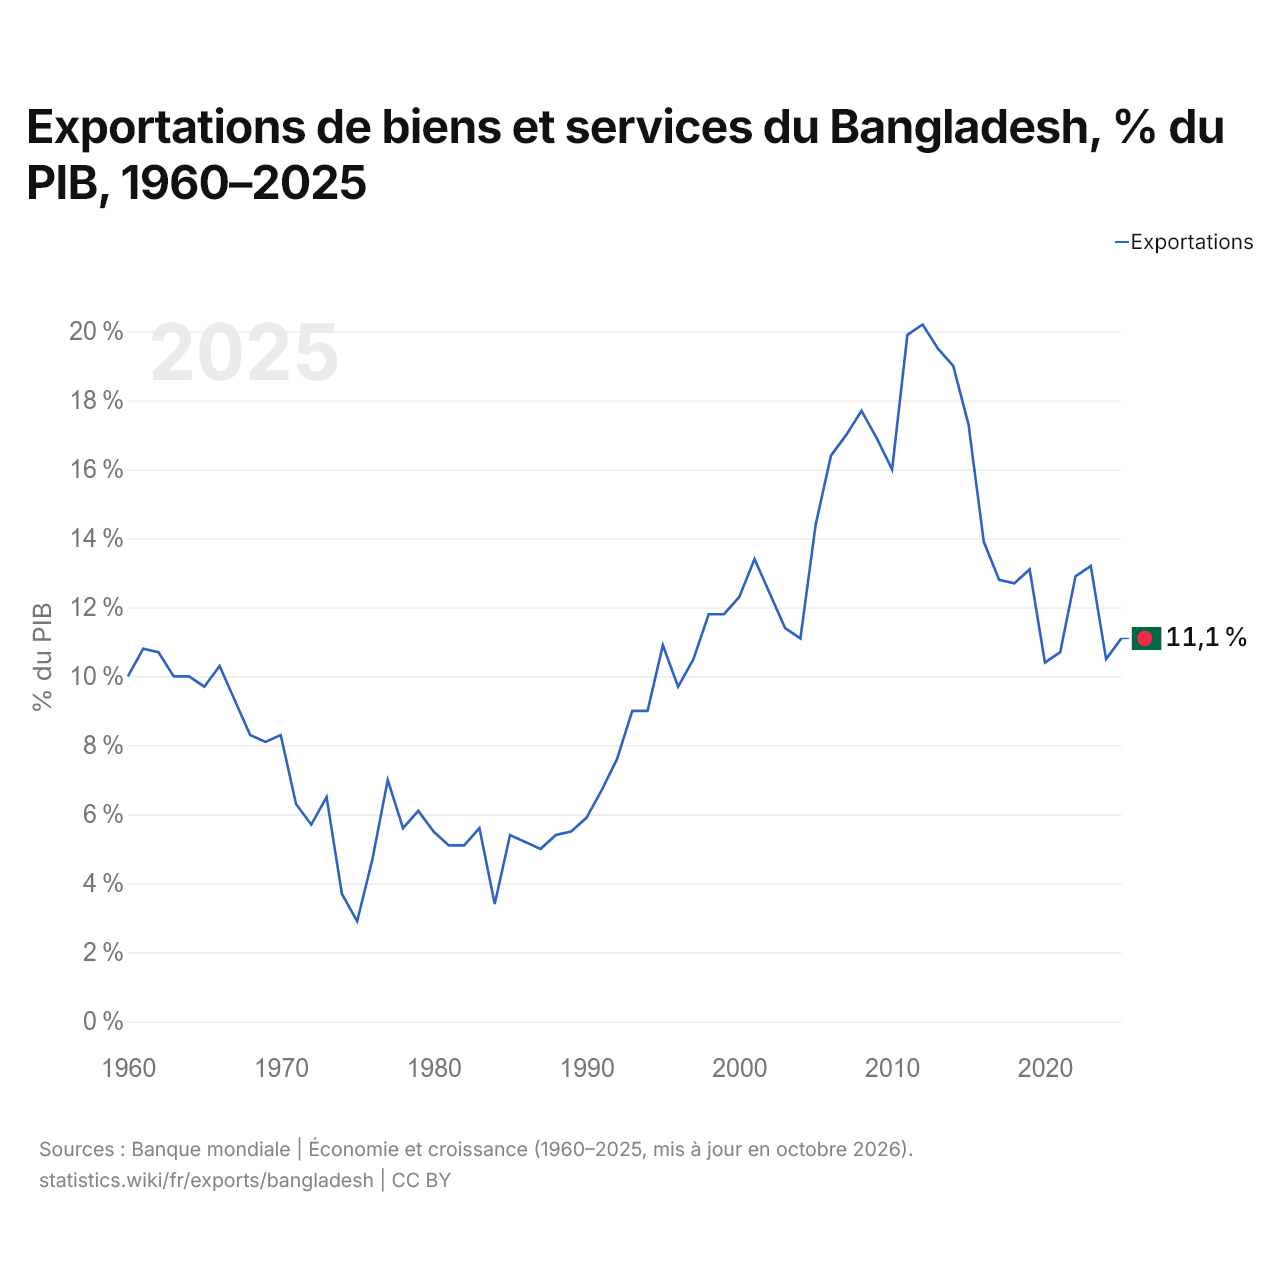
En 2025, les exportations de biens et services du Bangladesh équivalaient à 11,1 % de son PIB, contre 10,0 % en 1960. La part la plus élevée a été de 20,2 %, en 2012.
Comparer les exportations du Bangladesh avec celles d'autres pays
Sources :
- Banque mondiale | Économie et croissance (1960–2025, mis à jour en octobre 2026)
- TradeMap (2001–2018, mis à jour en octobre 2026)
Creative Commons Attribution (CC BY) : vous pouvez copier, partager, adapter et réutiliser ce contenu, y compris à des fins commerciales, à condition de citer statistics.wiki et d’indiquer les modifications apportées. Les sources citées ci-dessus peuvent avoir leurs propres conditions de licence.