
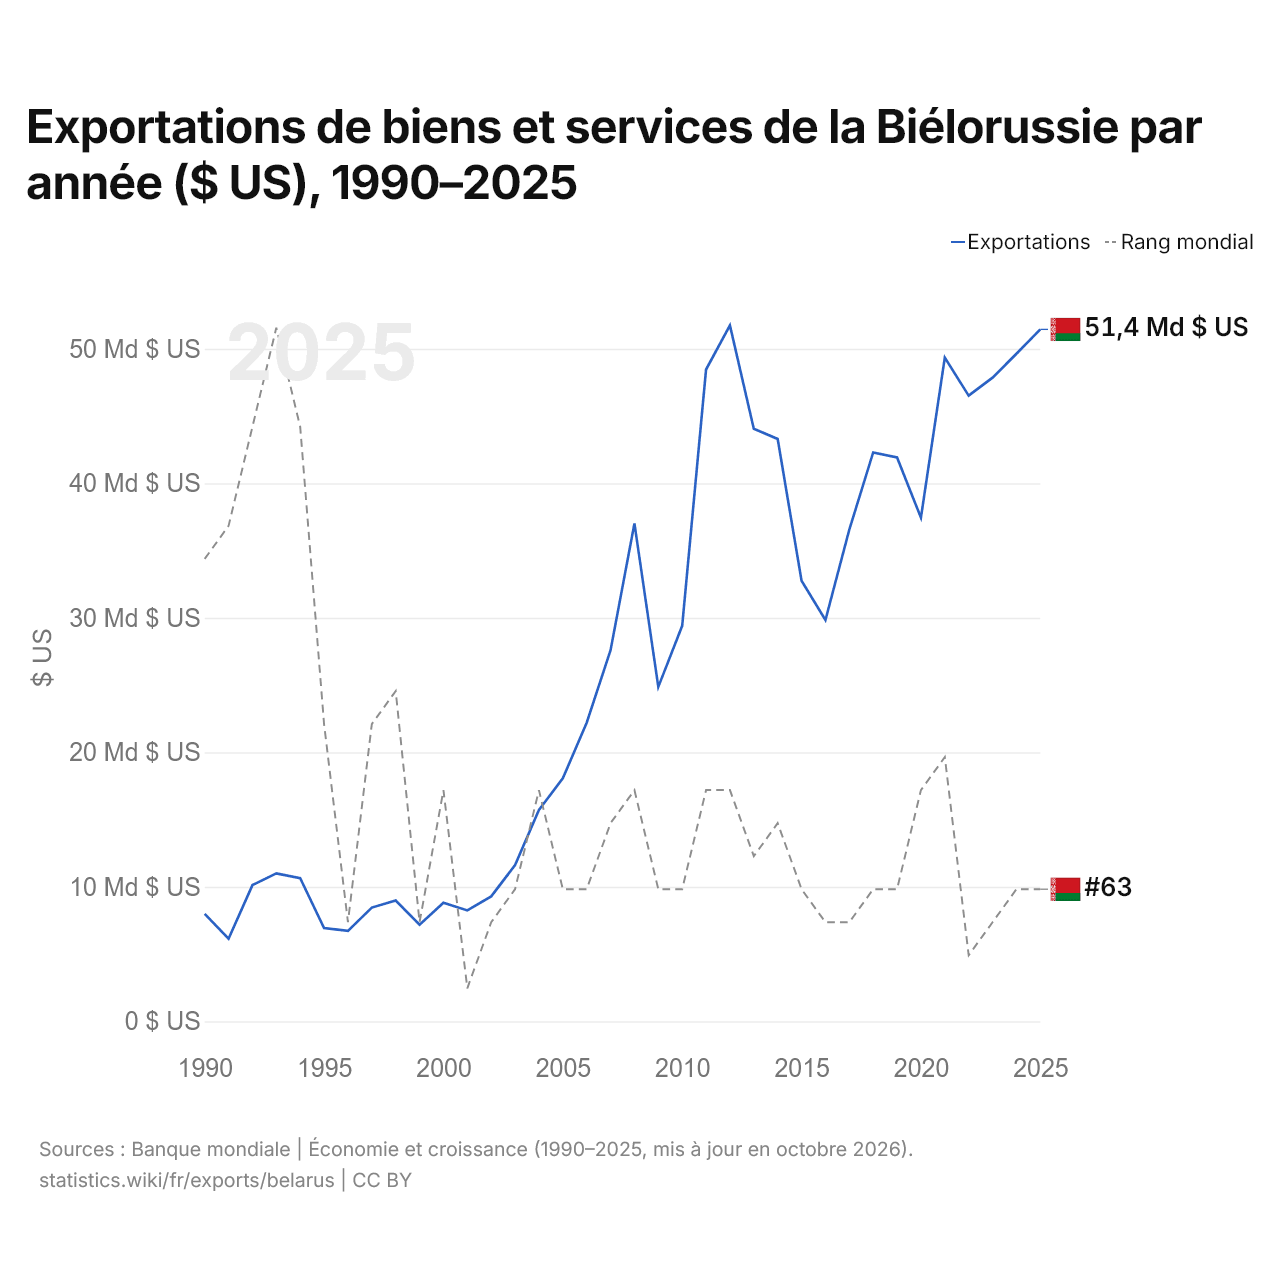
Exportations de biens et services de la Biélorussie par année ($ US), 1990–2025
| Année | $ US | Rang mondial |
|---|---|---|
| Exportations | Rang mondial | |
| 2025 | 51 443 726 734 $ US | #63 |
| 2024 | 49 635 542 198 $ US | #63 |
| 2023 | 47 855 354 382 $ US | #64 |
| 2022 | 46 516 126 576 $ US | #65 |
| 2021 | 49 351 137 897 $ US | #59 |
| 2020 | 37 444 144 984 $ US | #60 |
| 2019 | 41 927 532 636 $ US | #63 |
| 2018 | 42 294 886 946 $ US | #63 |
| 2017 | 36 550 879 710 $ US | #64 |
| 2016 | 29 831 676 604 $ US | #64 |
| 2015 | 32 749 844 751 $ US | #63 |
| 2014 | 43 300 691 503 $ US | #61 |
| 2013 | 44 057 927 602 $ US | #62 |
| 2012 | 51 745 313 006 $ US | #60 |
| 2011 | 48 462 076 577 $ US | #60 |
| 2010 | 29 401 680 706 $ US | #63 |
| 2009 | 24 865 004 207 $ US | #63 |
| 2008 | 37 020 969 856 $ US | #60 |
| 2007 | 27 592 401 029 $ US | #61 |
| 2006 | 22 199 798 560 $ US | #63 |
| 2005 | 18 064 972 932 $ US | #63 |
| 2004 | 15 709 960 838 $ US | #60 |
| 2003 | 11 614 414 485 $ US | #63 |
| 2002 | 9 286 372 926 $ US | #64 |
| 2001 | 8 246 546 763 $ US | #66 |
| 2000 | 8 815 283 224 $ US | #60 |
| 1999 | 7 186 389 619 $ US | #64 |
| 1998 | 8 988 770 378 $ US | #57 |
| 1997 | 8 457 248 498 $ US | #58 |
| 1996 | 6 720 924 332 $ US | #64 |
| 1995 | 6 939 556 172 $ US | #58 |
| 1994 | 10 641 574 225 $ US | #49 |
| 1993 | 11 004 262 913 $ US | #46 |
| 1992 | 10 127 048 426 $ US | #49 |
| 1991 | 6 134 969 325 $ US | #52 |
| 1990 | 7 991 967 871 $ US | #53 |
En 2025, les exportations de biens et services de la Biélorussie s'élevaient à 51,4 milliards de dollars, contre 7,99 milliards de dollars en 1990. Le maximum a été de 51,7 milliards de dollars, en 2012. Elles se classaient au 63e rang mondial, un rang qu'elles occupent depuis 2024. Leur meilleur rang a été le 46e, occupé pour la dernière fois en 1993.
En 2025, les exportations de biens et services de la Biélorussie étaient les 29es plus élevées de 41 pays situés en Europe. Les importations de biens et services de la Biélorussie s'élevaient à 53,3 milliards de dollars en 2025, au 66e rang mondial. En 2025, les importations de la Biélorussie dépassaient ses exportations de 1,82 milliard de dollars, soit un déficit commercial.
Exportations de biens de la Biélorussie par catégorie
Exportations de biens, 2021: 39,9 Md $US
La première catégorie des exportations de biens de la Biélorussie est « autres biens et non précisés », avec 40,4 %, suivie de « machines, électronique et véhicules », avec 13,1 %.
Destinations des exportations de biens de la Biélorussie : les 10 premières
| Rang | Pays | Exportations de biens | Part | |
|---|---|---|---|---|
| 1 |
 Russie |
14,0 Md $US | 35 % | vs Russie |
| 2 |
 Pologne |
1,58 Md $US | 3,97 % | vs Pologne |
| 3 |
 Ukraine |
1,21 Md $US | 3,05 % | vs Ukraine |
| 4 |
 Lituanie |
1,19 Md $US | 2,97 % | vs Lituanie |
| 5 |
 Allemagne |
790 M $US | 1,98 % | |
| 6 |
 Kazakhstan |
765 M $US | 1,92 % | |
| 7 |
 Chine |
556 M $US | 1,39 % | |
| 8 |
 Lettonie |
467 M $US | 1,17 % | |
| 9 |
 Pays-Bas |
280 M $US | 0,7 % | |
| 10 |
 Ouzbékistan |
182 M $US | 0,46 % | |
| Autres partenaires et non précisés | 18,9 Md $US | 47,4 % |
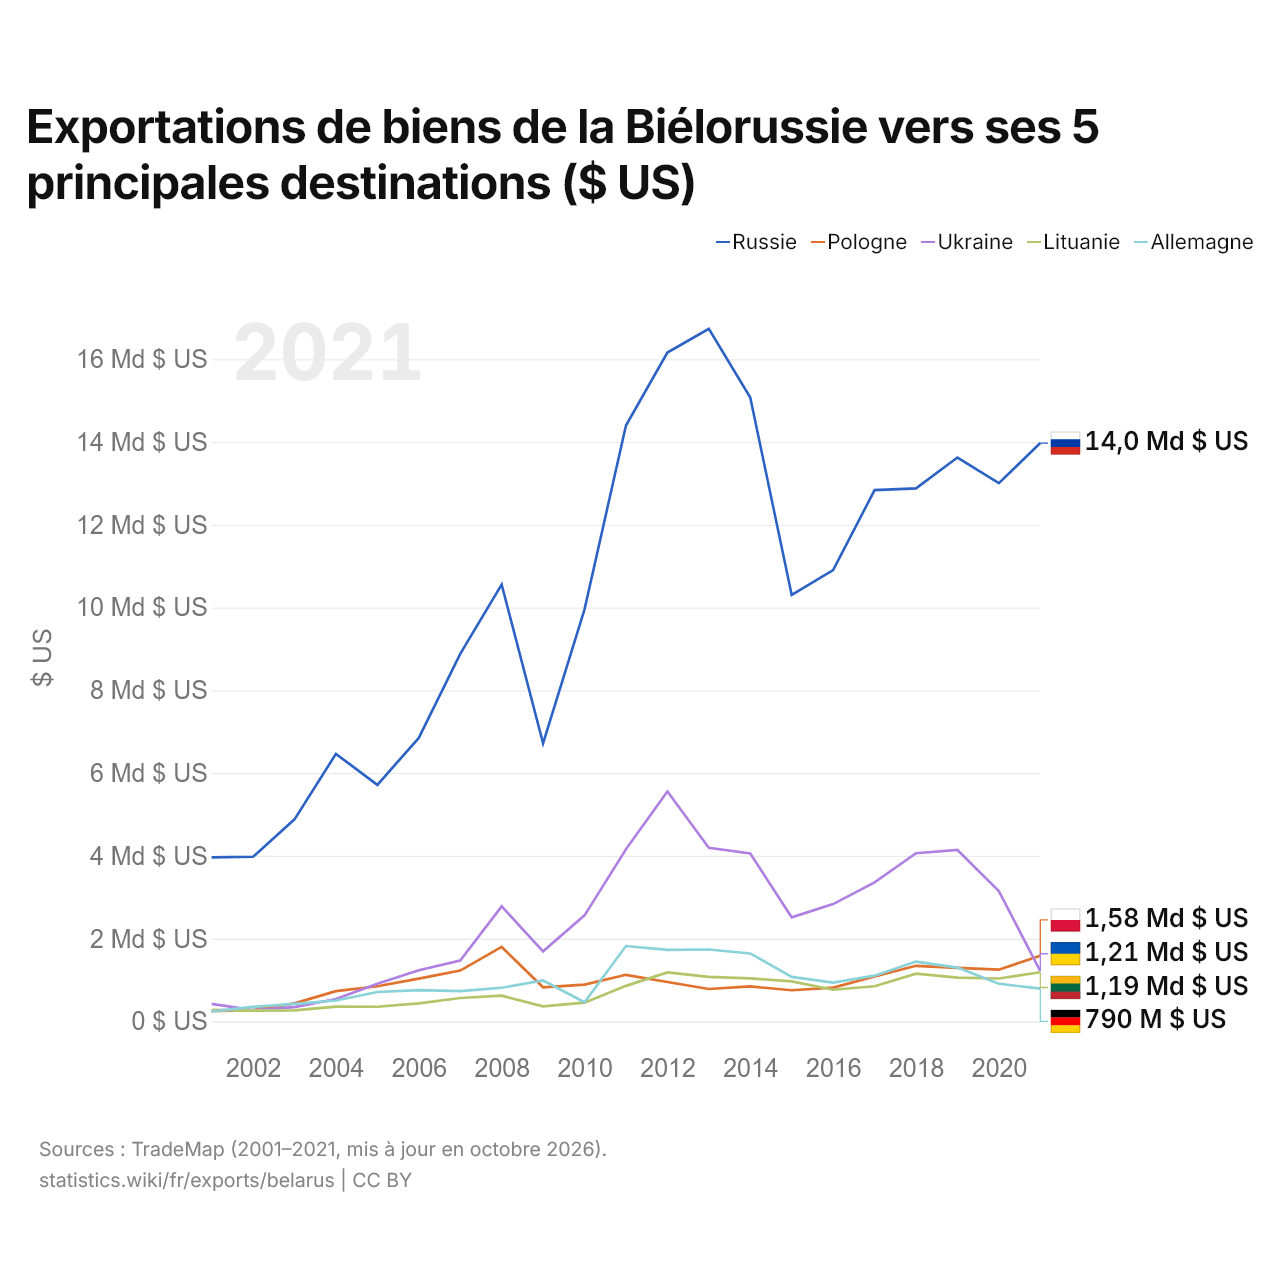
Exportations de biens de la Biélorussie vers ses 5 principales destinations ($ US)
| Année | $ US | ||||
|---|---|---|---|---|---|
| Russie | Pologne | Ukraine | Lituanie | Allemagne | |
| 2021 | 13 972 216 000 $ US | 1 584 422 000 $ US | 1 214 661 000 $ US | 1 185 459 000 $ US | 790 034 000 $ US |
| 2020 | 13 004 542 000 $ US | 1 248 296 000 $ US | 3 148 496 000 $ US | 1 034 228 000 $ US | 907 932 000 $ US |
| 2019 | 13 624 093 000 $ US | 1 290 601 000 $ US | 4 141 633 000 $ US | 1 054 542 000 $ US | 1 298 100 000 $ US |
| 2018 | 12 879 206 000 $ US | 1 341 628 000 $ US | 4 061 534 000 $ US | 1 152 053 000 $ US | 1 443 494 000 $ US |
| 2017 | 12 835 765 000 $ US | 1 082 242 000 $ US | 3 355 316 000 $ US | 846 586 000 $ US | 1 102 859 000 $ US |
| 2016 | 10 901 669 000 $ US | 813 933 000 $ US | 2 833 294 000 $ US | 763 789 000 $ US | 936 344 000 $ US |
| 2015 | 10 301 110 000 $ US | 750 897 000 $ US | 2 512 180 000 $ US | 963 769 000 $ US | 1 073 737 000 $ US |
| 2014 | 15 071 585 000 $ US | 842 726 000 $ US | 4 056 812 000 $ US | 1 038 122 000 $ US | 1 640 618 000 $ US |
| 2013 | 16 733 677 000 $ US | 781 368 000 $ US | 4 193 276 000 $ US | 1 072 547 000 $ US | 1 736 110 000 $ US |
| 2012 | 16 161 365 000 $ US | 949 136 000 $ US | 5 554 365 000 $ US | 1 181 148 000 $ US | 1 725 490 000 $ US |
| 2011 | 14 397 672 000 $ US | 1 123 783 000 $ US | 4 157 631 000 $ US | 857 121 000 $ US | 1 819 413 000 $ US |
| 2010 | 9 953 648 000 $ US | 885 799 000 $ US | 2 560 078 000 $ US | 450 506 000 $ US | 460 774 000 $ US |
| 2009 | 6 718 486 000 $ US | 823 232 000 $ US | 1 691 506 000 $ US | 362 253 000 $ US | 987 433 000 $ US |
| 2008 | 10 551 896 000 $ US | 1 798 396 000 $ US | 2 777 901 000 $ US | 619 229 000 $ US | 811 977 000 $ US |
| 2007 | 8 878 578 000 $ US | 1 226 164 000 $ US | 1 469 836 000 $ US | 564 537 000 $ US | 731 084 000 $ US |
| 2006 | 6 849 619 000 $ US | 1 032 800 000 $ US | 1 234 049 000 $ US | 432 702 000 $ US | 752 556 000 $ US |
| 2005 | 5 713 921 000 $ US | 847 344 000 $ US | 907 842 000 $ US | 351 783 000 $ US | 708 334 000 $ US |
| 2004 | 6 462 977 000 $ US | 728 754 000 $ US | 539 810 000 $ US | 356 277 000 $ US | 502 848 000 $ US |
| 2003 | 4 879 858 000 $ US | 434 172 000 $ US | 343 520 000 $ US | 264 982 000 $ US | 421 184 000 $ US |
| 2002 | 3 977 107 000 $ US | 273 280 000 $ US | 271 582 000 $ US | 256 736 000 $ US | 347 941 000 $ US |
| 2001 | 3 962 717 000 $ US | 248 001 000 $ US | 421 819 000 $ US | 275 804 000 $ US | 241 045 000 $ US |
Les exportations de biens s'élèvent à 14 milliards de dollars vers la Russie (2021), 1,58 milliard de dollars vers la Pologne (2021), 1,21 milliard de dollars vers l'Ukraine (2021), 1,19 milliard de dollars vers la Lituanie (2021) et 790 millions de dollars vers l'Allemagne (2021). Le premier rang des cinq destinations de la Biélorussie est occupé par la Russie chaque année depuis 2001. Le changement le plus récent dans leur ordre remonte à 2021, quand les exportations de la Biélorussie vers la Pologne ont dépassé celles vers l'Ukraine.
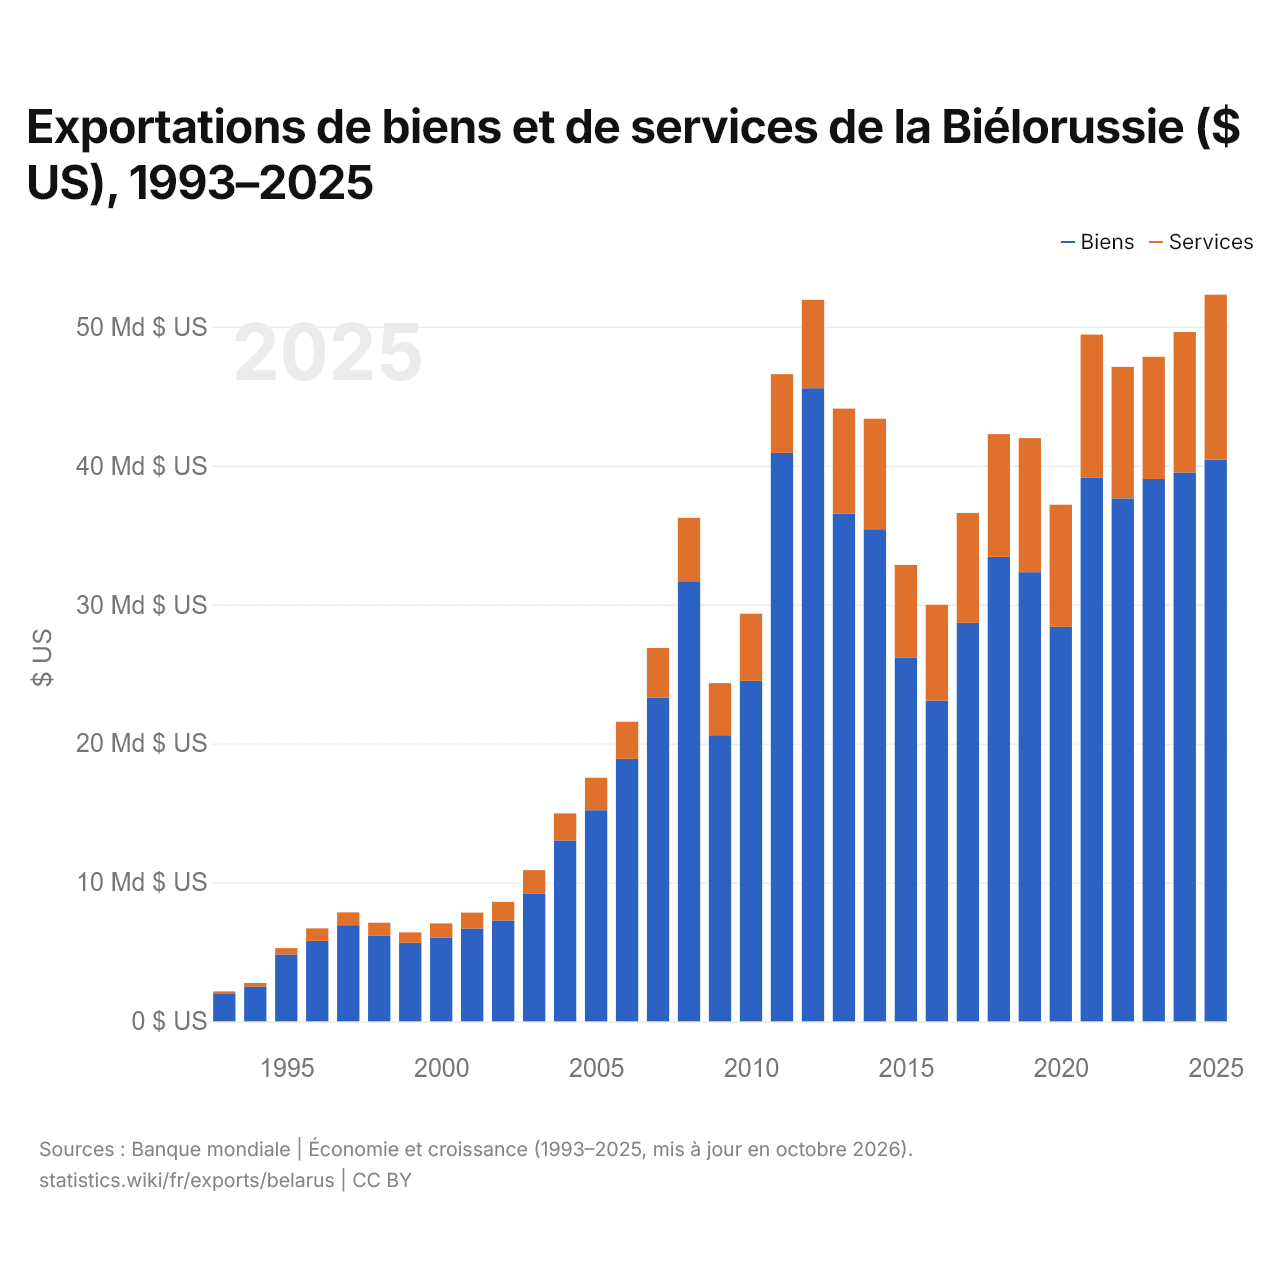
Exportations de biens et de services de la Biélorussie ($ US), 1993–2025
| Année | $ US | |
|---|---|---|
| Biens | Services | |
| 2025 | 40 449 145 447 $ US | 11 858 575 734 $ US |
| 2024 | 39 510 100 000 $ US | 10 114 268 797 $ US |
| 2023 | 39 037 500 000 $ US | 8 797 789 067 $ US |
| 2022 | 37 644 100 000 $ US | 9 466 027 434 $ US |
| 2021 | 39 122 300 000 $ US | 10 313 077 360 $ US |
| 2020 | 28 395 600 000 $ US | 8 787 600 000 $ US |
| 2019 | 32 333 000 000 $ US | 9 641 900 000 $ US |
| 2018 | 33 429 800 000 $ US | 8 838 000 000 $ US |
| 2017 | 28 690 200 000 $ US | 7 905 200 000 $ US |
| 2016 | 23 099 800 000 $ US | 6 883 900 000 $ US |
| 2015 | 26 164 300 000 $ US | 6 689 800 000 $ US |
| 2014 | 35 423 300 000 $ US | 7 952 300 000 $ US |
| 2013 | 36 540 100 000 $ US | 7 571 400 000 $ US |
| 2012 | 45 574 300 000 $ US | 6 364 100 000 $ US |
| 2011 | 40 927 600 000 $ US | 5 652 500 000 $ US |
| 2010 | 24 506 100 000 $ US | 4 833 000 000 $ US |
| 2009 | 20 595 400 000 $ US | 3 746 000 000 $ US |
| 2008 | 31 627 400 000 $ US | 4 616 400 000 $ US |
| 2007 | 23 309 600 000 $ US | 3 563 300 000 $ US |
| 2006 | 18 895 800 000 $ US | 2 673 500 000 $ US |
| 2005 | 15 194 000 000 $ US | 2 342 300 000 $ US |
| 2004 | 13 014 600 000 $ US | 1 962 300 000 $ US |
| 2003 | 9 177 300 000 $ US | 1 704 200 000 $ US |
| 2002 | 7 250 600 000 $ US | 1 353 600 000 $ US |
| 2001 | 6 682 200 000 $ US | 1 151 000 000 $ US |
| 2000 | 6 035 300 000 $ US | 1 012 500 000 $ US |
| 1999 | 5 645 100 000 $ US | 754 600 000 $ US |
| 1998 | 6 157 400 000 $ US | 940 000 000 $ US |
| 1997 | 6 918 700 000 $ US | 918 800 000 $ US |
| 1996 | 5 790 100 000 $ US | 908 000 000 $ US |
| 1995 | 4 803 000 000 $ US | 466 100 000 $ US |
| 1994 | 2 510 000 000 $ US | 251 400 000 $ US |
| 1993 | 1 970 100 000 $ US | 184 900 000 $ US |
En 2025, les exportations de biens de la Biélorussie s'élevaient à 40,4 milliards de dollars et celles de services à 11,9 milliards de dollars ; les services représentaient 22,7 % du total, contre 8,6 % en 1993.
La Biélorussie dans le classement mondial des exportations, 2025
| Rang | Pays | Exportations | Part mondiale | |
|---|---|---|---|---|
| 60 |
 Slovénie |
62,6 Md $US | 0,18 % | |
| 61 |
 Serbie |
54,3 Md $US | 0,16 % | vs Serbie |
| 62 |
Ukraine
|
54,3 Md $US | 0,16 % | vs Ukraine |
| 63 |
 Biélorussie |
51,4 Md $US | 0,15 % | |
| 64 |
 Bangladesh |
50,7 Md $US | 0,15 % | |
| 65 |
 Croatie |
50,4 Md $US | 0,14 % | |
| 66 |
 Algérie |
48,3 Md $US | 0,14 % |
Exportations de biens et services de la Biélorussie, % du PIB, 1990–2025
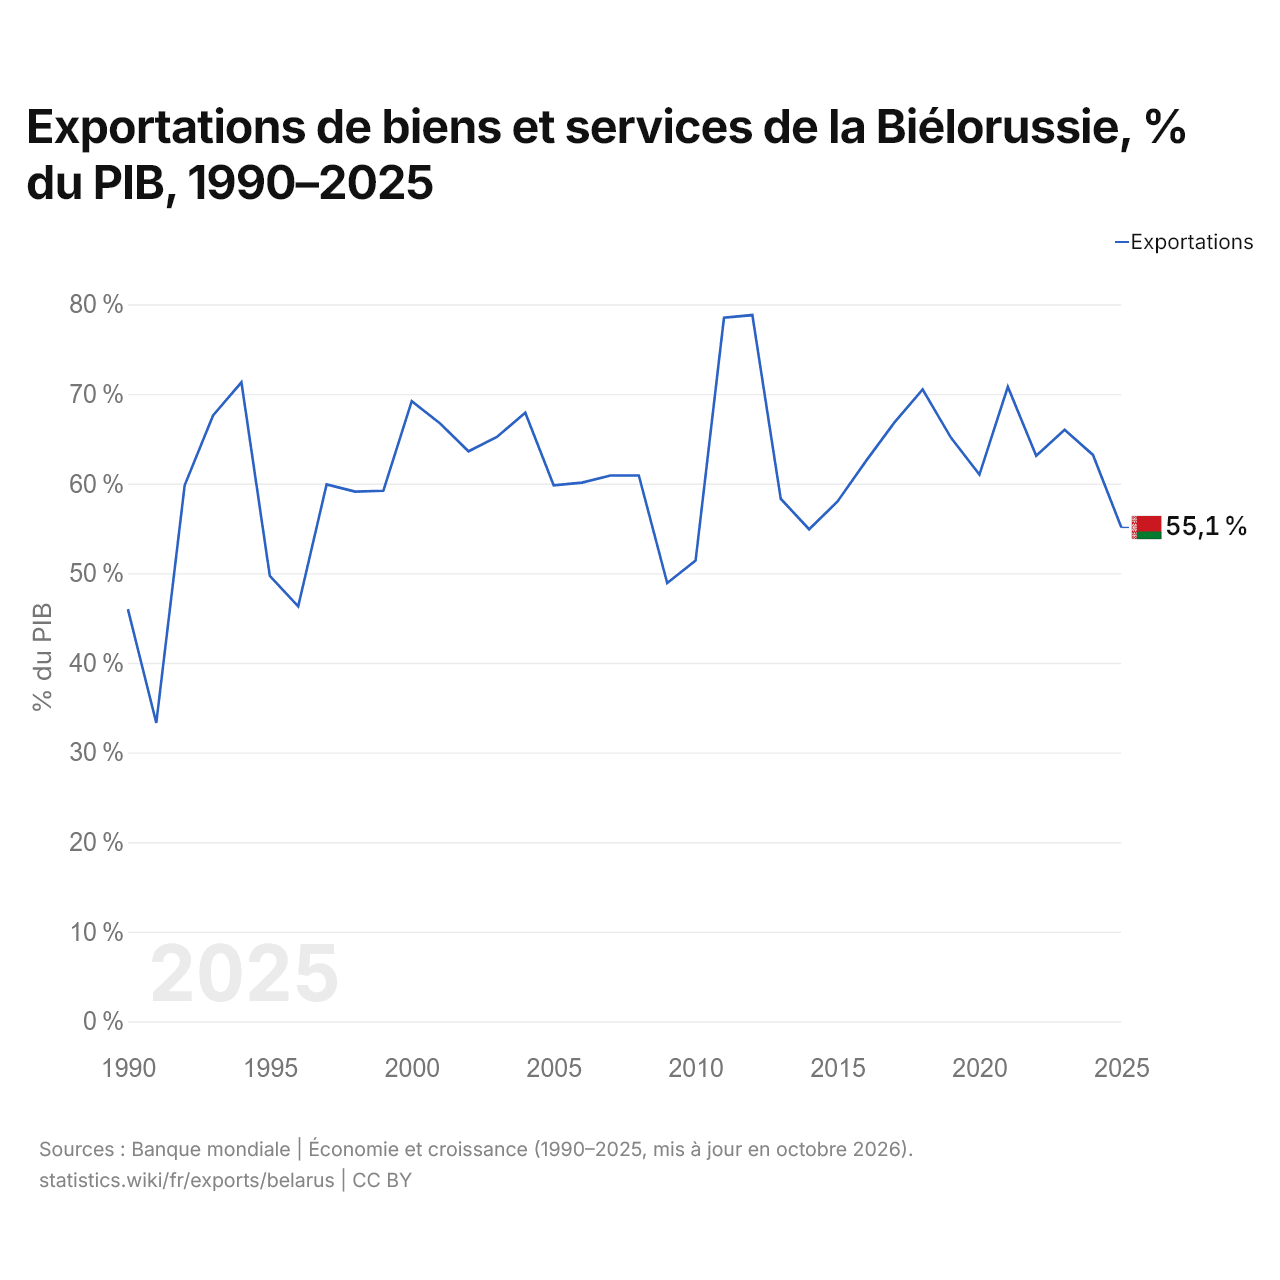
En 2025, les exportations de biens et services de la Biélorussie équivalaient à 55,1 % de son PIB, contre 46,0 % en 1990. La part la plus élevée a été de 78,8 %, en 2012.
Comparer les exportations de la Biélorussie avec celles d'autres pays
Sources :
- TradeMap (2001–2021, mis à jour en octobre 2026)
- Banque mondiale | Économie et croissance (1990–2025, mis à jour en octobre 2026)
Creative Commons Attribution (CC BY) : vous pouvez copier, partager, adapter et réutiliser ce contenu, y compris à des fins commerciales, à condition de citer statistics.wiki et d’indiquer les modifications apportées. Les sources citées ci-dessus peuvent avoir leurs propres conditions de licence.