
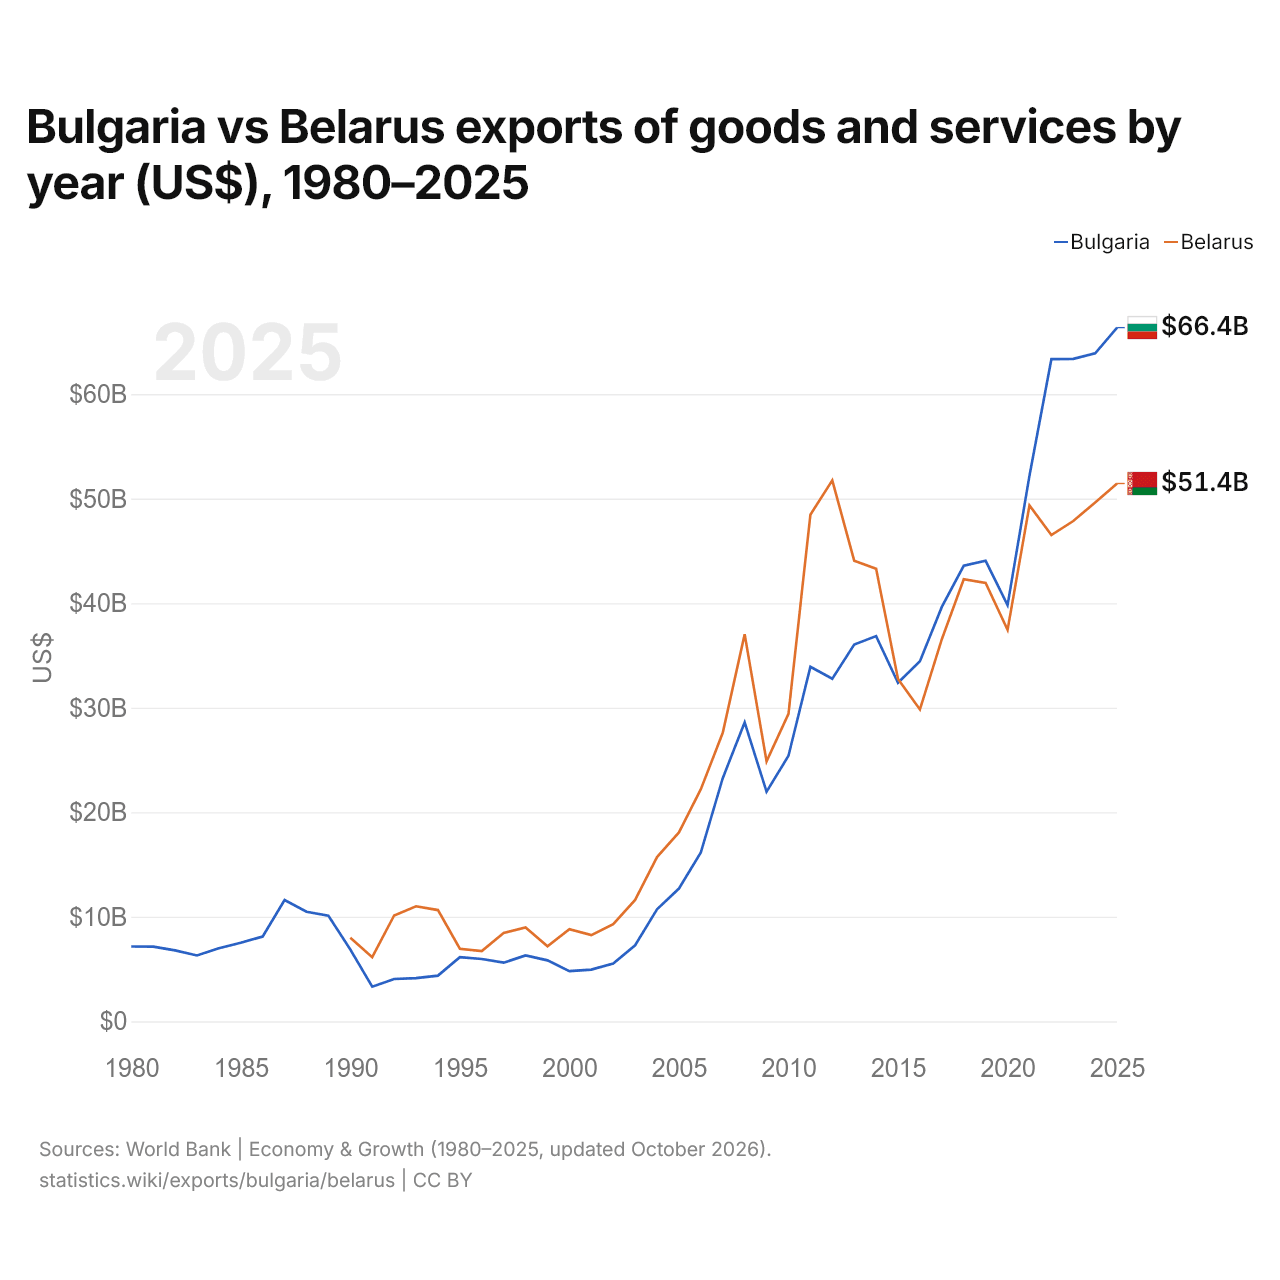
Bulgarie vs Biélorussie : exportations de biens et services par année ($ US), 1980–2025
| Année | $ US | |
|---|---|---|
 Bulgarie |
 Biélorussie |
|
| 2025 | 66 354 382 381 $ US | 51 443 726 734 $ US |
| 2024 | 63 894 874 228 $ US | 49 635 542 198 $ US |
| 2023 | 63 371 847 847 $ US | 47 855 354 382 $ US |
| 2022 | 63 338 969 112 $ US | 46 516 126 576 $ US |
| 2021 | 52 188 034 904 $ US | 49 351 137 897 $ US |
| 2020 | 39 809 586 250 $ US | 37 444 144 984 $ US |
| 2019 | 44 053 127 057 $ US | 41 927 532 636 $ US |
| 2018 | 43 572 669 715 $ US | 42 294 886 946 $ US |
| 2017 | 39 638 742 331 $ US | 36 550 879 710 $ US |
| 2016 | 34 441 575 794 $ US | 29 831 676 604 $ US |
| 2015 | 32 383 417 568 $ US | 32 749 844 751 $ US |
| 2014 | 36 848 064 410 $ US | 43 300 691 503 $ US |
| 2013 | 36 041 537 034 $ US | 44 057 927 602 $ US |
| 2012 | 32 767 921 910 $ US | 51 745 313 006 $ US |
| 2011 | 33 911 530 785 $ US | 48 462 076 577 $ US |
| 2010 | 25 395 522 756 $ US | 29 401 680 706 $ US |
| 2009 | 21 964 974 098 $ US | 24 865 004 207 $ US |
| 2008 | 28 591 649 714 $ US | 37 020 969 856 $ US |
| 2007 | 23 263 189 914 $ US | 27 592 401 029 $ US |
| 2006 | 16 152 072 593 $ US | 22 199 798 560 $ US |
| 2005 | 12 703 659 939 $ US | 18 064 972 932 $ US |
| 2004 | 10 713 880 327 $ US | 15 709 960 838 $ US |
| 2003 | 7 277 821 210 $ US | 11 614 414 485 $ US |
| 2002 | 5 519 464 526 $ US | 9 286 372 926 $ US |
| 2001 | 4 947 626 204 $ US | 8 246 546 763 $ US |
| 2000 | 4 797 791 666 $ US | 8 815 283 224 $ US |
| 1999 | 5 830 130 224 $ US | 7 186 389 619 $ US |
| 1998 | 6 304 548 123 $ US | 8 988 770 378 $ US |
| 1997 | 5 610 391 097 $ US | 8 457 248 498 $ US |
| 1996 | 5 962 986 680 $ US | 6 720 924 332 $ US |
| 1995 | 6 142 087 839 $ US | 6 939 556 172 $ US |
| 1994 | 4 373 762 116 $ US | 10 641 574 225 $ US |
| 1993 | 4 138 612 933 $ US | 11 004 262 913 $ US |
| 1992 | 4 052 975 879 $ US | 10 127 048 426 $ US |
| 1991 | 3 316 878 143 $ US | 6 134 969 325 $ US |
| 1990 | 6 864 510 321 $ US | 7 991 967 871 $ US |
| 1989 | 10 094 532 671 $ US | - |
| 1988 | 10 481 297 226 $ US | - |
| 1987 | 11 595 544 133 $ US | - |
| 1986 | 8 111 526 000 $ US | - |
| 1985 | 7 515 998 369 $ US | - |
| 1984 | 6 987 153 874 $ US | - |
| 1983 | 6 300 586 601 $ US | - |
| 1982 | 6 789 013 094 $ US | - |
| 1981 | 7 148 240 030 $ US | - |
| 1980 | 7 155 026 071 $ US | - |
En 2025, les exportations de biens et services de la Bulgarie s'élevaient à 66,4 milliards de dollars et celles de la Biélorussie à 51,4 milliards de dollars : celles de la Bulgarie étaient supérieures de 29 %. En 1990, les exportations de la Biélorussie étaient supérieures de 16 % : 6,86 milliards de dollars pour la Bulgarie et 7,99 milliards de dollars pour la Biélorussie.
Les exportations de biens et services de la Bulgarie sont supérieures à celles de la Biélorussie chaque année depuis 2016.
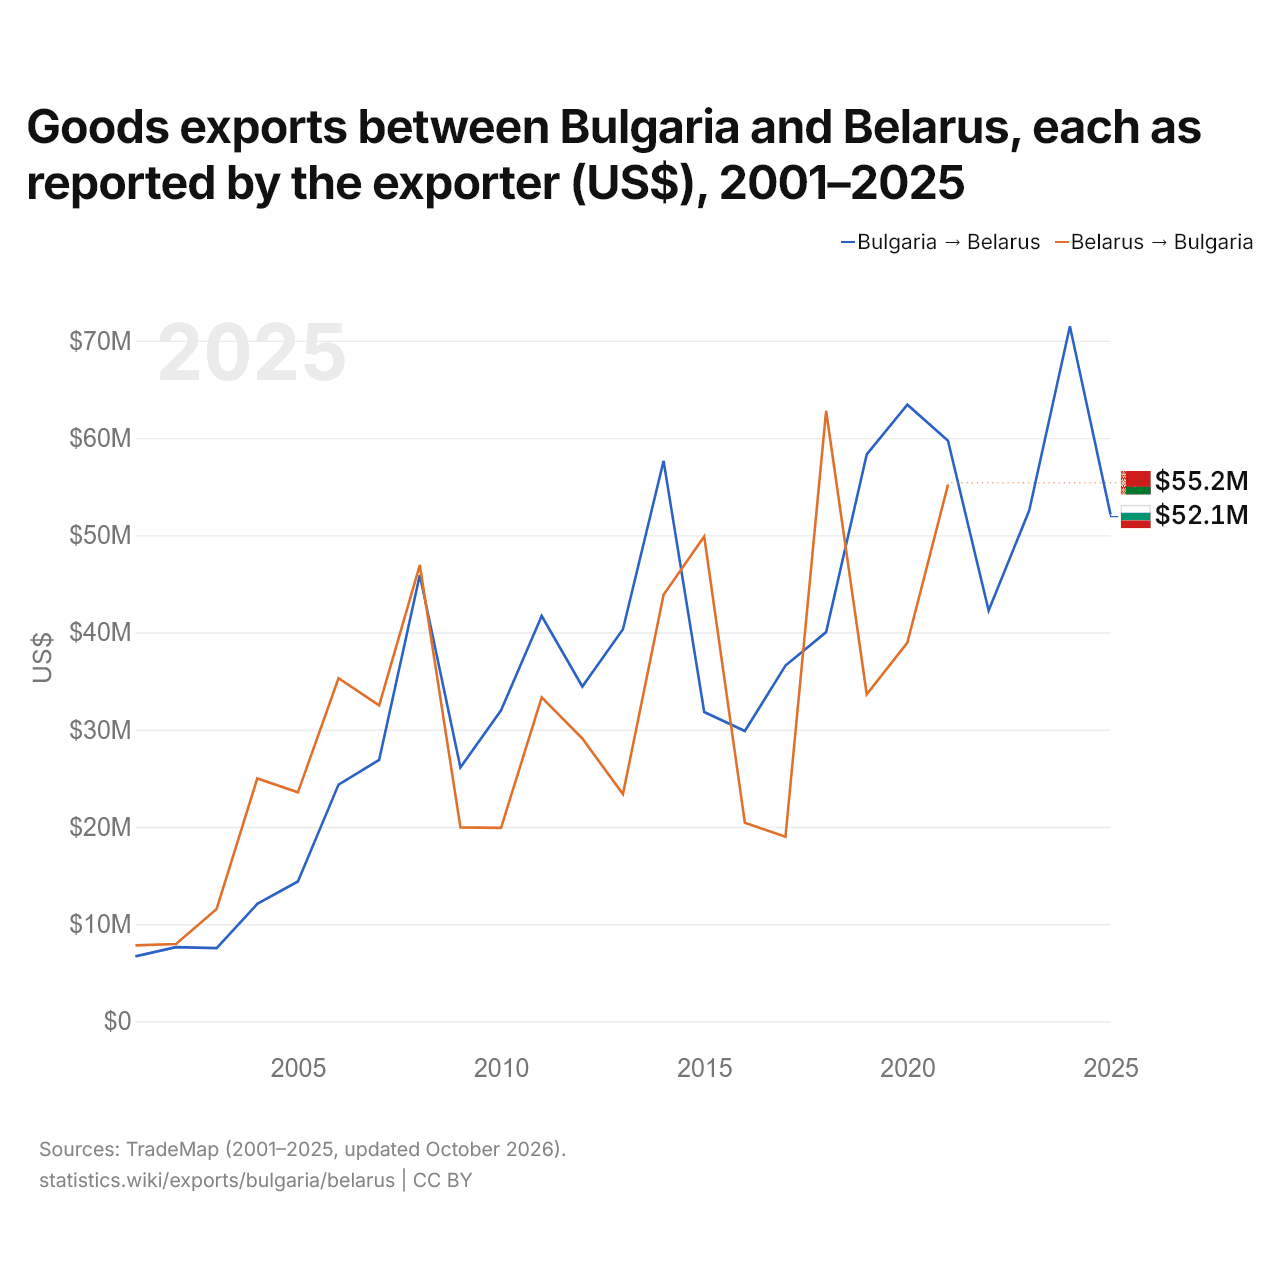
Exportations de biens entre la Bulgarie et la Biélorussie, selon chaque exportateur ($ US), 2001–2025
| Année | $ US | |
|---|---|---|
| Bulgarie → Biélorussie | Biélorussie → Bulgarie | |
| 2025 | 52 114 000 $ US | - |
| 2024 | 71 489 000 $ US | - |
| 2023 | 52 560 000 $ US | - |
| 2022 | 42 240 000 $ US | - |
| 2021 | 59 707 000 $ US | 55 180 000 $ US |
| 2020 | 63 416 000 $ US | 38 949 000 $ US |
| 2019 | 58 303 000 $ US | 33 635 000 $ US |
| 2018 | 40 022 000 $ US | 62 788 000 $ US |
| 2017 | 36 586 000 $ US | 18 976 000 $ US |
| 2016 | 29 851 000 $ US | 20 420 000 $ US |
| 2015 | 31 809 000 $ US | 49 865 000 $ US |
| 2014 | 57 632 000 $ US | 43 865 000 $ US |
| 2013 | 40 324 000 $ US | 23 367 000 $ US |
| 2012 | 34 435 000 $ US | 29 086 000 $ US |
| 2011 | 41 690 000 $ US | 33 317 000 $ US |
| 2010 | 31 988 000 $ US | 19 902 000 $ US |
| 2009 | 26 107 000 $ US | 19 943 000 $ US |
| 2008 | 45 905 000 $ US | 46 925 000 $ US |
| 2007 | 26 884 000 $ US | 32 491 000 $ US |
| 2006 | 24 349 000 $ US | 35 290 000 $ US |
| 2005 | 14 385 000 $ US | 23 547 000 $ US |
| 2004 | 12 073 000 $ US | 24 975 000 $ US |
| 2003 | 7 530 000 $ US | 11 558 000 $ US |
| 2002 | 7 629 000 $ US | 7 954 000 $ US |
| 2001 | 6 685 000 $ US | 7 814 000 $ US |
Les exportations de biens de la Bulgarie vers la Biélorussie, selon la Bulgarie, s'élevaient à 59,7 millions de dollars, et celles de la Biélorussie vers la Bulgarie, selon la Biélorussie, à 55,2 millions de dollars : 8,2 % de plus pour celles de la Bulgarie. En 2001, elles s'élevaient à 6,69 millions de dollars pour la Bulgarie et à 7,81 millions de dollars pour la Biélorussie.
Bulgarie vs Biélorussie : chiffres des exportations
|
Bulgarie
|
Biélorussie
|
|
|---|---|---|
| Exportations | 66,4 Md $US (2025) | 51,4 Md $US (2025) |
| Rang mondial | 57/176 | 63/176 |
| Part mondiale | 0,19 % | 0,15 % |
| % du PIB | 50,7 % | 55,1 % |
| Première catégorie de biens | Machines, électronique et véhicules (26,1 %, 2025) | Autres biens et non précisés (40,4 %, 2021) |
| Première destination des biens | Allemagne (14,3 %, 2025) | Russie (35 %, 2021) |
Comparer les exportations de 2 pays au choix
Sources :
- Banque mondiale | Économie et croissance (1980–2025, mis à jour en octobre 2026)
- TradeMap (2001–2025, mis à jour en octobre 2026)
Creative Commons Attribution (CC BY) : vous pouvez copier, partager, adapter et réutiliser ce contenu, y compris à des fins commerciales, à condition de citer statistics.wiki et d’indiquer les modifications apportées. Les sources citées ci-dessus peuvent avoir leurs propres conditions de licence.