
Exportations de biens et services de l'Allemagne par année ($ US), 1970–2025
| Année | $ US | Rang mondial |
|---|---|---|
| Exportations | Rang mondial | |
| 2025 | 2 042 329 262 308 $ US | #3 |
| 2024 | 1 941 431 210 622 $ US | #3 |
| 2023 | 1 960 255 682 616 $ US | #3 |
| 2022 | 1 916 859 170 749 $ US | #3 |
| 2021 | 1 851 846 071 996 $ US | #3 |
| 2020 | 1 541 867 660 412 $ US | #3 |
| 2019 | 1 676 629 137 012 $ US | #3 |
| 2018 | 1 723 433 049 609 $ US | #3 |
| 2017 | 1 589 089 750 187 $ US | #3 |
| 2016 | 1 472 560 807 846 $ US | #3 |
| 2015 | 1 458 592 274 325 $ US | #3 |
| 2014 | 1 653 100 023 449 $ US | #3 |
| 2013 | 1 586 778 324 179 $ US | #3 |
| 2012 | 1 535 179 851 348 $ US | #3 |
| 2011 | 1 592 275 709 232 $ US | #3 |
| 2010 | 1 369 340 699 300 $ US | #3 |
| 2009 | 1 233 301 486 982 $ US | #3 |
| 2008 | 1 559 414 079 162 $ US | #2 |
| 2007 | 1 415 809 341 319 $ US | #2 |
| 2006 | 1 187 129 764 084 $ US | #2 |
| 2005 | 1 040 265 986 689 $ US | #2 |
| 2004 | 967 940 099 859 $ US | #2 |
| 2003 | 792 550 922 246 $ US | #2 |
| 2002 | 655 732 684 858 $ US | #2 |
| 2001 | 600 934 274 700 $ US | #2 |
| 2000 | 583 812 721 398 $ US | #2 |
| 1999 | 576 268 522 696 $ US | #2 |
| 1998 | 576 778 926 309 $ US | #2 |
| 1997 | 548 072 411 460 $ US | #2 |
| 1996 | 558 519 625 682 $ US | #2 |
| 1995 | 557 027 432 783 $ US | #2 |
| 1994 | 456 474 629 384 $ US | #2 |
| 1993 | 413 275 760 085 $ US | #2 |
| 1992 | 473 020 663 745 $ US | #2 |
| 1991 | 442 049 499 116 $ US | #2 |
| 1990 | 404 361 405 399 $ US | #2 |
| 1989 | 311 798 995 111 $ US | #2 |
| 1988 | 295 364 621 896 $ US | #2 |
| 1987 | 268 359 809 576 $ US | #2 |
| 1986 | 222 600 598 937 $ US | #3 |
| 1985 | 167 947 100 053 $ US | #3 |
| 1984 | 157 450 977 940 $ US | #3 |
| 1983 | 156 299 761 777 $ US | #3 |
| 1982 | 161 985 626 662 $ US | #2 |
| 1981 | 161 088 263 090 $ US | #3 |
| 1980 | 176 861 953 949 $ US | #2 |
| 1979 | 157 013 153 345 $ US | #2 |
| 1978 | 130 525 539 435 $ US | #2 |
| 1977 | 107 912 072 770 $ US | #2 |
| 1976 | 93 878 705 142 $ US | #2 |
| 1975 | 83 906 542 650 $ US | #2 |
| 1974 | 81 166 870 985 $ US | #2 |
| 1973 | 61 138 960 117 $ US | #2 |
| 1972 | 43 607 225 051 $ US | #2 |
| 1971 | 36 378 984 554 $ US | #2 |
| 1970 | 32 635 821 087 $ US | #2 |
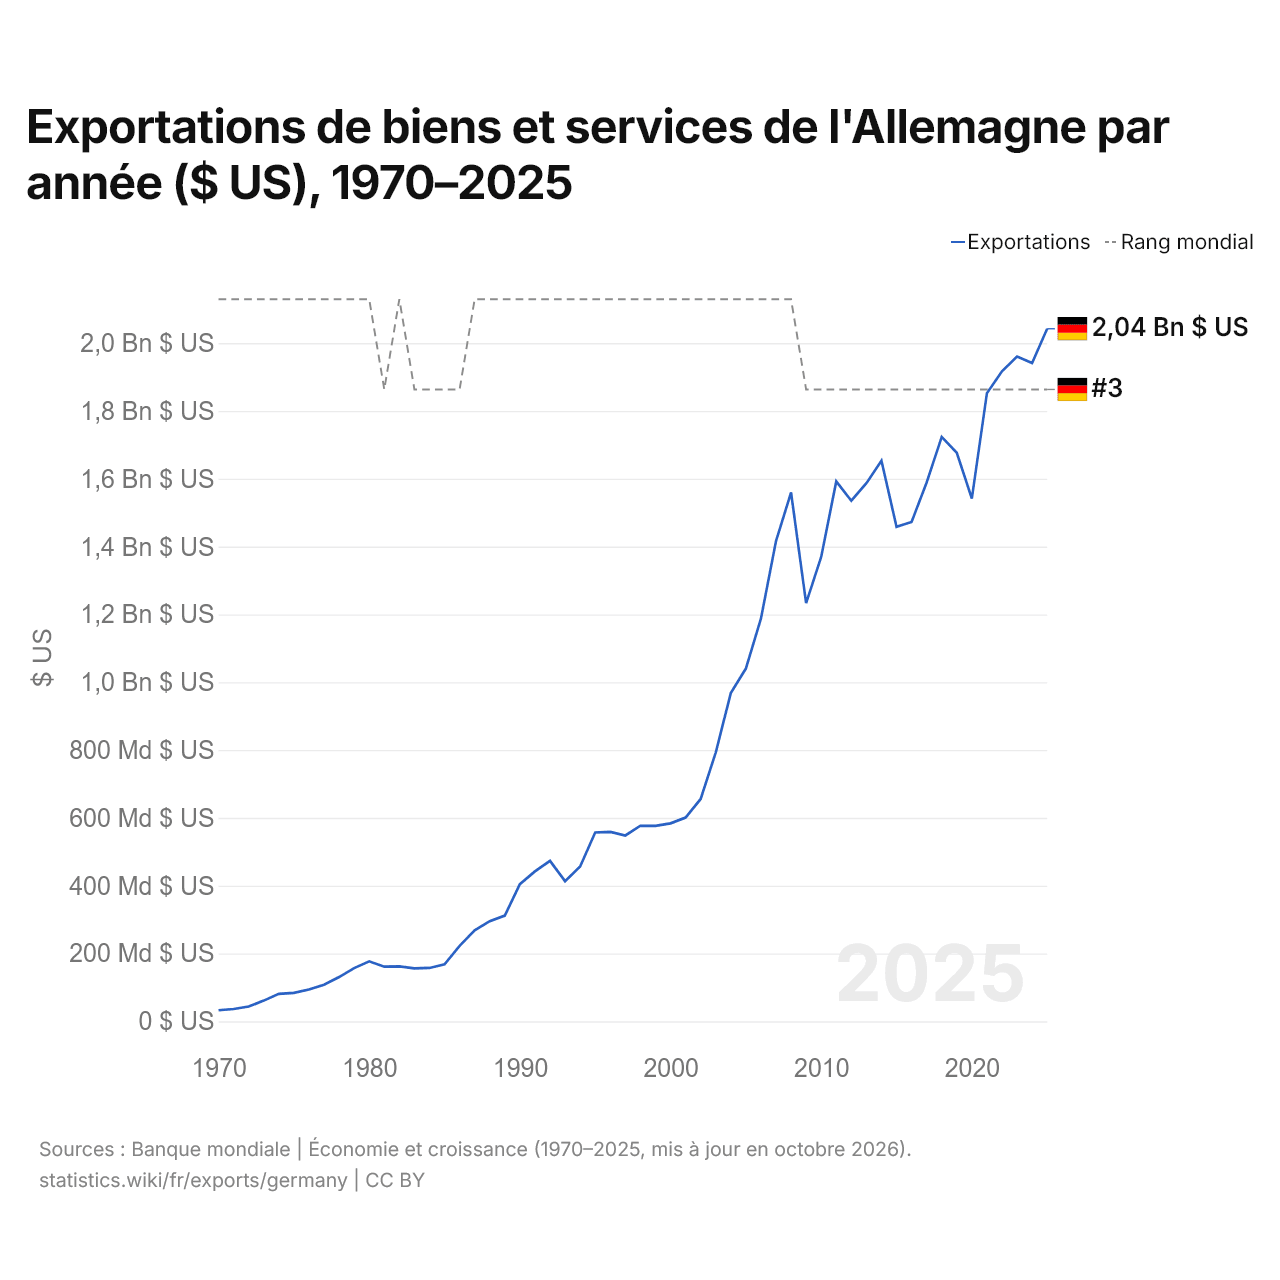
En 2025, les exportations de biens et services de l'Allemagne s'élevaient à 2,04 billions de dollars, contre 32,6 milliards de dollars en 1970. Elles se classaient au 3e rang mondial, un rang qu'elles occupent depuis 2009. Leur meilleur rang a été le 2e, occupé pour la dernière fois en 2008.
En 2025, les exportations de biens et services de l'Allemagne étaient les plus élevées de 41 pays situés en Europe. Les importations de biens et services de l'Allemagne s'élevaient à 1,92 billion de dollars en 2025, au 3e rang mondial. En 2025, les exportations de l'Allemagne dépassaient ses importations de 119 milliards de dollars, soit un excédent commercial.
Exportations de biens de l'Allemagne par catégorie, 2025
Exportations de biens, 2025: 1,77 Bn $US
En 2025, la première catégorie des exportations de biens de l'Allemagne était « machines, électronique et véhicules », avec 51,8 %, suivie de « produits chimiques, pharmaceutiques et plastiques », avec 17,4 %.
Destinations des exportations de biens de l'Allemagne : les 10 premières, 2025
| Rang | Pays | Exportations de biens | Part | |
|---|---|---|---|---|
| 1 |
 États-Unis |
166 Md $US | 9,38 % | vs USA |
| 2 |
 France |
132 Md $US | 7,5 % | vs France |
| 3 |
 Pays-Bas |
126 Md $US | 7,15 % | vs Pays-Bas |
| 4 |
 Pologne |
113 Md $US | 6,41 % | vs Pologne |
| 5 |
 Italie |
94,1 Md $US | 5,33 % | vs Italie |
| 6 |
 Chine |
91,8 Md $US | 5,2 % | vs Chine |
| 7 |
 Royaume-Uni |
90,2 Md $US | 5,11 % | vs R.-U. |
| 8 |
 Autriche |
86,7 Md $US | 4,91 % | vs Autriche |
| 9 |
 Suisse |
84,1 Md $US | 4,76 % | vs Suisse |
| 10 |
 Espagne |
66,8 Md $US | 3,78 % | vs Espagne |
| Autres partenaires et non précisés | 715 Md $US | 40,5 % |
Exportations de biens de l'Allemagne vers ses 5 principales destinations ($ US), 2001–2025
| Année | $ US | ||||
|---|---|---|---|---|---|
| États-Unis | France | Pays-Bas | Pologne | Italie | |
| 2025 | 165 664 050 000 $ US | 132 443 134 000 $ US | 126 345 316 000 $ US | 113 148 719 000 $ US | 94 110 857 000 $ US |
| 2024 | 174 755 249 000 $ US | 124 309 642 000 $ US | 117 584 769 000 $ US | 101 132 151 000 $ US | 86 731 089 000 $ US |
| 2023 | 170 769 307 000 $ US | 129 149 774 000 $ US | 120 433 204 000 $ US | 97 851 877 000 $ US | 92 091 724 000 $ US |
| 2022 | 163 972 415 000 $ US | 123 870 864 000 $ US | 116 595 076 000 $ US | 97 406 075 000 $ US | 93 840 047 000 $ US |
| 2021 | 144 213 202 000 $ US | 121 187 919 000 $ US | 109 069 069 000 $ US | 92 875 486 000 $ US | 89 008 072 000 $ US |
| 2020 | 118 372 610 000 $ US | 103 656 153 000 $ US | 89 063 319 000 $ US | 74 382 909 000 $ US | 69 153 834 000 $ US |
| 2019 | 132 857 659 000 $ US | 119 212 781 000 $ US | 92 774 475 000 $ US | 73 609 779 000 $ US | 75 895 458 000 $ US |
| 2018 | 133 896 931 000 $ US | 124 447 383 000 $ US | 99 550 047 000 $ US | 74 762 787 000 $ US | 82 387 243 000 $ US |
| 2017 | 126 254 167 000 $ US | 119 164 849 000 $ US | 90 020 575 000 $ US | 66 667 799 000 $ US | 73 735 334 000 $ US |
| 2016 | 118 236 226 000 $ US | 111 782 214 000 $ US | 82 837 796 000 $ US | 60 327 773 000 $ US | 67 712 471 000 $ US |
| 2015 | 126 090 209 000 $ US | 113 907 395 000 $ US | 81 552 341 000 $ US | 57 696 208 000 $ US | 64 083 976 000 $ US |
| 2014 | 127 776 387 000 $ US | 133 479 253 000 $ US | 93 045 615 000 $ US | 63 110 601 000 $ US | 71 613 560 000 $ US |
| 2013 | 119 125 993 000 $ US | 131 619 532 000 $ US | 90 491 653 000 $ US | 56 170 087 000 $ US | 70 098 925 000 $ US |
| 2012 | 112 269 321 000 $ US | 131 164 664 000 $ US | 87 342 585 000 $ US | 53 532 844 000 $ US | 71 046 413 000 $ US |
| 2011 | 103 181 346 000 $ US | 140 516 046 000 $ US | 93 448 453 000 $ US | 60 202 557 000 $ US | 85 828 428 000 $ US |
| 2010 | 87 421 805 000 $ US | 118 330 726 000 $ US | 81 730 271 000 $ US | 49 611 941 000 $ US | 77 618 191 000 $ US |
| 2009 | 76 297 833 000 $ US | 113 102 144 000 $ US | 73 105 413 000 $ US | 43 005 814 000 $ US | 70 613 653 000 $ US |
| 2008 | 105 759 527 000 $ US | 137 703 127 000 $ US | 93 291 756 000 $ US | 59 692 622 000 $ US | 91 392 830 000 $ US |
| 2007 | 100 560 788 000 $ US | 128 665 995 000 $ US | 85 550 223 000 $ US | 49 555 244 000 $ US | 89 346 505 000 $ US |
| 2006 | 98 010 962 000 $ US | 106 705 583 000 $ US | 71 001 811 000 $ US | 36 487 238 000 $ US | 74 568 764 000 $ US |
| 2005 | 86 050 473 000 $ US | 98 354 819 000 $ US | 60 942 951 000 $ US | 27 729 562 000 $ US | 67 002 331 000 $ US |
| 2004 | 80 545 783 000 $ US | 93 594 208 000 $ US | 56 566 863 000 $ US | 23 372 484 000 $ US | 65 251 082 000 $ US |
| 2003 | 69 665 327 000 $ US | 79 186 813 000 $ US | 46 411 793 000 $ US | 18 556 512 000 $ US | 55 238 627 000 $ US |
| 2002 | 63 377 330 000 $ US | 63 786 532 000 $ US | 36 352 499 000 $ US | 14 991 548 000 $ US | 43 911 295 000 $ US |
| 2001 | 59 613 961 000 $ US | 61 235 632 000 $ US | 34 007 128 000 $ US | 13 389 772 000 $ US | 41 349 910 000 $ US |
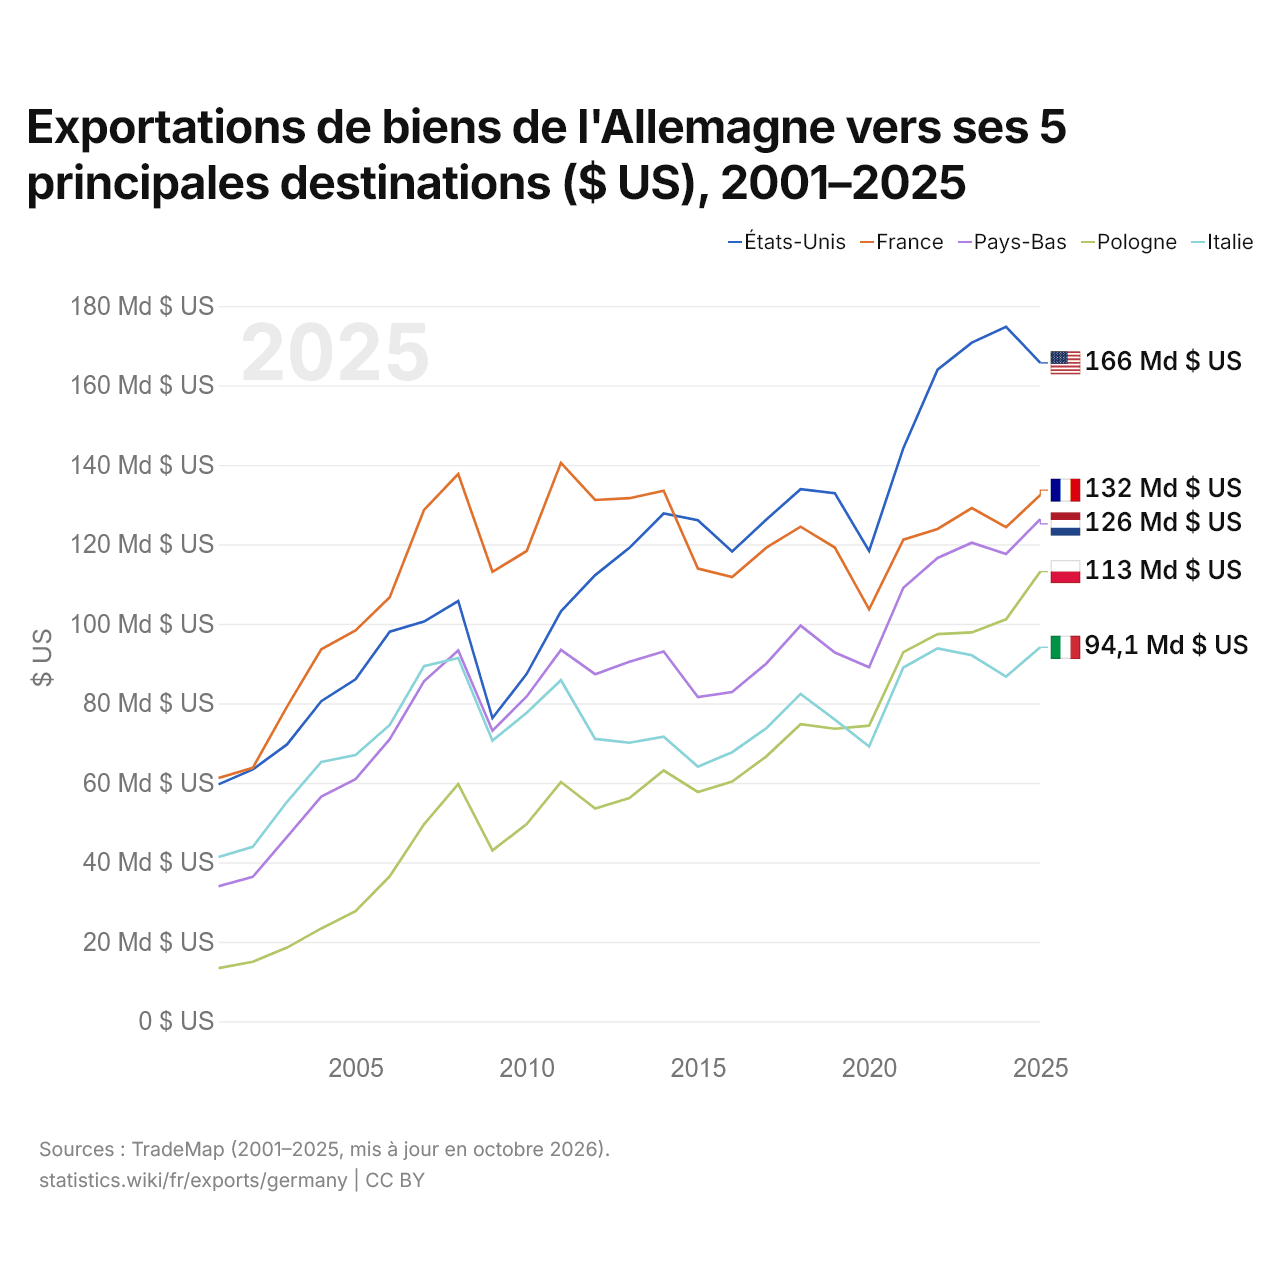
En 2025, les exportations de biens s'élevaient à 166 milliards de dollars vers les États-Unis, 132 milliards de dollars vers la France, 126 milliards de dollars vers les Pays-Bas, 113 milliards de dollars vers la Pologne et 94,1 milliards de dollars vers l'Italie. Le premier rang des cinq destinations de l'Allemagne est occupé par les États-Unis depuis 2015. Le changement le plus récent dans leur ordre remonte à 2020, quand les exportations de l'Allemagne vers la Pologne ont dépassé celles vers l'Italie.
Exportations de biens et de services de l'Allemagne ($ US), 1971–2025
| Année | $ US | |
|---|---|---|
| Biens | Services | |
| 2025 | 1 529 879 264 701 $ US | 518 047 040 038 $ US |
| 2024 | 1 473 623 529 341 $ US | 485 257 434 770 $ US |
| 2023 | 1 513 423 374 697 $ US | 459 108 772 834 $ US |
| 2022 | 1 474 852 808 355 $ US | 441 335 767 326 $ US |
| 2021 | 1 443 796 587 863 $ US | 411 642 420 612 $ US |
| 2020 | 1 213 282 444 118 $ US | 333 723 626 580 $ US |
| 2019 | 1 314 451 410 780 $ US | 366 213 965 168 $ US |
| 2018 | 1 368 953 554 636 $ US | 363 876 990 119 $ US |
| 2017 | 1 269 970 790 548 $ US | 328 351 288 854 $ US |
| 2016 | 1 177 325 469 122 $ US | 299 174 413 957 $ US |
| 2015 | 1 176 501 548 440 $ US | 286 648 345 622 $ US |
| 2014 | 1 347 670 290 092 $ US | 310 092 130 317 $ US |
| 2013 | 1 307 952 386 957 $ US | 283 635 860 099 $ US |
| 2012 | 1 277 443 693 542 $ US | 262 329 411 112 $ US |
| 2011 | 1 335 934 278 190 $ US | 261 380 144 958 $ US |
| 2010 | 1 138 008 679 193 $ US | 235 453 057 678 $ US |
| 2009 | 1 011 312 865 967 $ US | 226 918 170 910 $ US |
| 2008 | 1 322 161 852 236 $ US | 244 689 704 711 $ US |
| 2007 | 1 205 968 477 867 $ US | 214 873 160 213 $ US |
| 2006 | 1 007 037 906 889 $ US | 184 885 569 568 $ US |
| 2005 | 878 773 288 691 $ US | 162 694 880 545 $ US |
| 2004 | 818 105 967 932 $ US | 152 153 467 399 $ US |
| 2003 | 674 515 824 605 $ US | 120 436 954 898 $ US |
| 2002 | 558 208 527 547 $ US | 99 397 216 349 $ US |
| 2001 | 519 011 563 541 $ US | 83 126 002 343 $ US |
| 2000 | 501 929 316 698 $ US | 81 707 766 690 $ US |
| 1999 | 496 438 659 824 $ US | 80 635 745 919 $ US |
| 1998 | 497 040 066 080 $ US | 82 110 297 546 $ US |
| 1997 | 471 906 870 331 $ US | 77 323 595 278 $ US |
| 1996 | 484 449 564 882 $ US | 75 518 642 236 $ US |
| 1995 | 484 122 019 159 $ US | 74 800 423 599 $ US |
| 1994 | 396 989 409 477 $ US | 62 285 723 238 $ US |
| 1993 | 353 460 363 214 $ US | 61 043 592 864 $ US |
| 1992 | 408 936 381 199 $ US | 65 269 110 772 $ US |
| 1991 | 383 562 175 516 $ US | 60 168 574 063 $ US |
| 1990 | 396 019 650 291 $ US | 61 330 285 662 $ US |
| 1989 | 328 367 734 961 $ US | 50 137 247 467 $ US |
| 1988 | 310 887 919 198 $ US | 47 331 790 490 $ US |
| 1987 | 279 970 503 603 $ US | 46 131 470 395 $ US |
| 1986 | 233 517 543 920 $ US | 38 393 586 093 $ US |
| 1985 | 177 245 975 367 $ US | 30 038 546 006 $ US |
| 1984 | 164 764 694 240 $ US | 28 327 890 127 $ US |
| 1983 | 162 915 005 655 $ US | 29 253 321 331 $ US |
| 1982 | 170 650 666 322 $ US | 30 677 717 690 $ US |
| 1981 | 170 205 869 481 $ US | 29 497 073 667 $ US |
| 1980 | 185 925 576 749 $ US | 31 465 144 531 $ US |
| 1979 | 171 637 865 300 $ US | 26 847 732 617 $ US |
| 1978 | 142 715 506 243 $ US | 23 143 346 007 $ US |
| 1977 | 118 007 190 940 $ US | 18 605 047 062 $ US |
| 1976 | 102 643 268 391 $ US | 16 349 314 012 $ US |
| 1975 | 91 285 823 046 $ US | 11 343 063 973 $ US |
| 1974 | 90 141 425 706 $ US | 9 028 328 399 $ US |
| 1973 | 66 988 467 585 $ US | 8 084 222 376 $ US |
| 1972 | 46 454 007 358 $ US | 6 447 050 309 $ US |
| 1971 | 38 654 323 006 $ US | 5 526 248 184 $ US |
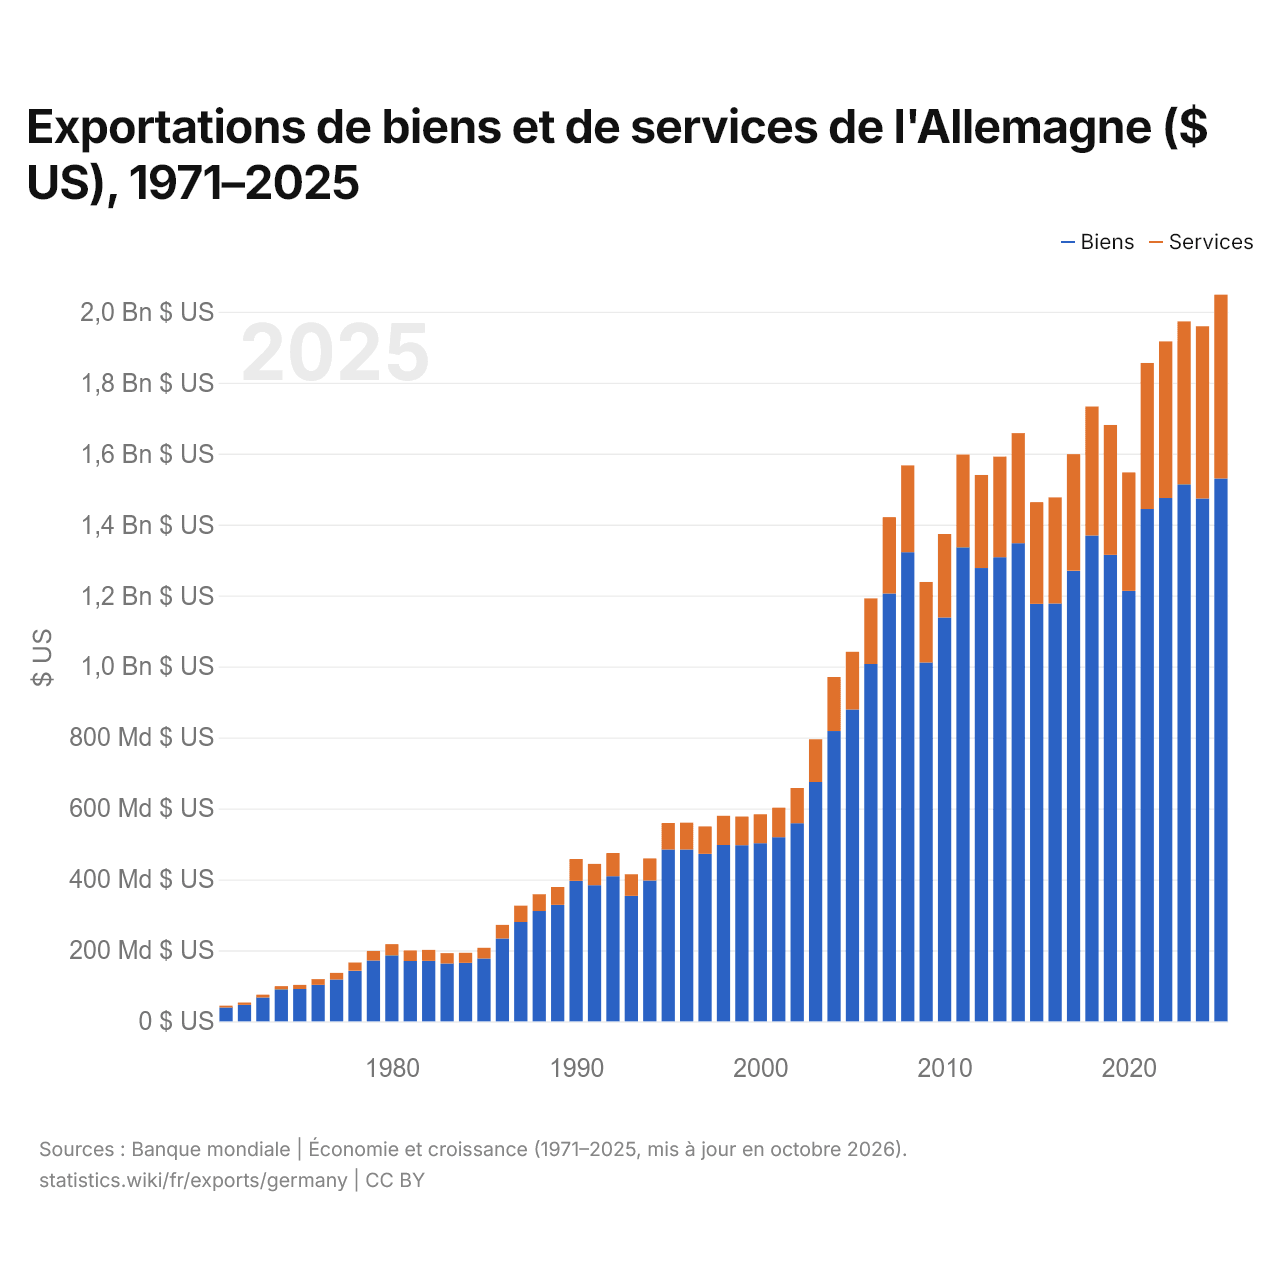
En 2025, les exportations de biens de l'Allemagne s'élevaient à 1,53 billion de dollars et celles de services à 518 milliards de dollars ; les services représentaient 25,3 % du total, contre 12,5 % en 1971.
L'Allemagne dans le classement mondial des exportations, 2025
| Rang | Pays | Exportations | Part mondiale | |
|---|---|---|---|---|
| 1 |
Chine
|
4,11 Bn $US | 11,8 % | vs Chine |
| 2 |
États-Unis
|
3,43 Bn $US | 9,83 % | vs USA |
| 3 |
 Allemagne |
2,04 Bn $US | 5,85 % | |
| 4 |
Royaume-Uni
|
1,22 Bn $US | 3,51 % | vs R.-U. |
| 5 |
France
|
1,12 Bn $US | 3,22 % | vs France |
| 6 |
Pays-Bas
|
1,08 Bn $US | 3,08 % | vs Pays-Bas |
| 7 |
 Singapour |
1,07 Bn $US | 3,08 % |
Exportations de biens et services de l'Allemagne, % du PIB, 1970–2025
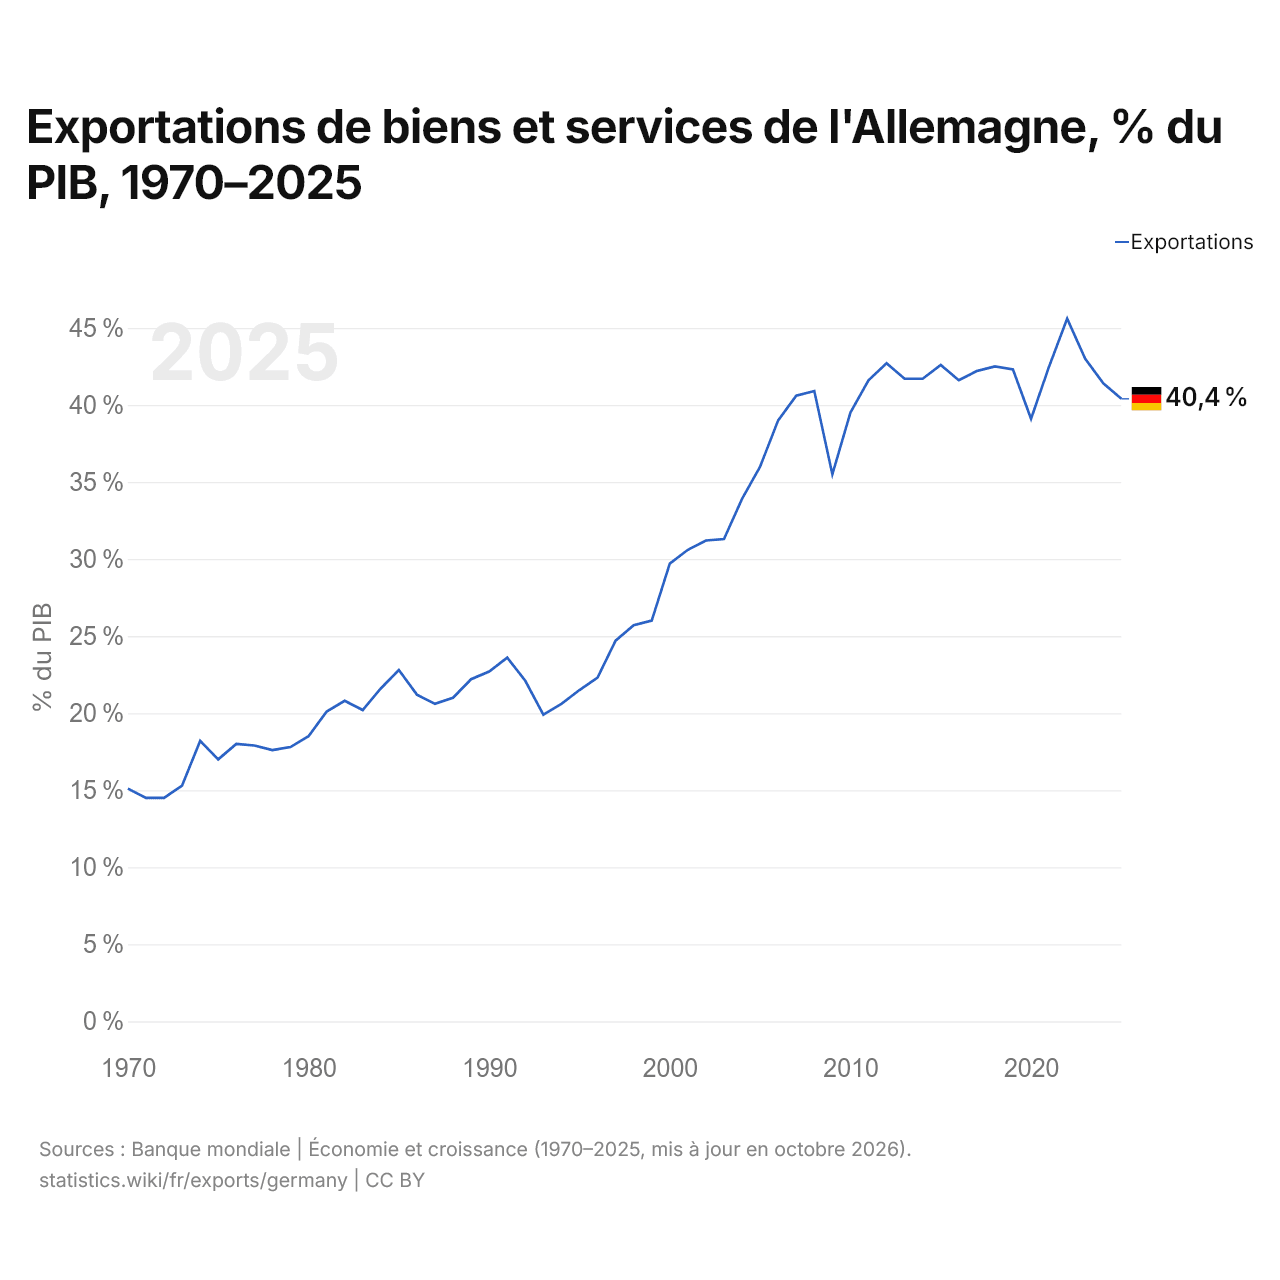
En 2025, les exportations de biens et services de l'Allemagne équivalaient à 40,4 % de son PIB, contre 15,1 % en 1970. La part la plus élevée a été de 45,6 %, en 2022.
Comparer les exportations de l'Allemagne avec celles d'autres pays
Sources :
- TradeMap (2001–2025, mis à jour en octobre 2026)
- Banque mondiale | Économie et croissance (1970–2025, mis à jour en octobre 2026)
Creative Commons Attribution (CC BY) : vous pouvez copier, partager, adapter et réutiliser ce contenu, y compris à des fins commerciales, à condition de citer statistics.wiki et d’indiquer les modifications apportées. Les sources citées ci-dessus peuvent avoir leurs propres conditions de licence.