
Exportations de biens et services du Canada par année ($ US), 1961–2025
| Année | $ US | Rang mondial |
|---|---|---|
| Exportations | Rang mondial | |
| 2025 | 726 879 970 410 $ US | #14 |
| 2024 | 737 073 649 329 $ US | #13 |
| 2023 | 732 380 673 864 $ US | #13 |
| 2022 | 742 056 361 163 $ US | #12 |
| 2021 | 630 478 158 310 $ US | #13 |
| 2020 | 487 990 676 643 $ US | #13 |
| 2019 | 564 142 104 615 $ US | #11 |
| 2018 | 557 719 627 178 $ US | #11 |
| 2017 | 518 766 780 220 $ US | #11 |
| 2016 | 481 357 649 980 $ US | #11 |
| 2015 | 495 747 450 358 $ US | #11 |
| 2014 | 573 083 180 254 $ US | #11 |
| 2013 | 560 108 797 443 $ US | #12 |
| 2012 | 554 964 544 783 $ US | #12 |
| 2011 | 550 163 771 962 $ US | #12 |
| 2010 | 471 736 717 163 $ US | #11 |
| 2009 | 391 985 828 012 $ US | #10 |
| 2008 | 534 150 890 347 $ US | #9 |
| 2007 | 502 770 691 742 $ US | #9 |
| 2006 | 467 052 186 178 $ US | #9 |
| 2005 | 432 369 202 839 $ US | #9 |
| 2004 | 383 240 584 166 $ US | #9 |
| 2003 | 330 149 882 235 $ US | #9 |
| 2002 | 304 705 919 837 $ US | #8 |
| 2001 | 310 667 613 636 $ US | #6 |
| 2000 | 329 258 635 782 $ US | #6 |
| 1999 | 283 991 384 533 $ US | #7 |
| 1998 | 253 784 967 981 $ US | #8 |
| 1997 | 249 765 997 400 $ US | #8 |
| 1996 | 233 945 727 906 $ US | #8 |
| 1995 | 218 740 163 218 $ US | #8 |
| 1994 | 190 114 967 780 $ US | #8 |
| 1993 | 168 751 259 592 $ US | #8 |
| 1992 | 155 724 331 927 $ US | #9 |
| 1991 | 149 170 812 604 $ US | #8 |
| 1990 | 149 461 775 797 $ US | #8 |
| 1989 | 142 065 878 378 $ US | #8 |
| 1988 | 132 708 214 837 $ US | #8 |
| 1987 | 112 629 713 424 $ US | #8 |
| 1986 | 102 284 994 602 $ US | #8 |
| 1985 | 100 872 940 315 $ US | #6 |
| 1984 | 99 654 852 907 $ US | #6 |
| 1983 | 85 210 159 039 $ US | #7 |
| 1982 | 79 268 055 443 $ US | #8 |
| 1981 | 81 065 977 146 $ US | #9 |
| 1980 | 75 584 160 109 $ US | #9 |
| 1979 | 64 212 907 632 $ US | #8 |
| 1978 | 53 813 447 883 $ US | #8 |
| 1977 | 48 202 162 670 $ US | #8 |
| 1976 | 44 942 190 669 $ US | #8 |
| 1975 | 38 302 202 123 $ US | #8 |
| 1974 | 38 617 586 912 $ US | #7 |
| 1973 | 29 896 010 399 $ US | #7 |
| 1972 | 24 070 108 092 $ US | #6 |
| 1971 | 20 913 052 090 $ US | #6 |
| 1970 | 19 265 001 436 $ US | #6 |
| 1969 | 16 551 276 495 $ US | - |
| 1968 | 15 002 668 948 $ US | - |
| 1967 | 13 131 449 205 $ US | - |
| 1966 | 11 675 300 777 $ US | - |
| 1965 | 9 996 446 867 $ US | - |
| 1964 | 9 398 224 064 $ US | - |
| 1963 | 8 094 515 611 $ US | - |
| 1962 | 7 439 414 166 $ US | - |
| 1961 | 7 215 712 237 $ US | - |
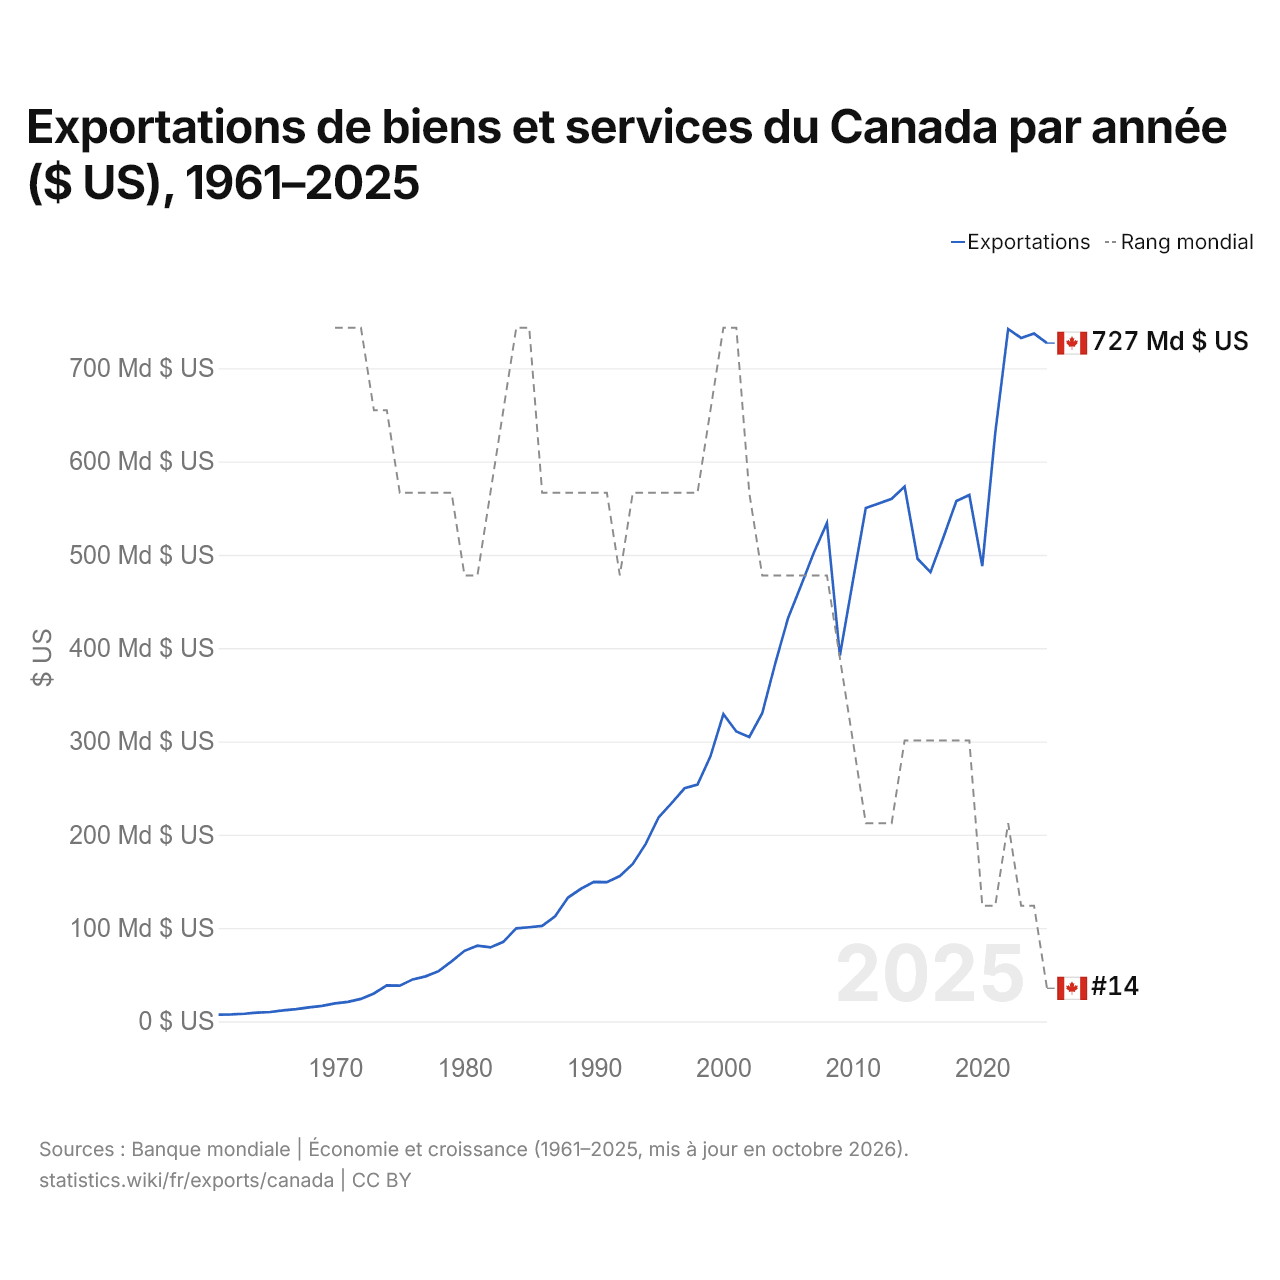
En 2025, les exportations de biens et services du Canada s'élevaient à 727 milliards de dollars, contre 7,22 milliards de dollars en 1961. Le maximum a été de 742 milliards de dollars, en 2022. Elles se classaient au 14e rang mondial, en baisse par rapport au 13e rang en 2024. Leur meilleur rang a été le 6e, occupé pour la dernière fois en 2001.
En 2025, les exportations de biens et services du Canada étaient les plus faibles des deux pays situés en Amérique du Nord. Les importations de biens et services du Canada s'élevaient à 747 milliards de dollars en 2025, au 12e rang mondial. En 2025, les importations du Canada dépassaient ses exportations de 19,6 milliards de dollars, soit un déficit commercial.
Exportations de biens du Canada par catégorie, 2025
Exportations de biens, 2025: 557 Md $US
En 2025, la première catégorie des exportations de biens du Canada était « pétrole, gaz, minerais et autres matières premières », avec 30,4 %, suivie de « machines, électronique et véhicules », avec 24,2 %.
Destinations des exportations de biens du Canada : les 10 premières, 2025
| Rang | Pays | Exportations de biens | Part | |
|---|---|---|---|---|
| 1 |
 États-Unis |
404 Md $US | 72,6 % | vs USA |
| 2 |
 Royaume-Uni |
33,4 Md $US | 5,99 % | vs R.-U. |
| 3 |
 Chine |
24,4 Md $US | 4,38 % | vs Chine |
| 4 |
 Japon |
10,4 Md $US | 1,87 % | vs Japon |
| 5 |
 Pays-Bas |
6,79 Md $US | 1,22 % | vs Pays-Bas |
| 6 |
 Allemagne |
6,53 Md $US | 1,17 % | vs Allemagne |
| 7 |
 Mexique |
6,35 Md $US | 1,14 % | vs Mexique |
| 8 |
 Corée du Sud |
5,06 Md $US | 0,91 % | vs Corée du Sud |
| 9 |
 France |
3,59 Md $US | 0,64 % | vs France |
| 10 |
 Italie |
2,80 Md $US | 0,5 % | vs Italie |
| Autres partenaires et non précisés | 53,6 Md $US | 9,62 % |
Exportations de biens du Canada vers ses 5 principales destinations ($ US), 2001–2025
| Année | $ US | ||||
|---|---|---|---|---|---|
| États-Unis | Royaume-Uni | Chine | Japon | Pays-Bas | |
| 2025 | 404 214 299 000 $ US | 33 369 072 000 $ US | 24 426 894 000 $ US | 10 407 716 000 $ US | 6 788 521 000 $ US |
| 2024 | 435 173 063 000 $ US | 20 680 842 000 $ US | 21 758 972 000 $ US | 10 916 024 000 $ US | 5 137 259 000 $ US |
| 2023 | 440 950 420 000 $ US | 10 502 812 000 $ US | 22 599 346 000 $ US | 11 732 284 000 $ US | 5 503 142 000 $ US |
| 2022 | 460 541 708 000 $ US | 14 225 403 000 $ US | 22 067 823 000 $ US | 13 836 177 000 $ US | 4 983 147 000 $ US |
| 2021 | 379 998 644 000 $ US | 13 162 632 000 $ US | 22 415 275 000 $ US | 11 575 900 000 $ US | 3 837 790 000 $ US |
| 2020 | 285 718 621 000 $ US | 14 868 072 000 $ US | 18 876 294 000 $ US | 9 252 289 000 $ US | 4 063 703 000 $ US |
| 2019 | 336 175 533 000 $ US | 14 923 882 000 $ US | 17 547 713 000 $ US | 9 507 517 000 $ US | 3 905 811 000 $ US |
| 2018 | 338 049 252 000 $ US | 12 820 778 000 $ US | 21 381 376 000 $ US | 10 002 483 000 $ US | 3 668 092 000 $ US |
| 2017 | 319 343 226 000 $ US | 13 700 288 000 $ US | 18 204 246 000 $ US | 9 126 507 000 $ US | 2 422 983 000 $ US |
| 2016 | 297 633 759 000 $ US | 12 910 230 000 $ US | 15 835 954 000 $ US | 8 094 030 000 $ US | 2 146 757 000 $ US |
| 2015 | 315 164 419 000 $ US | 12 501 949 000 $ US | 15 814 577 000 $ US | 7 662 240 000 $ US | 2 788 178 000 $ US |
| 2014 | 364 959 373 000 $ US | 13 764 189 000 $ US | 17 447 756 000 $ US | 9 725 092 000 $ US | 3 475 104 000 $ US |
| 2013 | 346 035 155 000 $ US | 13 556 428 000 $ US | 19 900 000 000 $ US | 10 325 007 000 $ US | 3 481 968 000 $ US |
| 2012 | 338 260 043 000 $ US | 18 776 318 000 $ US | 19 383 182 000 $ US | 10 350 578 000 $ US | 4 562 424 000 $ US |
| 2011 | 331 755 016 000 $ US | 18 976 766 000 $ US | 16 984 616 000 $ US | 10 776 245 000 $ US | 4 851 323 000 $ US |
| 2010 | 289 418 959 000 $ US | 15 899 871 000 $ US | 12 854 414 000 $ US | 8 932 610 000 $ US | 3 172 537 000 $ US |
| 2009 | 236 480 912 000 $ US | 10 588 184 000 $ US | 9 797 290 000 $ US | 7 299 595 000 $ US | 2 419 940 000 $ US |
| 2008 | 353 782 675 000 $ US | 12 268 164 000 $ US | 9 881 454 000 $ US | 10 464 782 000 $ US | 3 489 347 000 $ US |
| 2007 | 331 601 972 000 $ US | 11 929 630 000 $ US | 8 873 347 000 $ US | 8 603 085 000 $ US | 3 768 904 000 $ US |
| 2006 | 316 556 507 000 $ US | 8 937 980 000 $ US | 6 879 498 000 $ US | 8 306 151 000 $ US | 2 701 045 000 $ US |
| 2005 | 302 195 424 000 $ US | 6 823 033 000 $ US | 5 961 766 000 $ US | 7 578 135 000 $ US | 1 814 404 000 $ US |
| 2004 | 267 804 200 000 $ US | 5 953 335 000 $ US | 5 209 106 000 $ US | 6 587 074 000 $ US | 1 483 759 000 $ US |
| 2003 | 233 380 458 000 $ US | 4 351 083 000 $ US | 3 436 397 000 $ US | 5 853 852 000 $ US | 1 158 868 000 $ US |
| 2002 | 220 072 351 000 $ US | 2 823 886 000 $ US | 2 633 770 000 $ US | 5 328 024 000 $ US | 1 130 999 000 $ US |
| 2001 | 227 244 275 000 $ US | 3 268 685 000 $ US | 2 755 225 000 $ US | 5 388 451 000 $ US | 1 005 486 000 $ US |
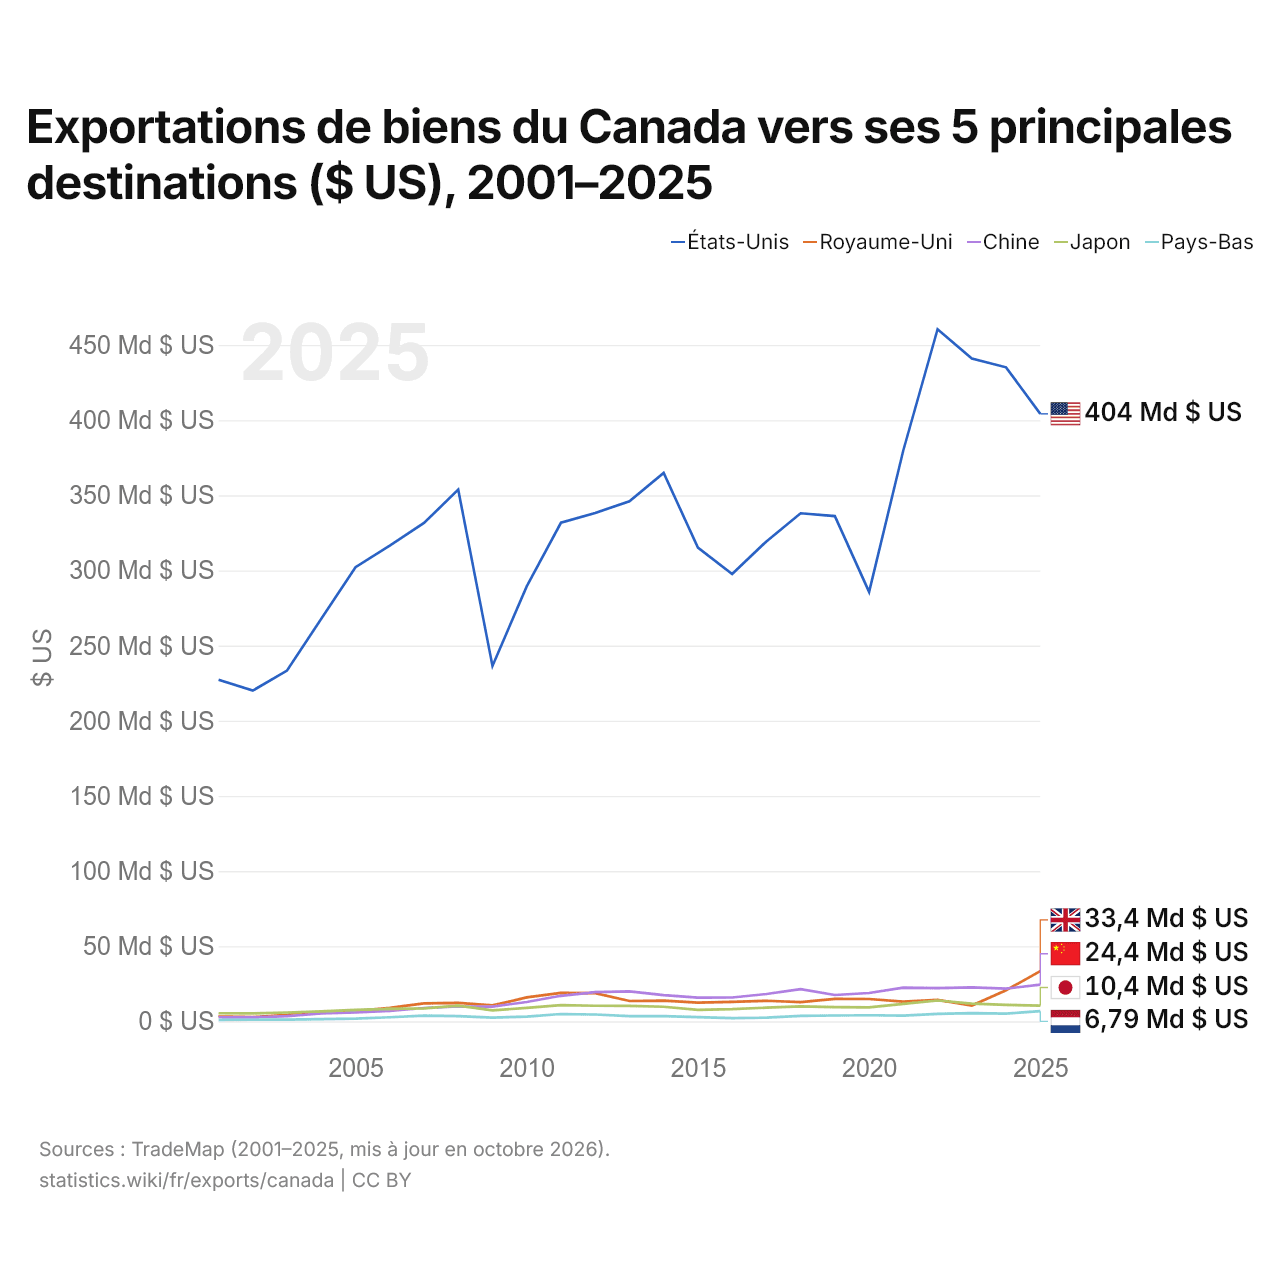
En 2025, les exportations de biens s'élevaient à 404 milliards de dollars vers les États-Unis, 33,4 milliards de dollars vers le Royaume-Uni, 24,4 milliards de dollars vers la Chine, 10,4 milliards de dollars vers le Japon et 6,79 milliards de dollars vers les Pays-Bas. Le premier rang des cinq destinations du Canada est occupé par les États-Unis chaque année depuis 2001. Le changement le plus récent dans leur ordre remonte à 2025, quand les exportations du Canada vers le Royaume-Uni ont dépassé celles vers la Chine.
Exportations de biens et de services du Canada ($ US), 1960–2025
| Année | $ US | |
|---|---|---|
| Biens | Services | |
| 2025 | 554 576 819 644 $ US | 172 053 214 974 $ US |
| 2024 | 567 753 160 192 $ US | 169 205 668 943 $ US |
| 2023 | 570 210 817 086 $ US | 162 130 820 486 $ US |
| 2022 | 601 657 054 135 $ US | 140 705 329 651 $ US |
| 2021 | 509 330 058 840 $ US | 121 156 677 292 $ US |
| 2020 | 390 557 430 210 $ US | 98 528 945 535 $ US |
| 2019 | 448 868 947 495 $ US | 115 259 270 753 $ US |
| 2018 | 452 322 709 541 $ US | 105 333 436 375 $ US |
| 2017 | 424 110 971 709 $ US | 94 753 221 151 $ US |
| 2016 | 394 137 180 748 $ US | 87 478 688 097 $ US |
| 2015 | 411 129 878 291 $ US | 85 007 381 297 $ US |
| 2014 | 480 470 343 578 $ US | 92 835 162 818 $ US |
| 2013 | 466 456 953 334 $ US | 93 625 570 158 $ US |
| 2012 | 462 921 555 286 $ US | 92 039 910 125 $ US |
| 2011 | 461 444 583 690 $ US | 85 332 373 496 $ US |
| 2010 | 392 358 819 094 $ US | 76 929 188 987 $ US |
| 2009 | 323 035 491 535 $ US | 69 106 139 075 $ US |
| 2008 | 460 228 612 615 $ US | 75 491 106 960 $ US |
| 2007 | 430 510 292 428 $ US | 71 144 437 729 $ US |
| 2006 | 398 505 186 169 $ US | 66 374 927 570 $ US |
| 2005 | 370 564 797 070 $ US | 60 288 780 506 $ US |
| 2004 | 328 561 164 731 $ US | 53 165 123 526 $ US |
| 2003 | 283 881 204 986 $ US | 45 262 535 796 $ US |
| 2002 | 262 513 104 539 $ US | 40 825 598 598 $ US |
| 2001 | 270 783 696 905 $ US | 38 966 453 701 $ US |
| 2000 | 288 048 191 647 $ US | 40 179 700 358 $ US |
| 1999 | 247 714 131 434 $ US | 35 534 594 598 $ US |
| 1998 | 219 948 407 476 $ US | 33 038 911 821 $ US |
| 1997 | 218 461 779 156 $ US | 30 494 861 780 $ US |
| 1996 | 204 868 220 740 $ US | 28 396 648 955 $ US |
| 1995 | 192 930 925 885 $ US | 25 235 438 124 $ US |
| 1994 | 166 570 431 580 $ US | 22 815 615 611 $ US |
| 1993 | 146 957 364 482 $ US | 21 141 890 777 $ US |
| 1992 | 134 790 949 525 $ US | 20 208 362 766 $ US |
| 1991 | 128 583 092 361 $ US | 19 988 983 209 $ US |
| 1990 | 130 075 211 365 $ US | 18 876 609 592 $ US |
| 1989 | 123 871 000 961 $ US | 17 712 920 304 $ US |
| 1988 | 116 465 317 558 $ US | 15 928 386 851 $ US |
| 1987 | 98 987 111 033 $ US | 13 351 330 202 $ US |
| 1986 | 89 951 366 696 $ US | 12 092 593 006 $ US |
| 1985 | 89 801 761 689 $ US | 10 826 730 602 $ US |
| 1984 | 89 158 157 415 $ US | 10 252 504 179 $ US |
| 1983 | 75 306 067 297 $ US | 9 716 985 925 $ US |
| 1982 | 70 174 662 833 $ US | 8 929 790 552 $ US |
| 1981 | 71 859 350 595 $ US | 9 114 481 532 $ US |
| 1980 | 67 531 310 803 $ US | 7 444 802 542 $ US |
| 1979 | 57 299 865 662 $ US | 6 495 195 332 $ US |
| 1978 | 47 942 856 261 $ US | 5 468 892 677 $ US |
| 1977 | 42 883 528 290 $ US | 5 002 088 517 $ US |
| 1976 | 39 695 893 066 $ US | 5 017 422 783 $ US |
| 1975 | 33 780 119 811 $ US | 4 312 563 916 $ US |
| 1974 | 34 277 367 068 $ US | 4 163 525 103 $ US |
| 1973 | 26 499 925 875 $ US | 3 232 892 912 $ US |
| 1972 | 21 158 684 706 $ US | 2 787 383 944 $ US |
| 1971 | 18 174 887 930 $ US | 2 642 291 586 $ US |
| 1970 | 16 742 605 365 $ US | 2 478 392 136 $ US |
| 1969 | 14 372 349 203 $ US | 2 114 239 980 $ US |
| 1968 | 13 131 160 390 $ US | 1 832 295 910 $ US |
| 1967 | 10 936 088 117 $ US | 2 156 569 593 $ US |
| 1966 | 10 031 247 974 $ US | 1 605 113 029 $ US |
| 1965 | 8 578 330 842 $ US | 1 377 625 201 $ US |
| 1964 | 8 115 105 073 $ US | 1 243 835 549 $ US |
| 1963 | 6 928 813 889 $ US | 1 130 715 409 $ US |
| 1962 | 6 356 009 353 $ US | 1 047 790 226 $ US |
| 1961 | 6 185 996 486 $ US | 992 152 824 $ US |
| 1960 | 5 793 020 936 $ US | 1 142 205 243 $ US |
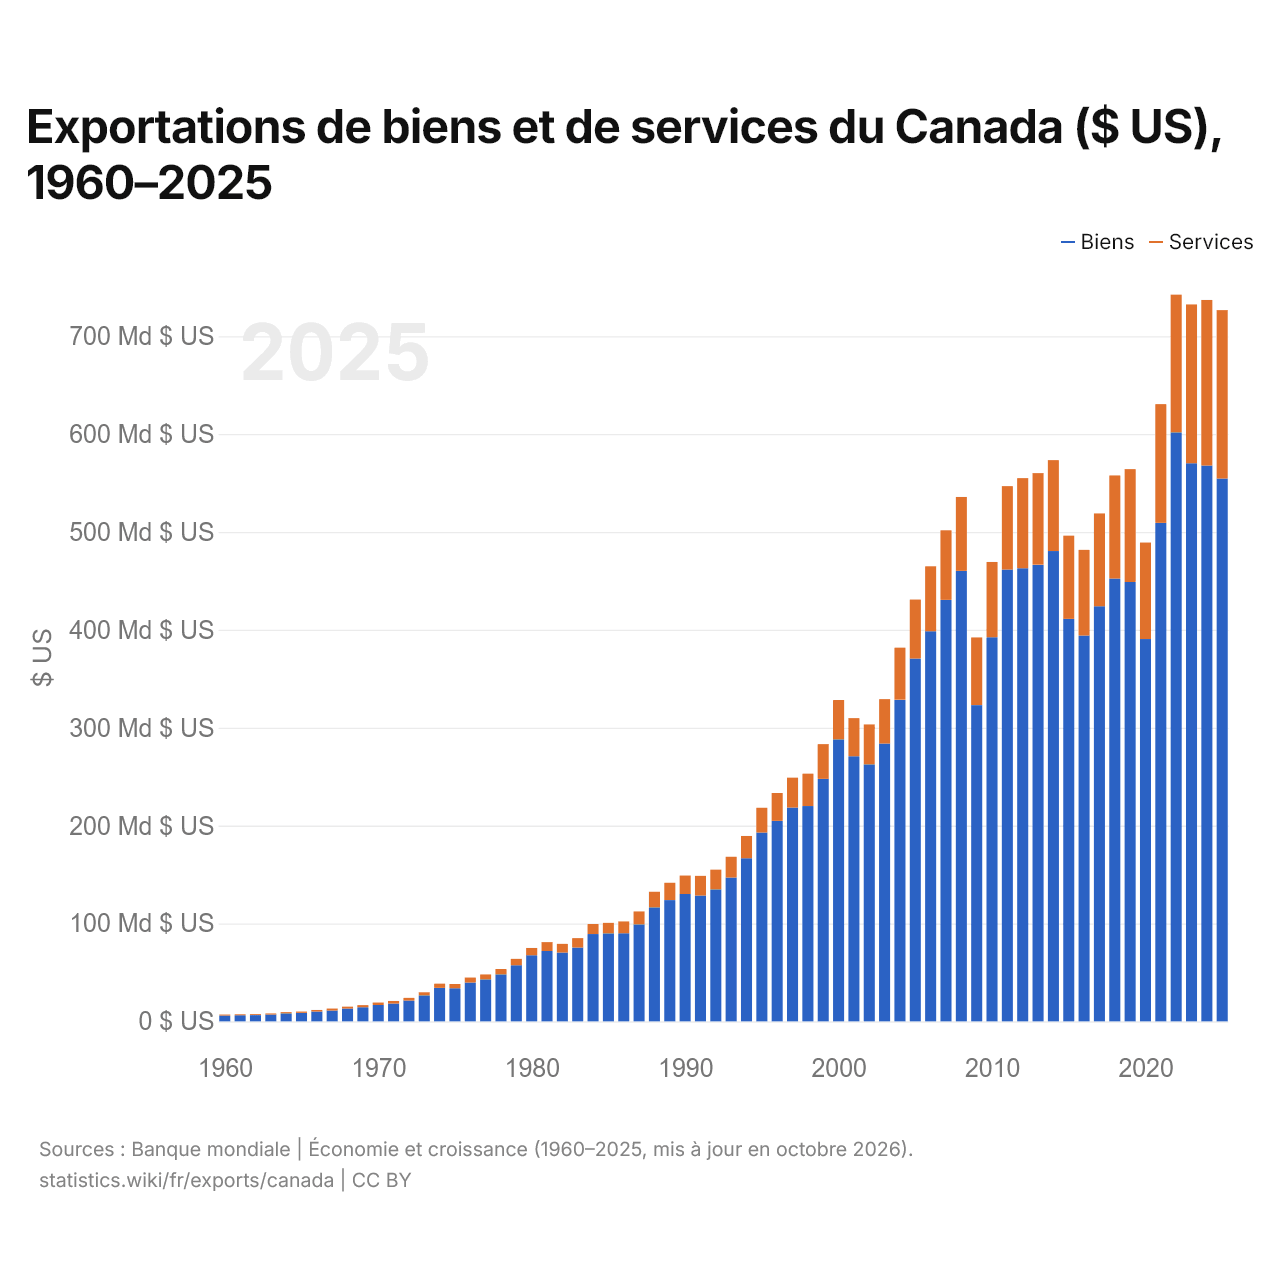
En 2025, les exportations de biens du Canada s'élevaient à 555 milliards de dollars et celles de services à 172 milliards de dollars ; les services représentaient 23,7 % du total, contre 16,5 % en 1960.
Le Canada dans le classement mondial des exportations, 2025
| Rang | Pays | Exportations | Part mondiale | |
|---|---|---|---|---|
| 11 |
Corée du Sud
|
857 Md $US | 2,46 % | vs Corée du Sud |
| 12 |
Italie
|
822 Md $US | 2,36 % | vs Italie |
| 13 |
 Suisse |
815 Md $US | 2,33 % | vs Suisse |
| 14 |
 Canada |
727 Md $US | 2,08 % | |
| 15 |
Mexique
|
727 Md $US | 2,08 % | vs Mexique |
| 16 |
 Espagne |
698 Md $US | 2 % | vs Espagne |
| 17 |
 Taïwan |
679 Md $US | 1,94 % | vs Taïwan |
Exportations de biens et services du Canada, % du PIB, 1961–2025
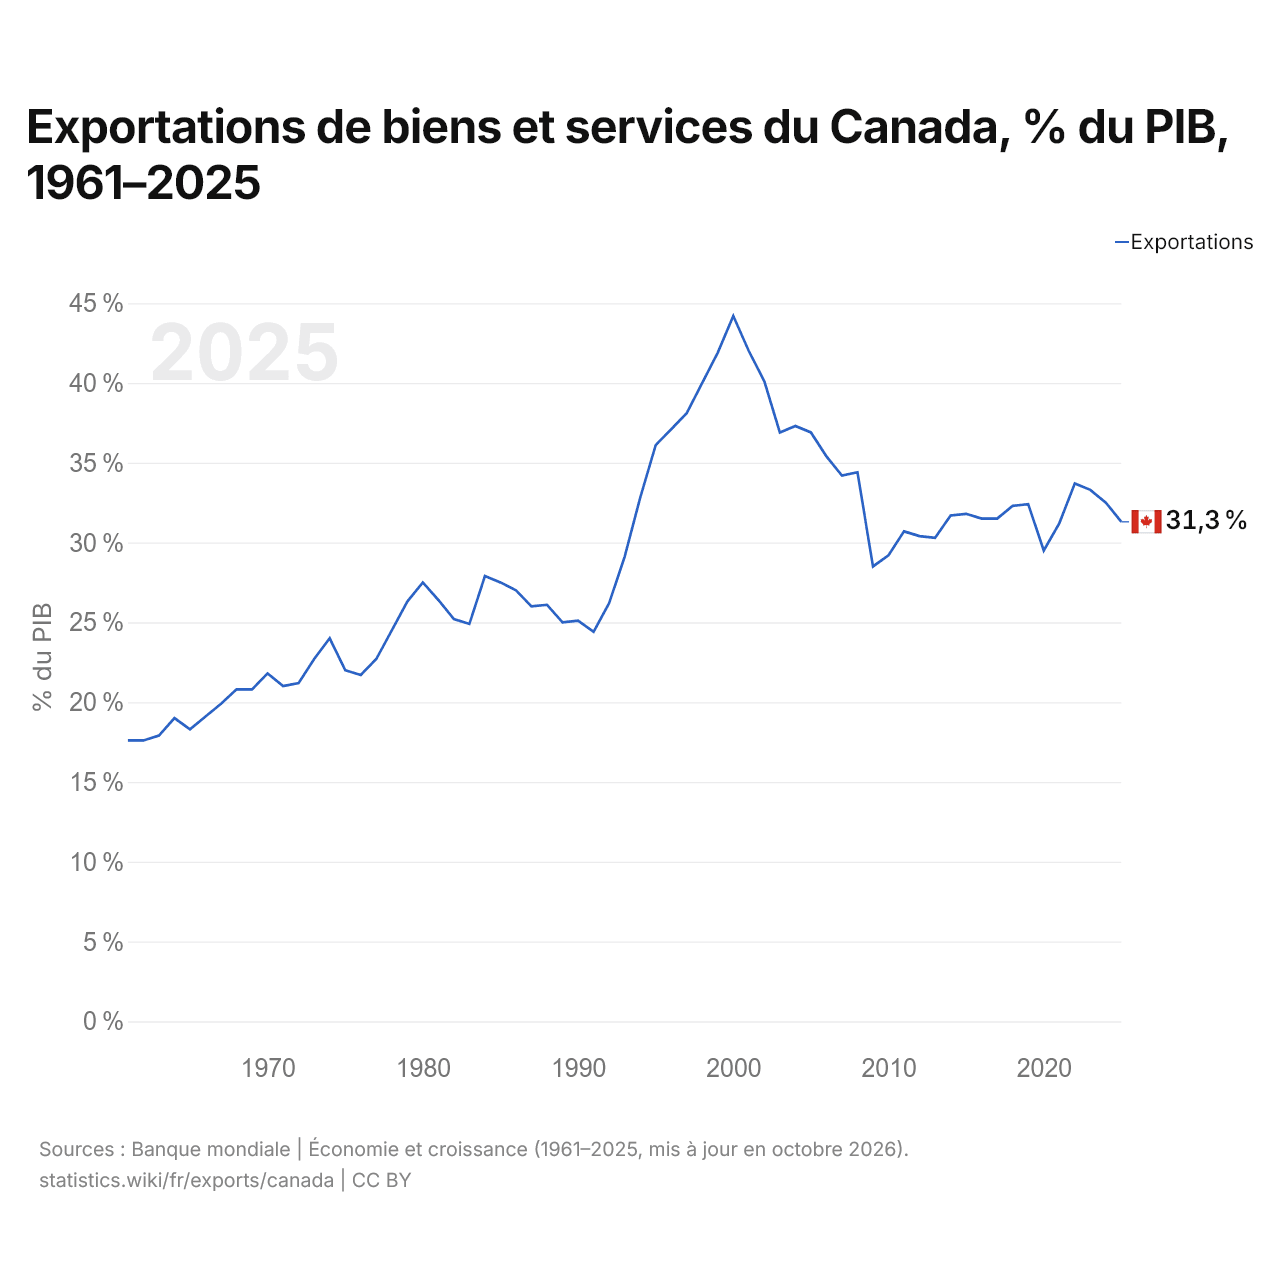
En 2025, les exportations de biens et services du Canada équivalaient à 31,3 % de son PIB, contre 17,6 % en 1961. La part la plus élevée a été de 44,2 %, en 2000.
Comparer les exportations du Canada avec celles d'autres pays
Sources :
- Banque mondiale | Économie et croissance (1960–2025, mis à jour en octobre 2026)
- TradeMap (2001–2025, mis à jour en octobre 2026)
Creative Commons Attribution (CC BY) : vous pouvez copier, partager, adapter et réutiliser ce contenu, y compris à des fins commerciales, à condition de citer statistics.wiki et d’indiquer les modifications apportées. Les sources citées ci-dessus peuvent avoir leurs propres conditions de licence.