
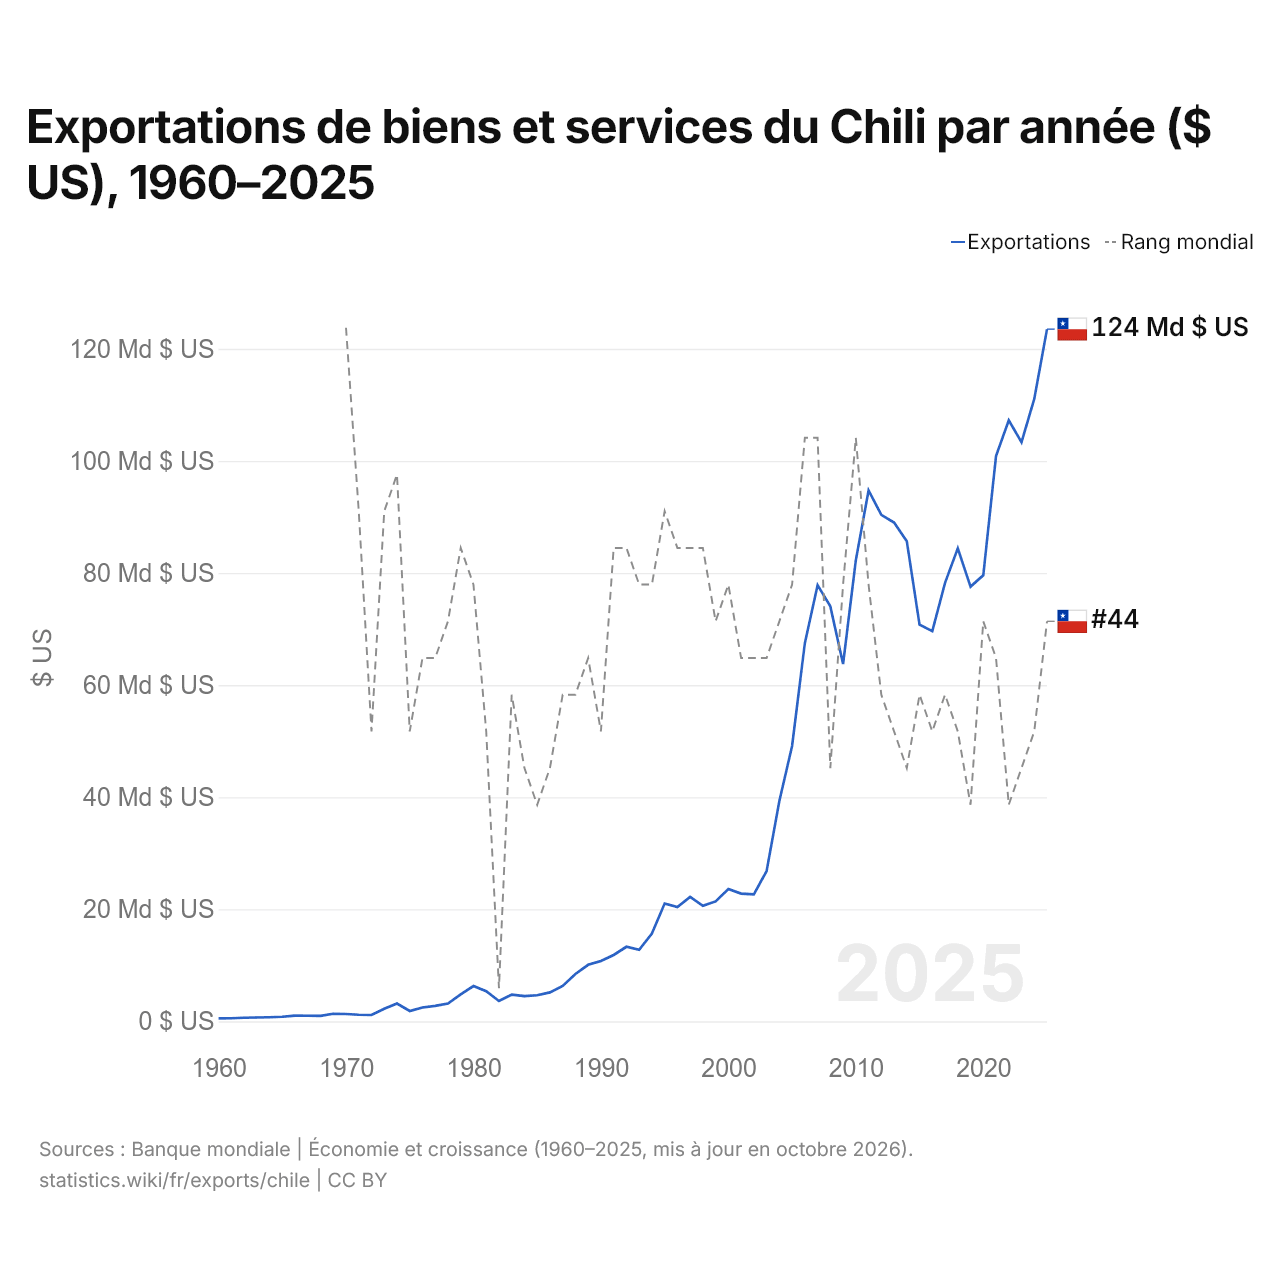
Exportations de biens et services du Chili par année ($ US), 1960–2025
| Année | $ US | Rang mondial |
|---|---|---|
| Exportations | Rang mondial | |
| 2025 | 123 520 198 503 $ US | #44 |
| 2024 | 111 066 428 902 $ US | #47 |
| 2023 | 103 343 502 222 $ US | #48 |
| 2022 | 107 256 627 766 $ US | #49 |
| 2021 | 100 881 456 526 $ US | #45 |
| 2020 | 79 592 398 711 $ US | #44 |
| 2019 | 77 571 036 969 $ US | #49 |
| 2018 | 84 405 337 955 $ US | #47 |
| 2017 | 78 238 304 190 $ US | #46 |
| 2016 | 69 624 959 647 $ US | #47 |
| 2015 | 70 773 875 084 $ US | #46 |
| 2014 | 85 665 253 039 $ US | #48 |
| 2013 | 89 009 023 666 $ US | #47 |
| 2012 | 90 376 117 071 $ US | #46 |
| 2011 | 94 745 538 460 $ US | #43 |
| 2010 | 82 271 077 297 $ US | #39 |
| 2009 | 63 756 458 033 $ US | #43 |
| 2008 | 74 049 222 066 $ US | #48 |
| 2007 | 77 844 966 314 $ US | #39 |
| 2006 | 67 484 496 355 $ US | #39 |
| 2005 | 49 132 371 504 $ US | #43 |
| 2004 | 39 319 047 777 $ US | #44 |
| 2003 | 26 819 043 116 $ US | #45 |
| 2002 | 22 665 229 050 $ US | #45 |
| 2001 | 22 794 630 056 $ US | #45 |
| 2000 | 23 598 874 231 $ US | #43 |
| 1999 | 21 395 654 975 $ US | #44 |
| 1998 | 20 615 225 914 $ US | #42 |
| 1997 | 22 188 168 722 $ US | #42 |
| 1996 | 20 392 925 082 $ US | #42 |
| 1995 | 21 024 502 601 $ US | #41 |
| 1994 | 15 653 663 029 $ US | #43 |
| 1993 | 12 755 908 986 $ US | #43 |
| 1992 | 13 307 830 022 $ US | #42 |
| 1991 | 11 846 241 659 $ US | #42 |
| 1990 | 10 767 995 923 $ US | #47 |
| 1989 | 10 088 686 694 $ US | #45 |
| 1988 | 8 456 927 621 $ US | #46 |
| 1987 | 6 306 734 128 $ US | #46 |
| 1986 | 5 162 723 063 $ US | #48 |
| 1985 | 4 651 072 800 $ US | #49 |
| 1984 | 4 485 352 694 $ US | #48 |
| 1983 | 4 769 390 034 $ US | #46 |
| 1982 | 3 635 010 932 $ US | #54 |
| 1981 | 5 363 825 291 $ US | #47 |
| 1980 | 6 292 627 054 $ US | #43 |
| 1979 | 4 825 253 306 $ US | #42 |
| 1978 | 3 169 461 902 $ US | #44 |
| 1977 | 2 755 061 055 $ US | #45 |
| 1976 | 2 475 236 058 $ US | #45 |
| 1975 | 1 837 775 113 $ US | #47 |
| 1974 | 3 166 203 510 $ US | #40 |
| 1973 | 2 238 225 385 $ US | #41 |
| 1972 | 1 131 291 625 $ US | #47 |
| 1971 | 1 178 754 034 $ US | #41 |
| 1970 | 1 312 710 942 $ US | #36 |
| 1969 | 1 344 218 032 $ US | - |
| 1968 | 985 246 219 $ US | - |
| 1967 | 991 413 773 $ US | - |
| 1966 | 1 027 139 444 $ US | - |
| 1965 | 811 080 139 $ US | - |
| 1964 | 730 563 069 $ US | - |
| 1963 | 687 611 591 $ US | - |
| 1962 | 639 219 282 $ US | - |
| 1961 | 550 751 429 $ US | - |
| 1960 | 536 609 091 $ US | - |
En 2025, les exportations de biens et services du Chili s'élevaient à 124 milliards de dollars, contre 537 millions de dollars en 1960. Elles se classaient au 44e rang mondial, en hausse par rapport au 47e rang en 2024. Leur meilleur rang a été le 36e, occupé pour la dernière fois en 1970.
En 2025, les exportations de biens et services du Chili étaient les 3es plus élevées de 27 pays situés en Amérique latine, après celles du Mexique et du Brésil. Les importations de biens et services du Chili s'élevaient à 109 milliards de dollars en 2025, au 48e rang mondial. En 2025, les exportations du Chili dépassaient ses importations de 14,8 milliards de dollars, soit un excédent commercial.
Exportations de biens du Chili par catégorie, 2025
Exportations de biens, 2025: 111 Md $US
En 2025, la première catégorie des exportations de biens du Chili était « pétrole, gaz, minerais et autres matières premières », avec 41,2 %, suivie de « métaux communs (fer, acier, cuivre, aluminium) », avec 18,2 %.
Destinations des exportations de biens du Chili : les 10 premières, 2025
| Rang | Pays | Exportations de biens | Part | |
|---|---|---|---|---|
| 1 |
 Chine |
39,0 Md $US | 35 % | |
| 2 |
 États-Unis |
19,7 Md $US | 17,7 % | |
| 3 |
 Japon |
8,40 Md $US | 7,54 % | |
| 4 |
 Brésil |
5,20 Md $US | 4,67 % | vs Brésil |
| 5 |
 Corée du Sud |
4,87 Md $US | 4,37 % | |
| 6 |
 Inde |
3,94 Md $US | 3,54 % | |
| 7 |
 Pérou |
2,43 Md $US | 2,18 % | vs Pérou |
| 8 |
 Pays-Bas |
2,11 Md $US | 1,9 % | |
| 9 |
 Espagne |
2,09 Md $US | 1,88 % | |
| 10 |
 Mexique |
2,04 Md $US | 1,83 % | vs Mexique |
| Autres partenaires et non précisés | 21,6 Md $US | 19,4 % |
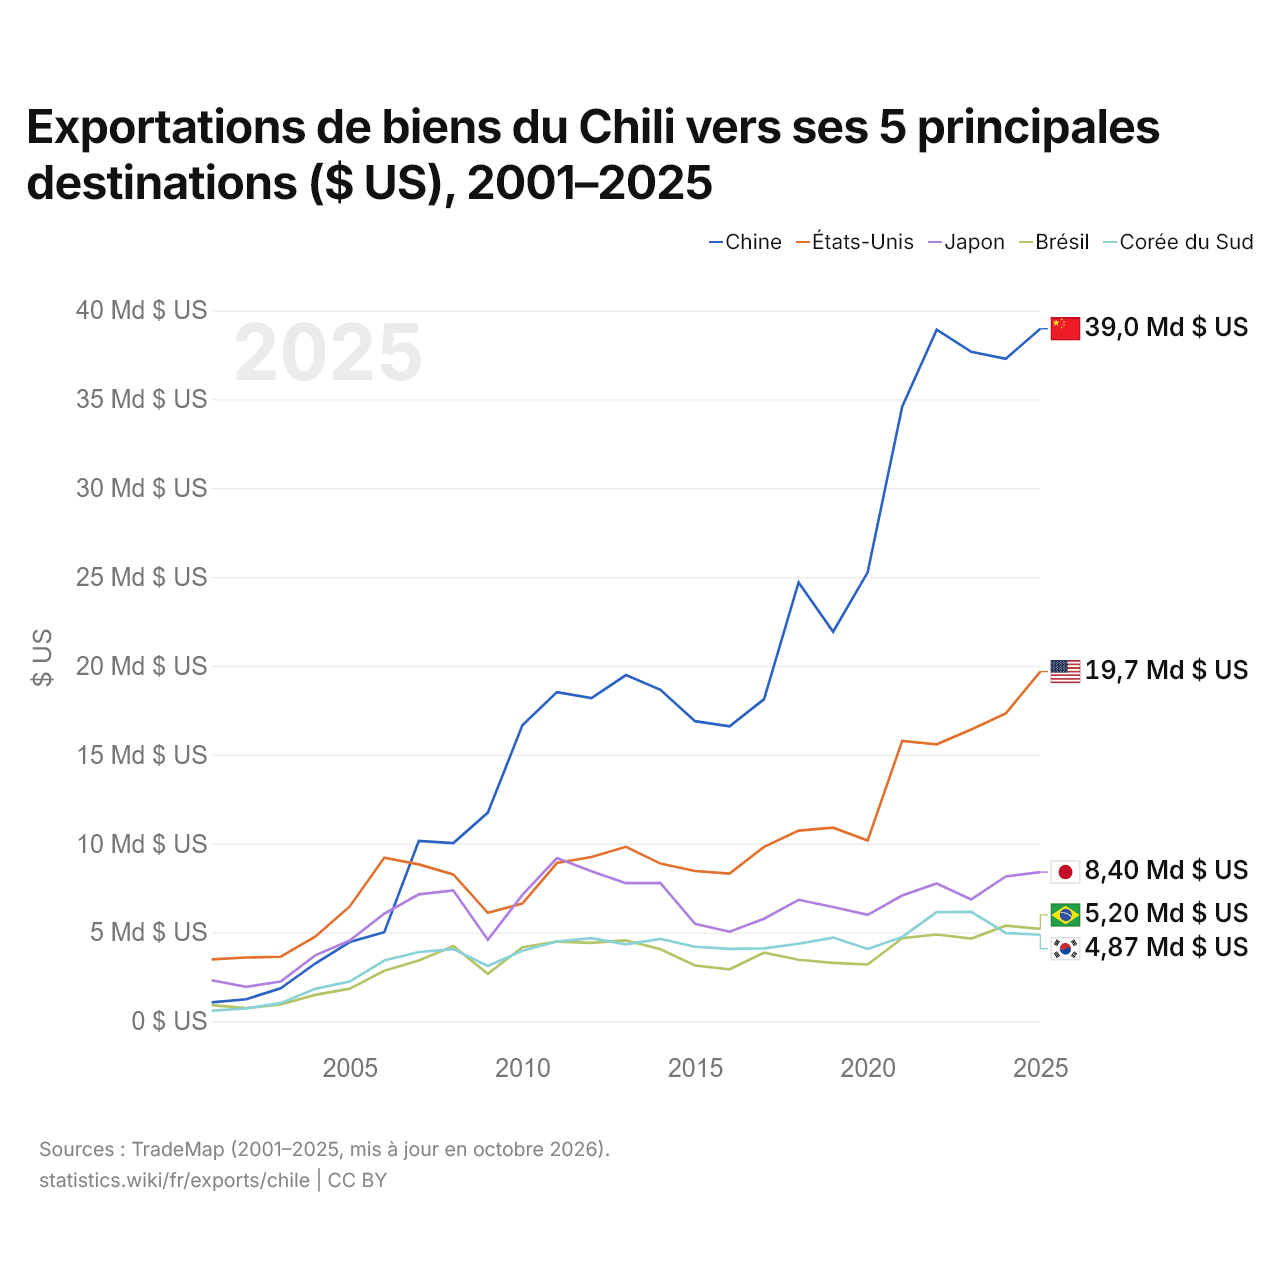
Exportations de biens du Chili vers ses 5 principales destinations ($ US), 2001–2025
| Année | $ US | ||||
|---|---|---|---|---|---|
| Chine | États-Unis | Japon | Brésil | Corée du Sud | |
| 2025 | 38 962 262 000 $ US | 19 676 251 000 $ US | 8 396 621 000 $ US | 5 199 352 000 $ US | 4 870 122 000 $ US |
| 2024 | 37 275 599 000 $ US | 17 322 117 000 $ US | 8 152 403 000 $ US | 5 382 295 000 $ US | 4 971 012 000 $ US |
| 2023 | 37 663 275 000 $ US | 16 415 049 000 $ US | 6 859 771 000 $ US | 4 658 660 000 $ US | 6 158 775 000 $ US |
| 2022 | 38 915 397 000 $ US | 15 586 384 000 $ US | 7 759 382 000 $ US | 4 886 408 000 $ US | 6 147 435 000 $ US |
| 2021 | 34 575 311 000 $ US | 15 774 702 000 $ US | 7 076 757 000 $ US | 4 675 638 000 $ US | 4 747 483 000 $ US |
| 2020 | 25 260 481 000 $ US | 10 176 267 000 $ US | 5 988 085 000 $ US | 3 197 942 000 $ US | 4 072 809 000 $ US |
| 2019 | 21 916 774 000 $ US | 10 892 222 000 $ US | 6 434 812 000 $ US | 3 284 583 000 $ US | 4 711 835 000 $ US |
| 2018 | 24 695 072 000 $ US | 10 728 766 000 $ US | 6 837 042 000 $ US | 3 466 603 000 $ US | 4 367 398 000 $ US |
| 2017 | 18 123 401 000 $ US | 9 818 419 000 $ US | 5 768 757 000 $ US | 3 861 069 000 $ US | 4 101 183 000 $ US |
| 2016 | 16 597 456 000 $ US | 8 306 926 000 $ US | 5 042 029 000 $ US | 2 927 835 000 $ US | 4 073 613 000 $ US |
| 2015 | 16 885 547 000 $ US | 8 455 116 000 $ US | 5 487 014 000 $ US | 3 141 482 000 $ US | 4 196 553 000 $ US |
| 2014 | 18 649 210 000 $ US | 8 874 321 000 $ US | 7 776 185 000 $ US | 4 051 573 000 $ US | 4 637 581 000 $ US |
| 2013 | 19 479 591 000 $ US | 9 816 908 000 $ US | 7 770 702 000 $ US | 4 549 644 000 $ US | 4 328 185 000 $ US |
| 2012 | 18 186 251 000 $ US | 9 243 505 000 $ US | 8 444 672 000 $ US | 4 418 014 000 $ US | 4 678 852 000 $ US |
| 2011 | 18 524 099 000 $ US | 8 906 273 000 $ US | 9 188 582 000 $ US | 4 488 353 000 $ US | 4 492 413 000 $ US |
| 2010 | 16 651 197 000 $ US | 6 621 376 000 $ US | 7 114 159 000 $ US | 4 171 106 000 $ US | 3 971 593 000 $ US |
| 2009 | 11 742 925 000 $ US | 6 104 691 000 $ US | 4 585 520 000 $ US | 2 671 555 000 $ US | 3 113 680 000 $ US |
| 2008 | 10 031 725 000 $ US | 8 267 787 000 $ US | 7 361 591 000 $ US | 4 231 534 000 $ US | 4 061 119 000 $ US |
| 2007 | 10 149 996 000 $ US | 8 827 717 000 $ US | 7 142 669 000 $ US | 3 418 286 000 $ US | 3 903 489 000 $ US |
| 2006 | 5 010 914 000 $ US | 9 211 309 000 $ US | 6 053 752 000 $ US | 2 847 576 000 $ US | 3 423 234 000 $ US |
| 2005 | 4 462 393 000 $ US | 6 462 802 000 $ US | 4 549 007 000 $ US | 1 841 211 000 $ US | 2 237 723 000 $ US |
| 2004 | 3 252 983 000 $ US | 4 760 200 000 $ US | 3 710 583 000 $ US | 1 488 564 000 $ US | 1 826 008 000 $ US |
| 2003 | 1 855 420 000 $ US | 3 633 520 000 $ US | 2 241 346 000 $ US | 947 584 000 $ US | 1 021 316 000 $ US |
| 2002 | 1 244 352 000 $ US | 3 590 080 000 $ US | 1 939 925 000 $ US | 742 394 000 $ US | 728 323 000 $ US |
| 2001 | 1 065 036 000 $ US | 3 483 646 000 $ US | 2 311 928 000 $ US | 909 577 000 $ US | 596 021 000 $ US |
En 2025, les exportations de biens s'élevaient à 39 milliards de dollars vers la Chine, 19,7 milliards de dollars vers les États-Unis, 8,4 milliards de dollars vers le Japon, 5,2 milliards de dollars vers le Brésil et 4,87 milliards de dollars vers la Corée du Sud. Le premier rang des cinq destinations du Chili est occupé par la Chine depuis 2007. Le changement le plus récent dans leur ordre remonte à 2024, quand les exportations du Chili vers le Brésil ont dépassé celles vers la Corée du Sud.
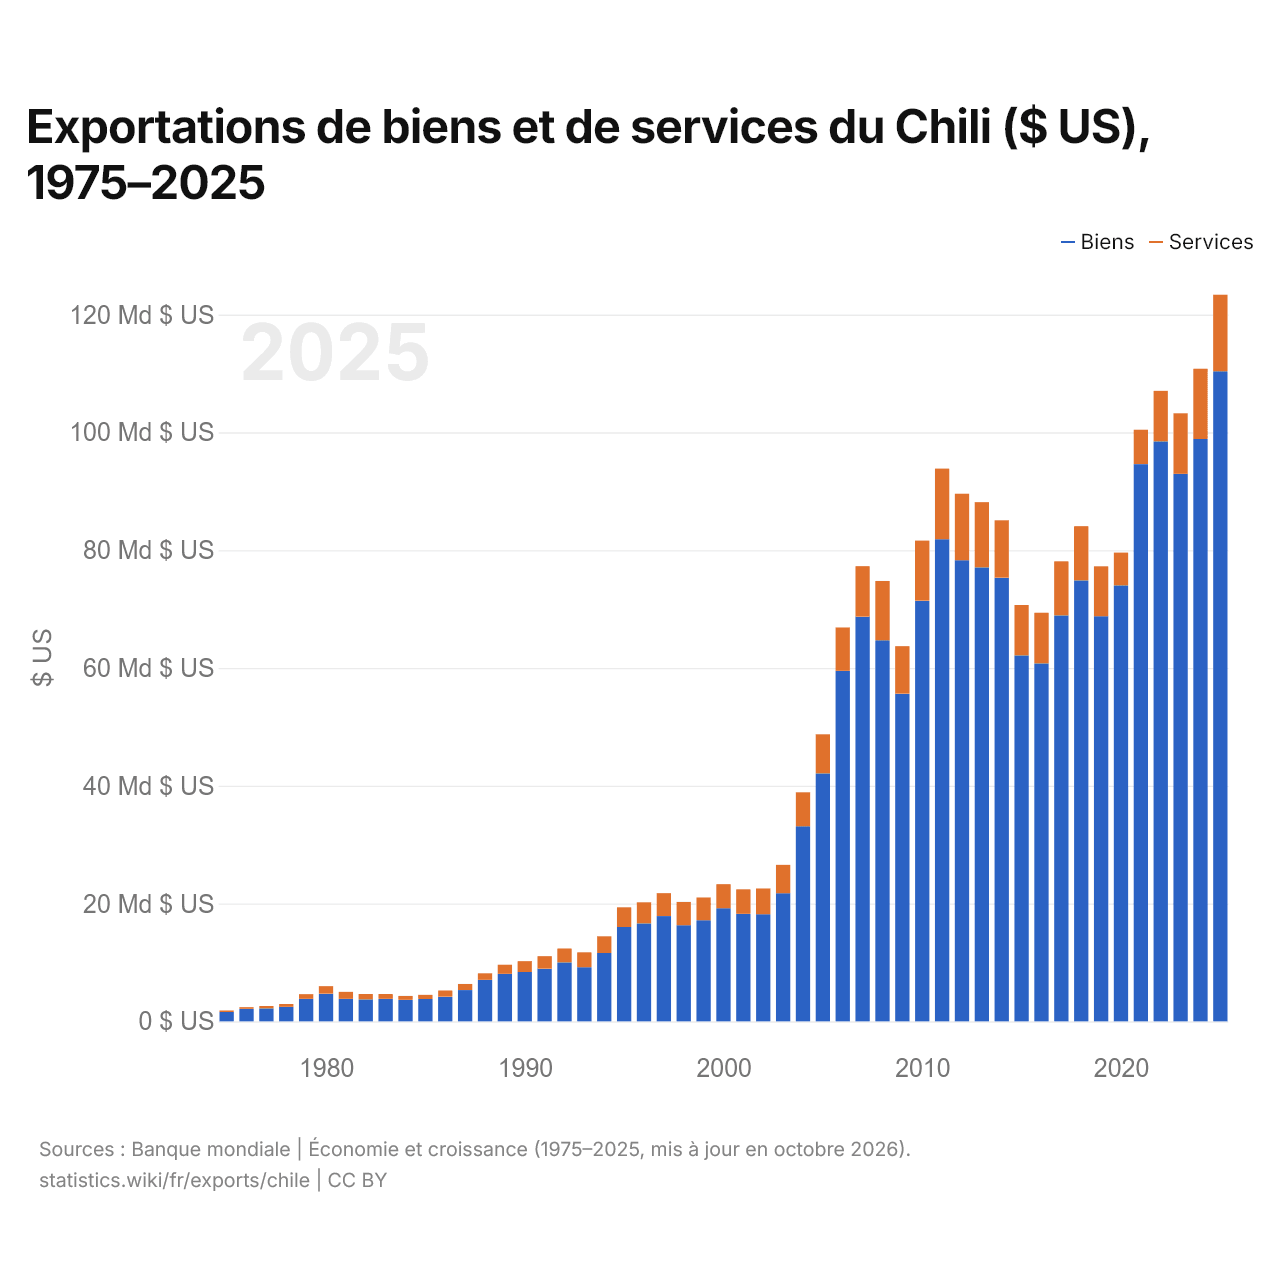
Exportations de biens et de services du Chili ($ US), 1975–2025
| Année | $ US | |
|---|---|---|
| Biens | Services | |
| 2025 | 110 363 086 507 $ US | 13 012 131 976 $ US |
| 2024 | 98 884 209 466 $ US | 11 908 861 271 $ US |
| 2023 | 92 956 501 839 $ US | 10 270 403 981 $ US |
| 2022 | 98 474 716 107 $ US | 8 563 921 731 $ US |
| 2021 | 94 604 151 312 $ US | 5 843 895 346 $ US |
| 2020 | 74 024 363 033 $ US | 5 554 458 260 $ US |
| 2019 | 68 792 346 366 $ US | 8 462 393 768 $ US |
| 2018 | 74 838 121 947 $ US | 9 225 695 085 $ US |
| 2017 | 68 904 187 418 $ US | 9 193 561 249 $ US |
| 2016 | 60 769 494 235 $ US | 8 600 293 003 $ US |
| 2015 | 62 120 249 898 $ US | 8 557 378 164 $ US |
| 2014 | 75 324 399 113 $ US | 9 744 597 771 $ US |
| 2013 | 77 069 617 024 $ US | 11 086 853 291 $ US |
| 2012 | 78 283 505 945 $ US | 11 302 595 150 $ US |
| 2011 | 81 857 427 841 $ US | 11 980 051 122 $ US |
| 2010 | 71 422 337 519 $ US | 10 199 055 801 $ US |
| 2009 | 55 623 899 443 $ US | 8 077 148 793 $ US |
| 2008 | 64 694 886 570 $ US | 10 070 862 840 $ US |
| 2007 | 68 716 258 586 $ US | 8 553 417 670 $ US |
| 2006 | 59 516 598 505 $ US | 7 366 086 263 $ US |
| 2005 | 42 082 076 284 $ US | 6 658 489 263 $ US |
| 2004 | 33 117 189 709 $ US | 5 770 557 068 $ US |
| 2003 | 21 746 923 812 $ US | 4 818 836 024 $ US |
| 2002 | 18 178 137 790 $ US | 4 387 210 813 $ US |
| 2001 | 18 271 390 807 $ US | 4 138 778 255 $ US |
| 2000 | 19 209 887 166 $ US | 4 083 266 403 $ US |
| 1999 | 17 161 948 434 $ US | 3 869 315 980 $ US |
| 1998 | 16 322 526 210 $ US | 3 952 290 070 $ US |
| 1997 | 17 869 877 663 $ US | 3 892 137 935 $ US |
| 1996 | 16 626 465 804 $ US | 3 588 258 163 $ US |
| 1995 | 16 025 000 000 $ US | 3 332 900 000 $ US |
| 1994 | 11 604 100 000 $ US | 2 839 900 000 $ US |
| 1993 | 9 198 700 000 $ US | 2 514 700 000 $ US |
| 1992 | 10 007 400 000 $ US | 2 360 000 000 $ US |
| 1991 | 8 941 500 000 $ US | 2 126 700 000 $ US |
| 1990 | 8 372 700 000 $ US | 1 848 100 000 $ US |
| 1989 | 8 078 400 000 $ US | 1 534 250 000 $ US |
| 1988 | 7 054 100 000 $ US | 1 089 900 000 $ US |
| 1987 | 5 303 000 000 $ US | 1 045 000 000 $ US |
| 1986 | 4 191 200 000 $ US | 1 041 060 000 $ US |
| 1985 | 3 804 100 000 $ US | 692 520 000 $ US |
| 1984 | 3 650 000 000 $ US | 664 000 000 $ US |
| 1983 | 3 831 000 000 $ US | 797 000 000 $ US |
| 1982 | 3 706 000 000 $ US | 936 000 000 $ US |
| 1981 | 3 836 000 000 $ US | 1 172 000 000 $ US |
| 1980 | 4 705 000 000 $ US | 1 263 000 000 $ US |
| 1979 | 3 835 000 000 $ US | 785 000 000 $ US |
| 1978 | 2 460 000 000 $ US | 481 000 000 $ US |
| 1977 | 2 186 000 000 $ US | 417 000 000 $ US |
| 1976 | 2 116 000 000 $ US | 297 000 000 $ US |
| 1975 | 1 590 000 000 $ US | 248 000 000 $ US |
En 2025, les exportations de biens du Chili s'élevaient à 110 milliards de dollars et celles de services à 13 milliards de dollars ; les services représentaient 10,5 % du total, contre 13,5 % en 1975.
Le Chili dans le classement mondial des exportations, 2025
| Rang | Pays | Exportations | Part mondiale | |
|---|---|---|---|---|
| 41 |
 Afrique du Sud |
134 Md $US | 0,38 % | |
| 42 |
 Slovaquie |
131 Md $US | 0,38 % | |
| 43 |
 Philippines |
129 Md $US | 0,37 % | |
| 44 |
 Chili |
124 Md $US | 0,35 % | |
| 45 |
 Qatar |
114 Md $US | 0,33 % | |
| 46 |
 Grèce |
111 Md $US | 0,32 % | |
| 47 |
 Argentine |
106 Md $US | 0,3 % | vs Argentine |
Exportations de biens et services du Chili, % du PIB, 1960–2025
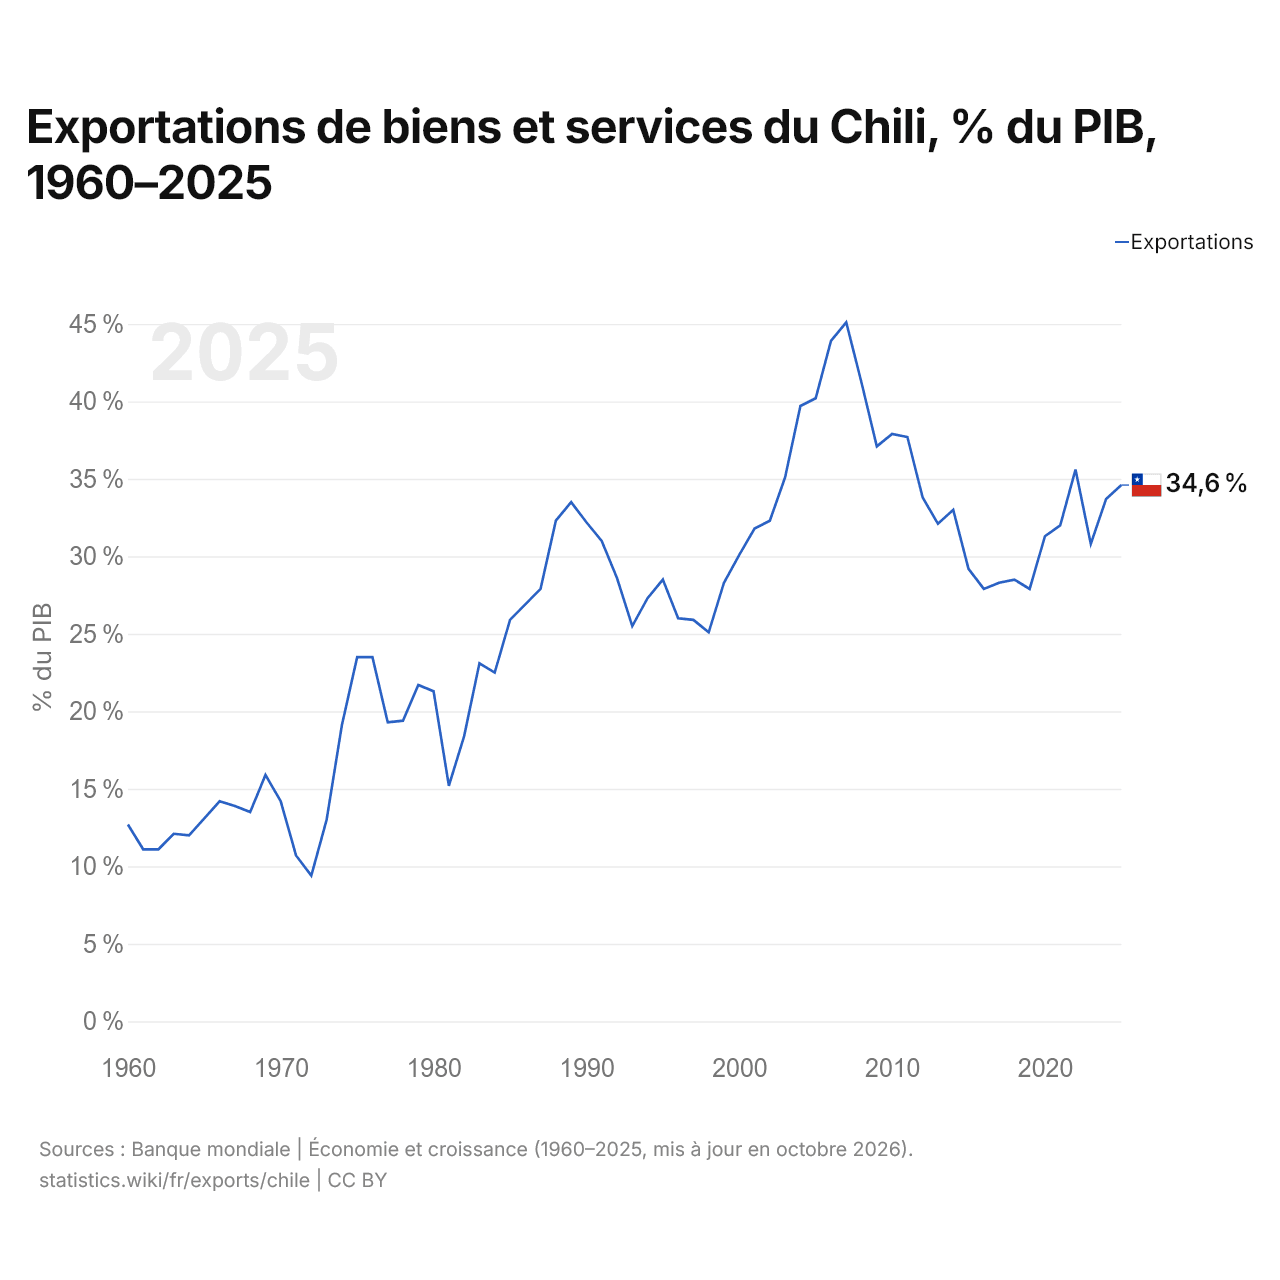
En 2025, les exportations de biens et services du Chili équivalaient à 34,6 % de son PIB, contre 12,7 % en 1960. La part la plus élevée a été de 45,1 %, en 2007.
Comparer les exportations du Chili avec celles d'autres pays
Sources :
- Banque mondiale | Économie et croissance (1960–2025, mis à jour en octobre 2026)
- TradeMap (2001–2025, mis à jour en octobre 2026)
Creative Commons Attribution (CC BY) : vous pouvez copier, partager, adapter et réutiliser ce contenu, y compris à des fins commerciales, à condition de citer statistics.wiki et d’indiquer les modifications apportées. Les sources citées ci-dessus peuvent avoir leurs propres conditions de licence.