
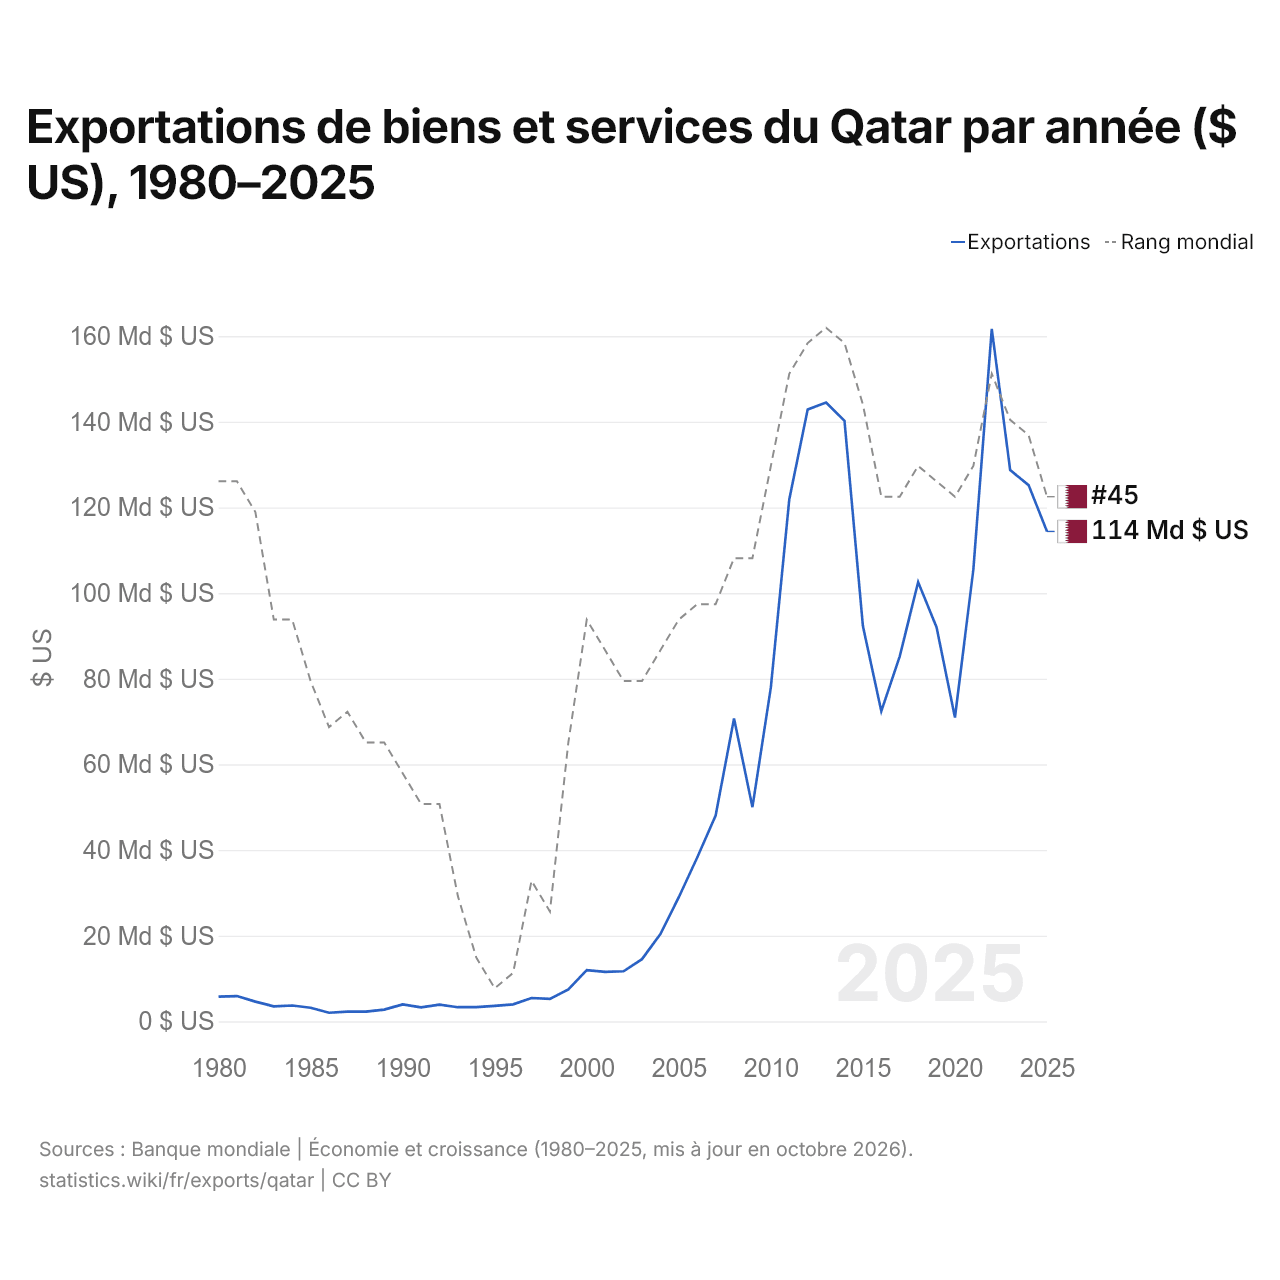
Exportations de biens et services du Qatar par année ($ US), 1980–2025
| Année | $ US | Rang mondial |
|---|---|---|
| Exportations | Rang mondial | |
| 2025 | 114 384 615 385 $ US | #45 |
| 2024 | 125 216 483 516 $ US | #41 |
| 2023 | 128 709 226 088 $ US | #40 |
| 2022 | 161 692 857 143 $ US | #37 |
| 2021 | 105 549 450 549 $ US | #43 |
| 2020 | 70 933 241 758 $ US | #45 |
| 2019 | 92 046 153 846 $ US | #44 |
| 2018 | 102 560 989 011 $ US | #43 |
| 2017 | 85 204 395 604 $ US | #45 |
| 2016 | 72 397 252 747 $ US | #45 |
| 2015 | 92 291 208 791 $ US | #39 |
| 2014 | 140 228 846 154 $ US | #35 |
| 2013 | 144 510 439 560 $ US | #34 |
| 2012 | 142 876 098 901 $ US | #35 |
| 2011 | 121 837 912 088 $ US | #37 |
| 2010 | 77 975 824 176 $ US | #43 |
| 2009 | 50 009 065 934 $ US | #49 |
| 2008 | 70 732 692 308 $ US | #49 |
| 2007 | 48 048 351 648 $ US | #52 |
| 2006 | 38 244 780 220 $ US | #52 |
| 2005 | 28 982 692 308 $ US | #53 |
| 2004 | 20 363 186 813 $ US | #55 |
| 2003 | 14 519 780 220 $ US | #57 |
| 2002 | 11 684 615 385 $ US | #57 |
| 2001 | 11 556 593 407 $ US | #55 |
| 2000 | 11 949 450 549 $ US | #53 |
| 1999 | 7 440 934 066 $ US | #61 |
| 1998 | 5 240 109 890 $ US | #72 |
| 1997 | 5 454 670 330 $ US | #70 |
| 1996 | 3 961 263 736 $ US | #76 |
| 1995 | 3 608 241 786 $ US | #77 |
| 1994 | 3 309 340 659 $ US | #75 |
| 1993 | 3 299 725 275 $ US | #71 |
| 1992 | 3 901 923 077 $ US | #65 |
| 1991 | 3 265 384 615 $ US | #65 |
| 1990 | 3 934 890 110 $ US | #63 |
| 1989 | 2 743 406 593 $ US | #61 |
| 1988 | 2 263 461 538 $ US | #61 |
| 1987 | 2 249 450 549 $ US | #59 |
| 1986 | 2 013 736 264 $ US | #60 |
| 1985 | 3 159 890 110 $ US | #57 |
| 1984 | 3 695 054 945 $ US | #53 |
| 1983 | 3 503 571 429 $ US | #53 |
| 1982 | 4 602 472 527 $ US | #46 |
| 1981 | 5 897 802 198 $ US | #44 |
| 1980 | 5 777 191 864 $ US | #44 |
En 2025, les exportations de biens et services du Qatar s'élevaient à 114 milliards de dollars, contre 5,78 milliards de dollars en 1980. Le maximum a été de 162 milliards de dollars, en 2022. Elles se classaient au 45e rang mondial, en baisse par rapport au 41e rang en 2024. Leur meilleur rang a été le 34e, occupé pour la dernière fois en 2013.
En 2025, les exportations de biens et services du Qatar étaient les 16es plus élevées de 44 pays situés en Asie. Les importations de biens et services du Qatar s'élevaient à 65,6 milliards de dollars en 2025, au 61e rang mondial. En 2025, les exportations du Qatar dépassaient ses importations de 48,7 milliards de dollars, soit un excédent commercial.
Exportations de biens du Qatar par catégorie
Exportations de biens, 2024: 95,0 Md $US
La première catégorie des exportations de biens du Qatar est « pétrole, gaz, minerais et autres matières premières », avec 87,9 %, suivie de « produits chimiques, pharmaceutiques et plastiques », avec 4,2 %.
Destinations des exportations de biens du Qatar : les 10 premières
| Rang | Pays | Exportations de biens | Part | |
|---|---|---|---|---|
| 1 |
 Chine |
18,9 Md $US | 19,9 % | |
| 2 |
 Corée du Sud |
12,8 Md $US | 13,5 % | |
| 3 |
 Inde |
11,2 Md $US | 11,7 % | |
| 4 |
 Japon |
6,72 Md $US | 7,07 % | |
| 5 |
 Singapour |
6,67 Md $US | 7,01 % | |
| 6 |
 EAU |
6,01 Md $US | 6,32 % | vs EAU |
| 7 |
 Pakistan |
3,73 Md $US | 3,93 % | vs Pakistan |
| 8 |
 Thaïlande |
3,05 Md $US | 3,21 % | |
| 9 |
 Italie |
2,75 Md $US | 2,89 % | |
| 10 |
 Koweït |
2,25 Md $US | 2,37 % | vs Koweït |
| Autres partenaires et non précisés | 21,0 Md $US | 22,1 % |
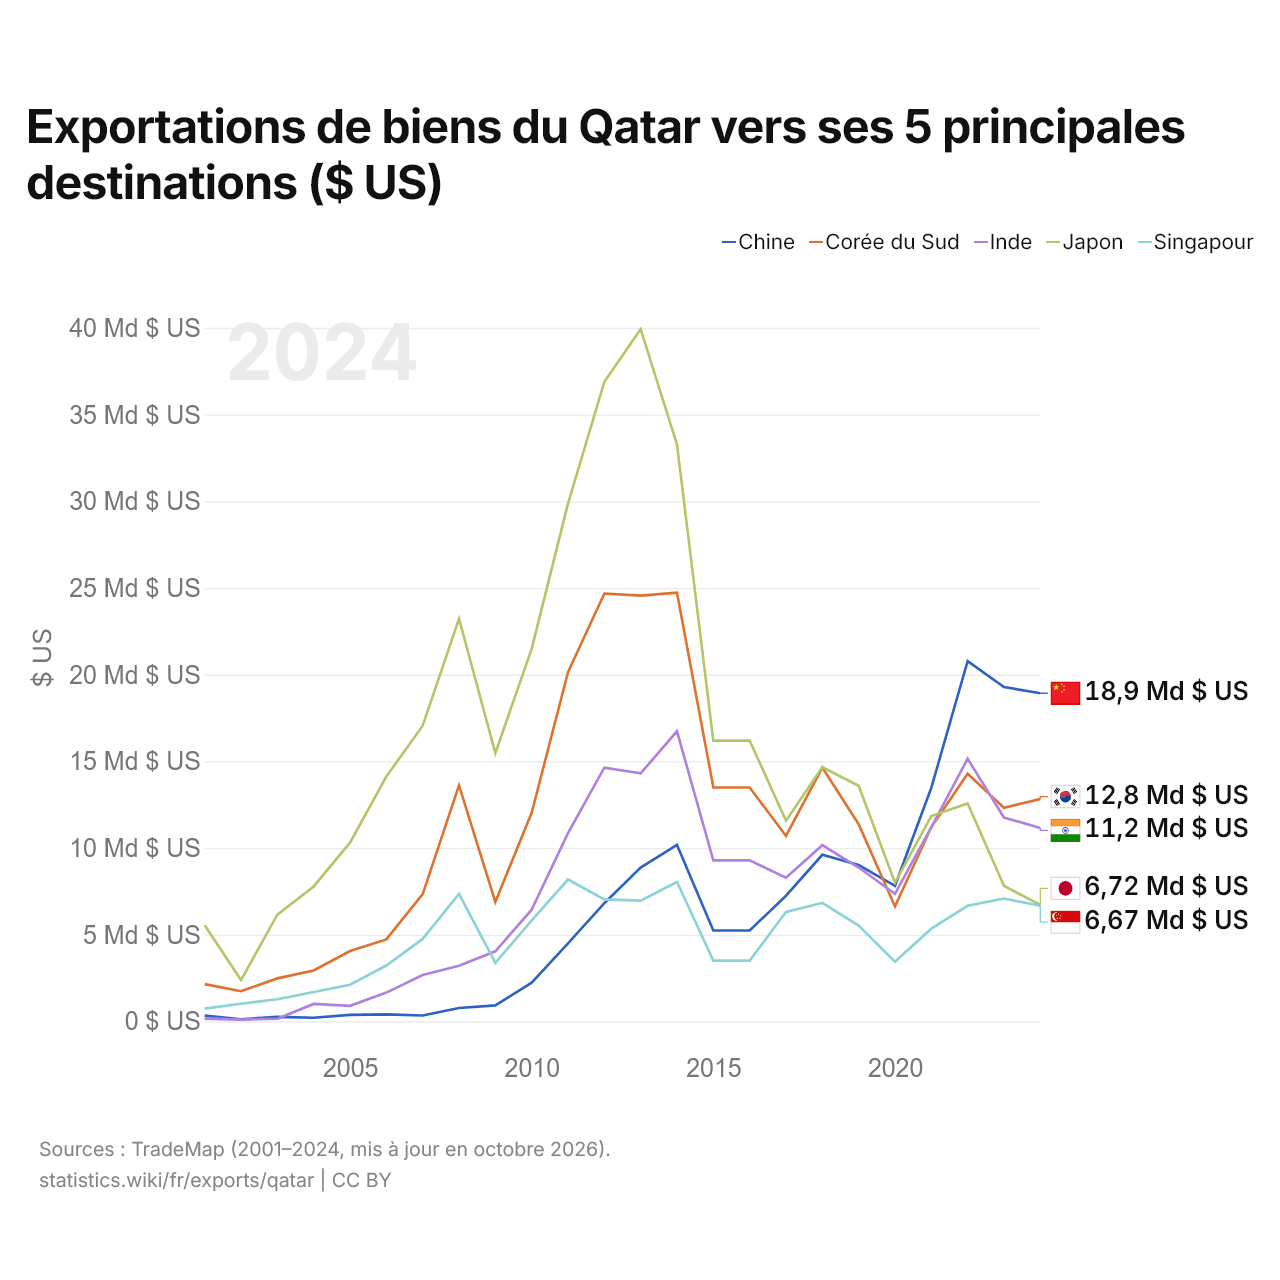
Exportations de biens du Qatar vers ses 5 principales destinations ($ US)
| Année | $ US | ||||
|---|---|---|---|---|---|
| Chine | Corée du Sud | Inde | Japon | Singapour | |
| 2024 | 18 924 772 000 $ US | 12 823 926 000 $ US | 11 151 261 000 $ US | 6 719 350 000 $ US | 6 666 955 000 $ US |
| 2023 | 19 279 222 000 $ US | 12 318 305 000 $ US | 11 757 664 000 $ US | 7 813 037 000 $ US | 7 082 479 000 $ US |
| 2022 | 20 782 196 000 $ US | 14 278 699 000 $ US | 15 148 177 000 $ US | 12 570 095 000 $ US | 6 664 594 000 $ US |
| 2021 | 13 472 961 000 $ US | 11 191 927 000 $ US | 11 196 939 000 $ US | 11 843 717 000 $ US | 5 346 406 000 $ US |
| 2020 | 7 815 711 000 $ US | 6 626 143 000 $ US | 7 352 839 000 $ US | 7 996 398 000 $ US | 3 443 081 000 $ US |
| 2019 | 9 018 816 000 $ US | 11 369 583 000 $ US | 8 871 621 000 $ US | 13 591 936 000 $ US | 5 521 269 000 $ US |
| 2018 | 9 608 642 000 $ US | 14 636 349 000 $ US | 10 162 358 000 $ US | 14 657 960 000 $ US | 6 829 651 000 $ US |
| 2017 | 7 244 966 000 $ US | 10 692 574 000 $ US | 8 280 476 000 $ US | 11 573 682 000 $ US | 6 305 024 000 $ US |
| 2016 | 5 238 217 000 $ US | 13 488 836 000 $ US | 9 286 450 000 $ US | 16 194 231 000 $ US | 3 503 162 000 $ US |
| 2015 | 5 238 217 000 $ US | 13 488 836 000 $ US | 9 286 450 000 $ US | 16 194 231 000 $ US | 3 503 162 000 $ US |
| 2014 | 10 173 644 000 $ US | 24 722 647 000 $ US | 16 731 470 000 $ US | 33 265 007 000 $ US | 8 040 583 000 $ US |
| 2013 | 8 864 561 000 $ US | 24 550 643 000 $ US | 14 303 199 000 $ US | 39 923 181 000 $ US | 6 963 101 000 $ US |
| 2012 | 6 814 137 000 $ US | 24 675 804 000 $ US | 14 629 770 000 $ US | 36 890 860 000 $ US | 7 037 939 000 $ US |
| 2011 | 4 494 937 000 $ US | 20 135 808 000 $ US | 10 851 611 000 $ US | 29 867 799 000 $ US | 8 180 780 000 $ US |
| 2010 | 2 225 216 000 $ US | 12 030 275 000 $ US | 6 438 915 000 $ US | 21 484 376 000 $ US | 5 818 918 000 $ US |
| 2009 | 923 173 000 $ US | 6 891 858 000 $ US | 4 036 047 000 $ US | 15 473 458 000 $ US | 3 365 340 000 $ US |
| 2008 | 770 211 000 $ US | 13 609 398 000 $ US | 3 204 391 000 $ US | 23 223 054 000 $ US | 7 352 365 000 $ US |
| 2007 | 334 948 000 $ US | 7 334 651 000 $ US | 2 670 389 000 $ US | 17 052 786 000 $ US | 4 750 999 000 $ US |
| 2006 | 398 247 000 $ US | 4 724 921 000 $ US | 1 658 164 000 $ US | 14 117 648 000 $ US | 3 218 575 000 $ US |
| 2005 | 376 971 000 $ US | 4 058 120 000 $ US | 896 235 000 $ US | 10 304 034 000 $ US | 2 111 611 000 $ US |
| 2004 | 208 828 000 $ US | 2 933 300 000 $ US | 1 005 777 000 $ US | 7 778 905 000 $ US | 1 694 856 000 $ US |
| 2003 | 258 061 000 $ US | 2 477 744 000 $ US | 147 829 000 $ US | 6 158 402 000 $ US | 1 273 637 000 $ US |
| 2002 | 116 529 000 $ US | 1 737 072 000 $ US | 101 980 000 $ US | 2 378 267 000 $ US | 1 017 086 000 $ US |
| 2001 | 327 036 000 $ US | 2 143 847 000 $ US | 153 775 000 $ US | 5 542 626 000 $ US | 735 688 000 $ US |
Les exportations de biens s'élèvent à 18,9 milliards de dollars vers la Chine (2024), 12,8 milliards de dollars vers la Corée du Sud (2024), 11,2 milliards de dollars vers l'Inde (2024), 6,72 milliards de dollars vers le Japon (2024) et 6,67 milliards de dollars vers Singapour (2024). Le premier rang des cinq destinations du Qatar est occupé par la Chine depuis 2021. Le changement le plus récent dans leur ordre remonte à 2023, quand les exportations du Qatar vers la Corée du Sud ont dépassé celles vers l'Inde.
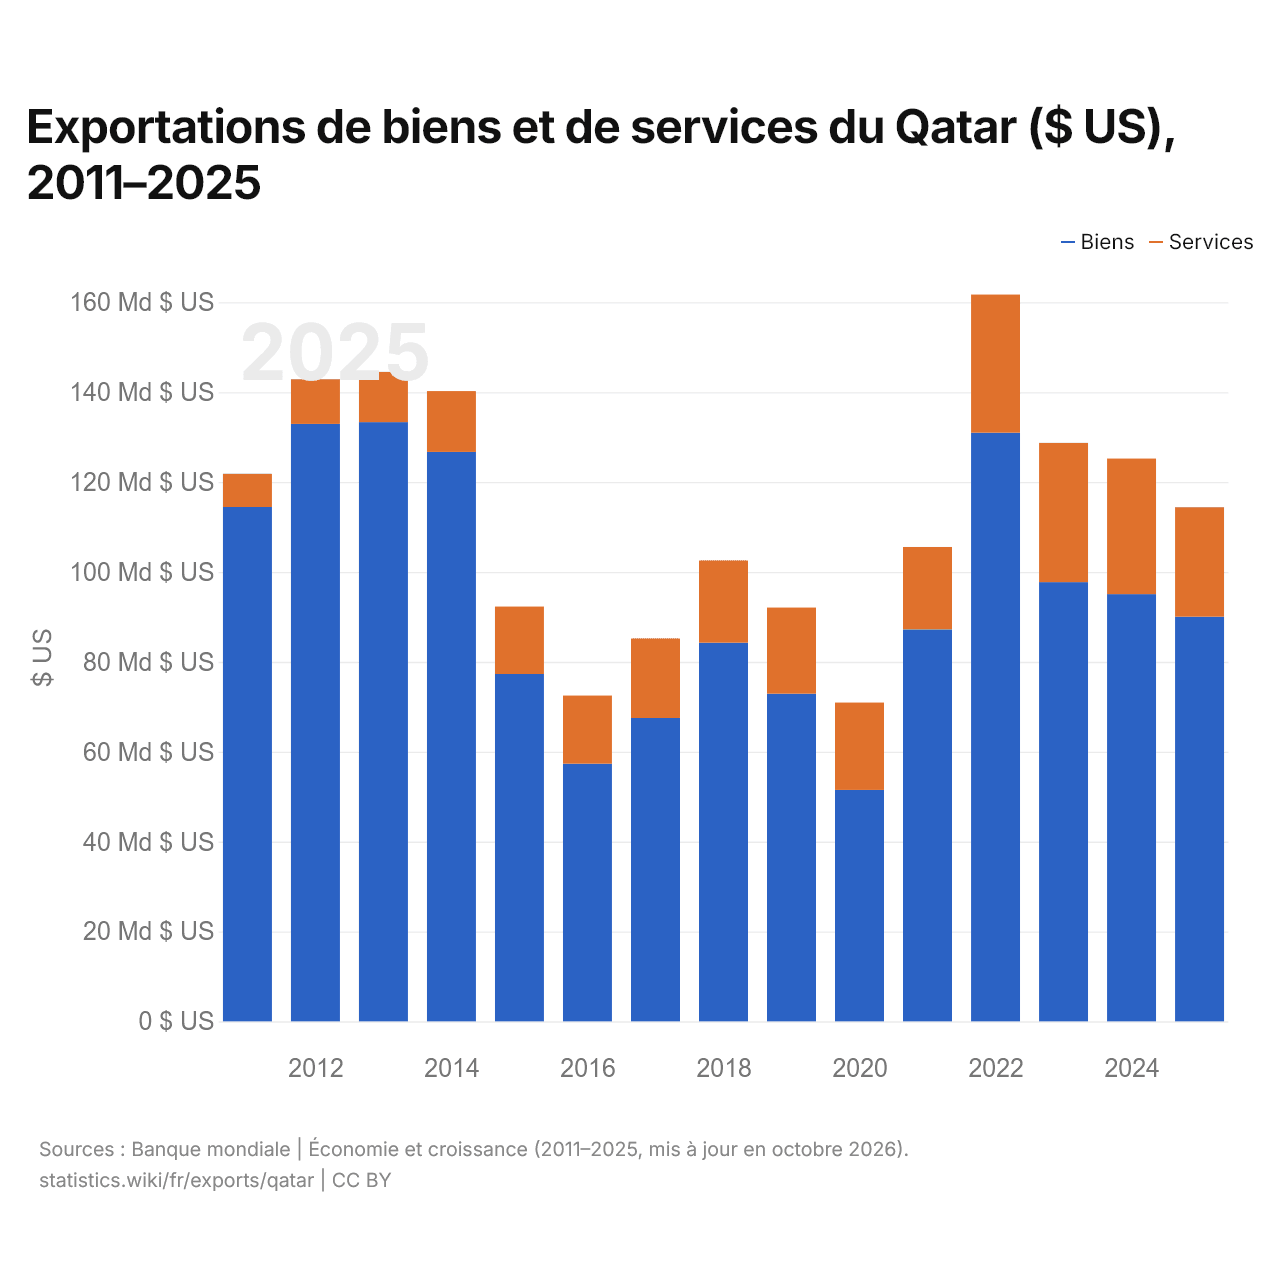
Exportations de biens et de services du Qatar ($ US), 2011–2025
| Année | $ US | |
|---|---|---|
| Biens | Services | |
| 2025 | 90 034 065 934 $ US | 24 350 549 451 $ US |
| 2024 | 95 044 230 769 $ US | 30 172 252 747 $ US |
| 2023 | 97 734 775 538 $ US | 30 974 450 549 $ US |
| 2022 | 130 964 560 440 $ US | 30 728 296 703 $ US |
| 2021 | 87 203 296 703 $ US | 18 346 153 846 $ US |
| 2020 | 51 503 846 154 $ US | 19 429 395 604 $ US |
| 2019 | 72 934 890 110 $ US | 19 111 263 736 $ US |
| 2018 | 84 288 461 538 $ US | 18 272 527 473 $ US |
| 2017 | 67 498 351 648 $ US | 17 706 043 956 $ US |
| 2016 | 57 308 791 209 $ US | 15 175 549 451 $ US |
| 2015 | 77 294 230 769 $ US | 14 996 978 022 $ US |
| 2014 | 126 702 472 527 $ US | 13 526 373 626 $ US |
| 2013 | 133 335 989 011 $ US | 11 174 450 549 $ US |
| 2012 | 132 953 846 154 $ US | 9 922 252 747 $ US |
| 2011 | 114 444 230 769 $ US | 7 393 681 319 $ US |
En 2025, les exportations de biens du Qatar s'élevaient à 90 milliards de dollars et celles de services à 24,4 milliards de dollars ; les services représentaient 21,3 % du total, contre 6,1 % en 2011.
Le Qatar dans le classement mondial des exportations, 2025







Exportations de biens et services du Qatar, % du PIB, 1980–2025
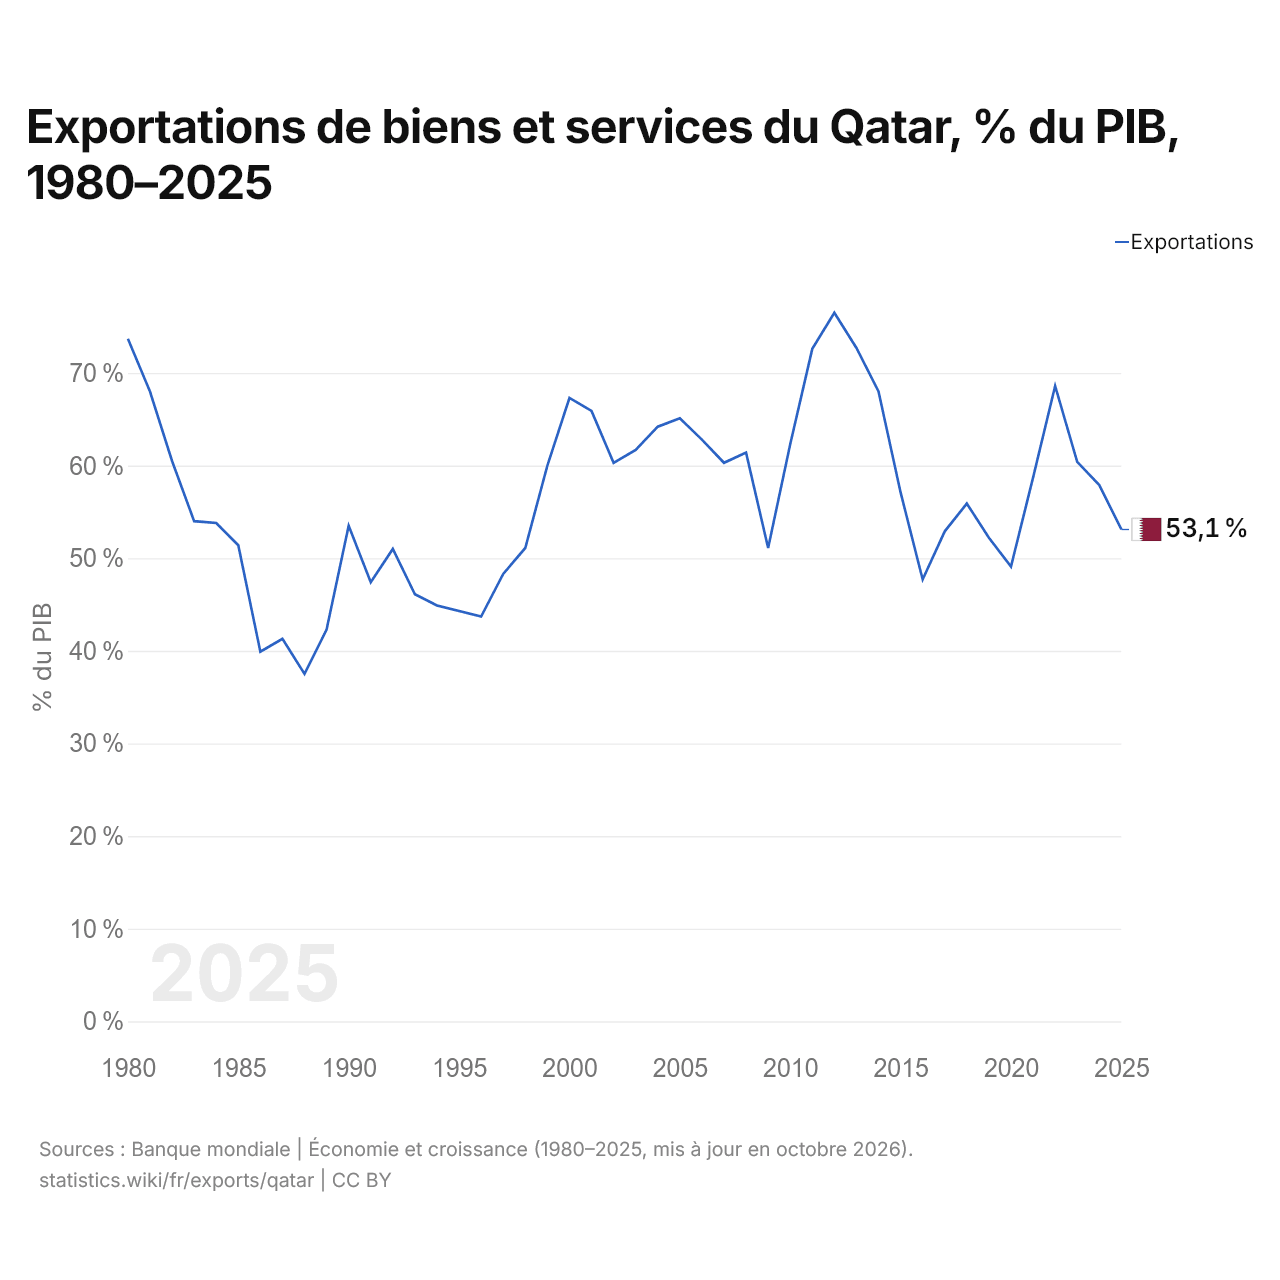
En 2025, les exportations de biens et services du Qatar équivalaient à 53,1 % de son PIB, contre 73,7 % en 1980. La part la plus élevée a été de 76,5 %, en 2012.
Comparer les exportations du Qatar avec celles d'autres pays
Sources :
- TradeMap (2001–2024, mis à jour en octobre 2026)
- Banque mondiale | Économie et croissance (1980–2025, mis à jour en octobre 2026)
Creative Commons Attribution (CC BY) : vous pouvez copier, partager, adapter et réutiliser ce contenu, y compris à des fins commerciales, à condition de citer statistics.wiki et d’indiquer les modifications apportées. Les sources citées ci-dessus peuvent avoir leurs propres conditions de licence.