
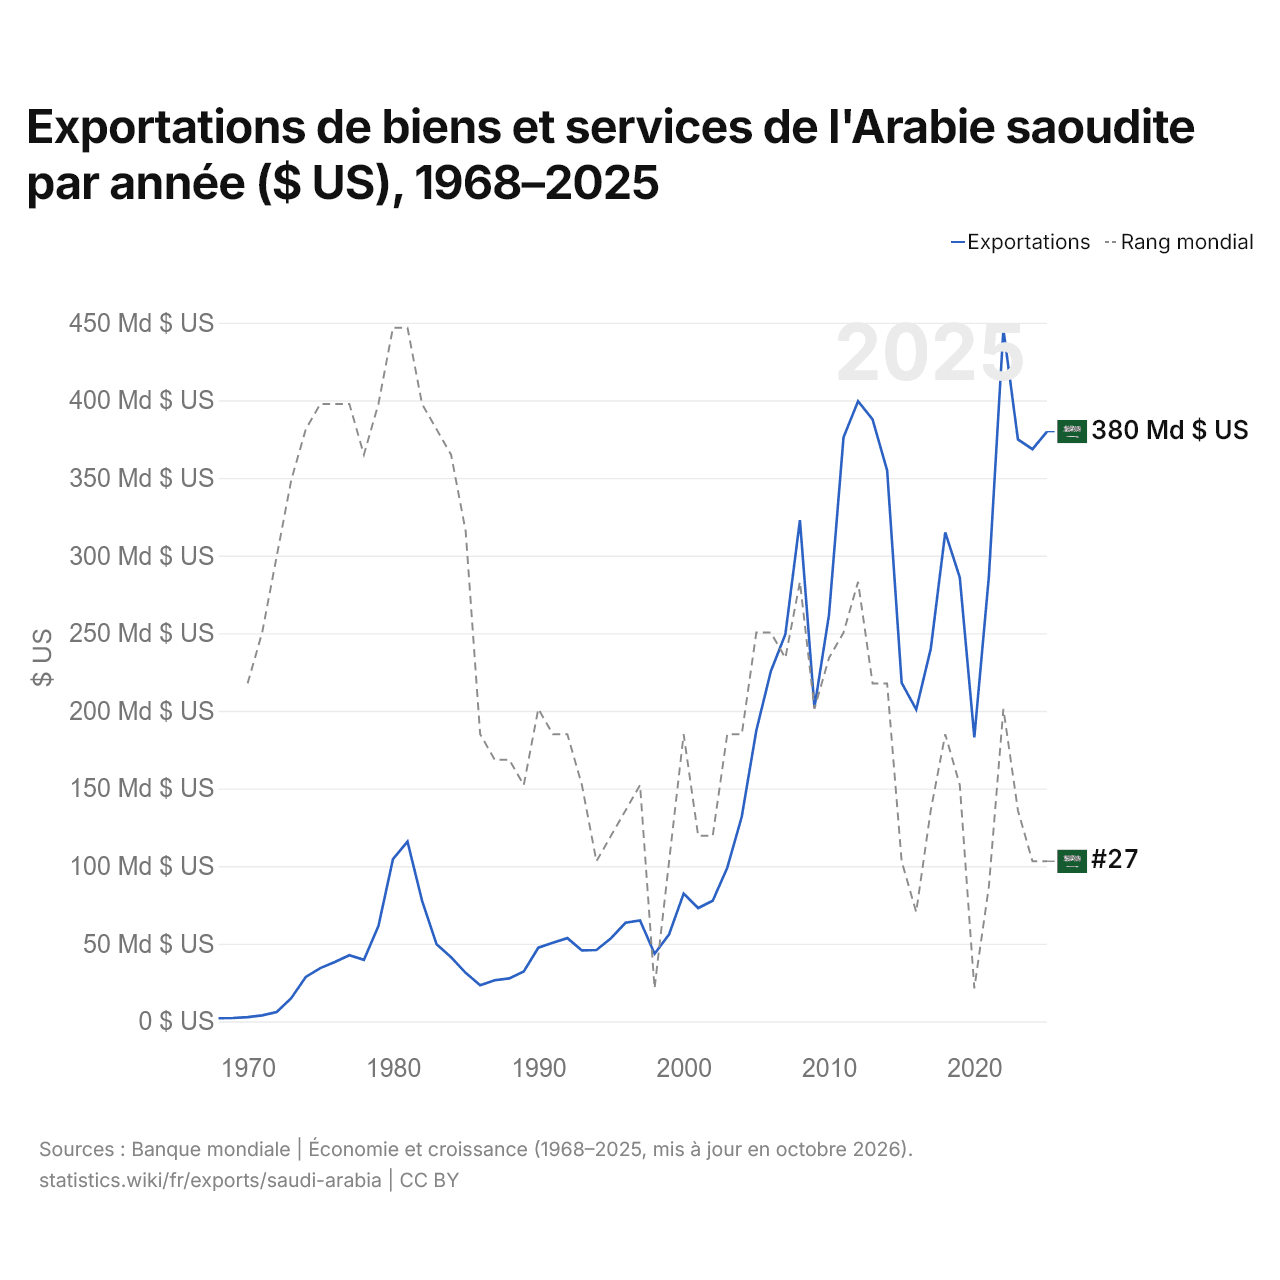
Exportations de biens et services de l'Arabie saoudite par année ($ US), 1968–2025
| Année | $ US | Rang mondial |
|---|---|---|
| Exportations | Rang mondial | |
| 2025 | 379 825 066 667 $ US | #27 |
| 2024 | 368 566 933 333 $ US | #27 |
| 2023 | 374 787 466 667 $ US | #25 |
| 2022 | 445 881 333 333 $ US | #21 |
| 2021 | 286 501 333 333 $ US | #28 |
| 2020 | 182 847 733 333 $ US | #32 |
| 2019 | 285 860 000 000 $ US | #24 |
| 2018 | 314 916 533 333 $ US | #22 |
| 2017 | 239 892 533 333 $ US | #25 |
| 2016 | 200 877 333 333 $ US | #29 |
| 2015 | 218 010 400 000 $ US | #27 |
| 2014 | 354 973 333 333 $ US | #20 |
| 2013 | 387 745 333 333 $ US | #20 |
| 2012 | 399 419 466 667 $ US | #16 |
| 2011 | 376 224 000 000 $ US | #18 |
| 2010 | 261 830 933 333 $ US | #19 |
| 2009 | 202 056 266 667 $ US | #21 |
| 2008 | 322 853 600 000 $ US | #16 |
| 2007 | 249 318 478 986 $ US | #19 |
| 2006 | 225 506 542 056 $ US | #18 |
| 2005 | 187 388 647 221 $ US | #18 |
| 2004 | 131 920 533 333 $ US | #22 |
| 2003 | 98 956 800 000 $ US | #22 |
| 2002 | 77 641 333 333 $ US | #26 |
| 2001 | 72 980 533 333 $ US | #26 |
| 2000 | 82 259 466 667 $ US | #22 |
| 1999 | 56 061 600 000 $ US | #27 |
| 1998 | 43 493 066 667 $ US | #32 |
| 1997 | 64 989 052 069 $ US | #24 |
| 1996 | 63 501 201 602 $ US | #25 |
| 1995 | 53 521 228 304 $ US | #26 |
| 1994 | 45 960 747 664 $ US | #27 |
| 1993 | 45 678 237 650 $ US | #24 |
| 1992 | 53 610 680 908 $ US | #22 |
| 1991 | 50 652 603 471 $ US | #22 |
| 1990 | 47 445 927 904 $ US | #21 |
| 1989 | 32 174 632 844 $ US | #24 |
| 1988 | 27 645 126 836 $ US | #23 |
| 1987 | 26 447 263 017 $ US | #23 |
| 1986 | 23 221 442 074 $ US | #22 |
| 1985 | 31 243 235 781 $ US | #14 |
| 1984 | 41 296 821 793 $ US | #11 |
| 1983 | 49 690 593 343 $ US | #10 |
| 1982 | 77 741 454 554 $ US | #9 |
| 1981 | 115 769 423 162 $ US | #6 |
| 1980 | 104 409 960 255 $ US | #6 |
| 1979 | 61 361 500 126 $ US | #9 |
| 1978 | 39 584 805 337 $ US | #11 |
| 1977 | 42 599 781 848 $ US | #9 |
| 1976 | 38 230 311 615 $ US | #9 |
| 1975 | 34 300 542 527 $ US | #9 |
| 1974 | 28 581 126 761 $ US | #10 |
| 1973 | 14 903 189 968 $ US | #12 |
| 1972 | 5 951 621 243 $ US | #15 |
| 1971 | 3 878 685 816 $ US | #18 |
| 1970 | 2 731 777 778 $ US | #20 |
| 1969 | 2 161 704 511 $ US | - |
| 1968 | 1 998 980 667 $ US | - |
En 2025, les exportations de biens et services de l'Arabie saoudite s'élevaient à 380 milliards de dollars, contre 2 milliards de dollars en 1968. Le maximum a été de 446 milliards de dollars, en 2022. Elles se classaient au 27e rang mondial, un rang qu'elles occupent depuis 2024. Leur meilleur rang a été le 6e, occupé pour la dernière fois en 1981.
En 2025, les exportations de biens et services de l'Arabie saoudite étaient les 11es plus élevées de 44 pays situés en Asie. Les importations de biens et services de l'Arabie saoudite s'élevaient à 360 milliards de dollars en 2025, au 27e rang mondial. En 2025, les exportations de l'Arabie saoudite dépassaient ses importations de 20,1 milliards de dollars, soit un excédent commercial.
Exportations de biens de l'Arabie saoudite par catégorie, 2025
Exportations de biens, 2025: 311 Md $US
En 2025, la première catégorie des exportations de biens de l'Arabie saoudite était « pétrole, gaz, minerais et autres matières premières », avec 72,3 %, suivie de « machines, électronique et véhicules », avec 10,8 %.
Destinations des exportations de biens de l'Arabie saoudite : les 10 premières, 2025
| Rang | Pays | Exportations de biens | Part | |
|---|---|---|---|---|
| 1 |
 EAU |
28,5 Md $US | 9,19 % | vs EAU |
| 2 |
 Inde |
8,81 Md $US | 2,84 % | vs Inde |
| 3 |
 Chine |
7,32 Md $US | 2,36 % | vs Chine |
| 4 |
 Turquie |
3,18 Md $US | 1,02 % | vs Turquie |
| 5 |
 Bahreïn |
2,95 Md $US | 0,95 % | |
| 6 |
 Égypte |
2,84 Md $US | 0,91 % | vs Égypte |
| 7 |
 États-Unis |
2,49 Md $US | 0,8 % | vs USA |
| 8 |
 Singapour |
2,40 Md $US | 0,77 % | |
| 9 |
 Koweït |
2,32 Md $US | 0,75 % | |
| 10 |
 Belgique |
2,19 Md $US | 0,7 % | vs Belgique |
| Autres partenaires et non précisés | 248 Md $US | 79,7 % |
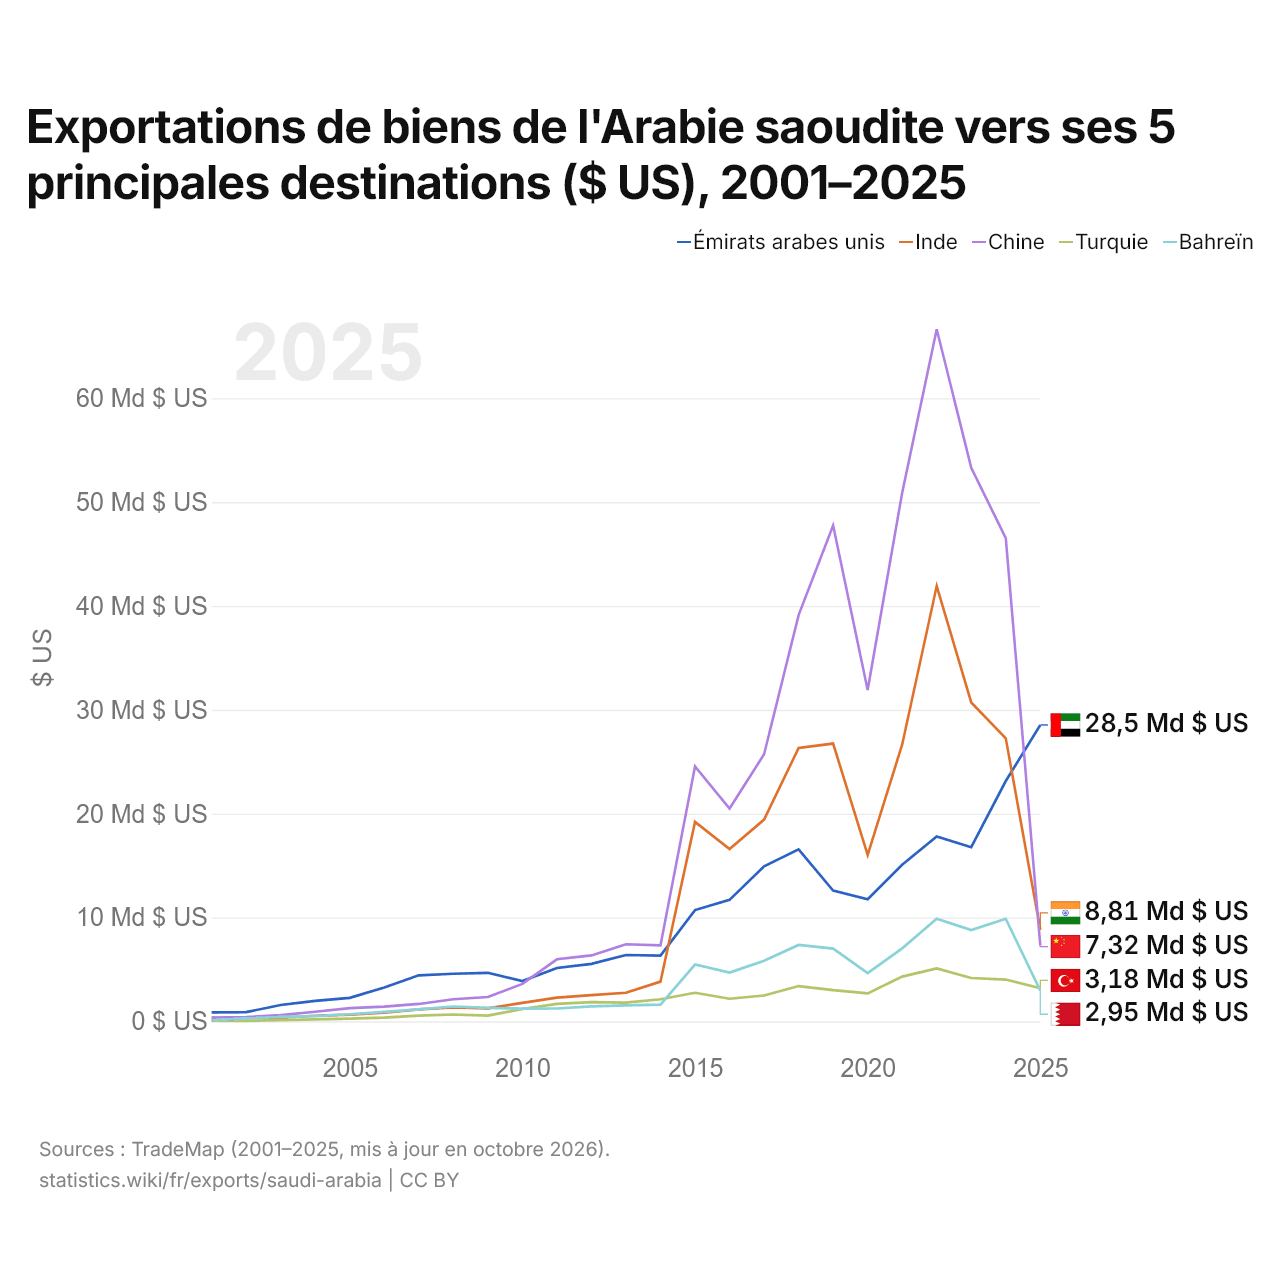
Exportations de biens de l'Arabie saoudite vers ses 5 principales destinations ($ US), 2001–2025
| Année | $ US | ||||
|---|---|---|---|---|---|
| Émirats arabes unis | Inde | Chine | Turquie | Bahreïn | |
| 2025 | 28 540 297 000 $ US | 8 814 854 000 $ US | 7 322 507 000 $ US | 3 180 902 000 $ US | 2 949 677 000 $ US |
| 2024 | 23 139 916 000 $ US | 27 257 527 000 $ US | 46 534 309 000 $ US | 4 024 134 000 $ US | 9 879 287 000 $ US |
| 2023 | 16 763 211 000 $ US | 30 702 025 000 $ US | 53 301 554 000 $ US | 4 172 040 000 $ US | 8 796 905 000 $ US |
| 2022 | 17 809 910 000 $ US | 41 916 656 000 $ US | 66 646 891 000 $ US | 5 096 807 000 $ US | 9 870 521 000 $ US |
| 2021 | 15 086 105 000 $ US | 26 657 591 000 $ US | 50 909 792 000 $ US | 4 306 835 000 $ US | 7 024 270 000 $ US |
| 2020 | 11 754 516 000 $ US | 16 015 970 000 $ US | 31 905 492 000 $ US | 2 696 066 000 $ US | 4 633 698 000 $ US |
| 2019 | 12 588 021 000 $ US | 26 747 001 000 $ US | 47 748 747 000 $ US | 3 001 767 000 $ US | 6 998 503 000 $ US |
| 2018 | 16 556 161 000 $ US | 26 317 313 000 $ US | 39 120 833 000 $ US | 3 397 009 000 $ US | 7 358 566 000 $ US |
| 2017 | 14 930 680 000 $ US | 19 425 208 000 $ US | 25 715 029 000 $ US | 2 491 892 000 $ US | 5 826 892 000 $ US |
| 2016 | 11 697 710 000 $ US | 16 589 969 000 $ US | 20 494 362 000 $ US | 2 174 586 000 $ US | 4 699 790 000 $ US |
| 2015 | 10 713 690 000 $ US | 19 210 375 000 $ US | 24 549 818 000 $ US | 2 753 755 000 $ US | 5 472 908 000 $ US |
| 2014 | 6 335 207 000 $ US | 3 827 329 000 $ US | 7 315 369 000 $ US | 2 129 706 000 $ US | 1 608 435 000 $ US |
| 2013 | 6 386 107 000 $ US | 2 747 304 000 $ US | 7 424 592 000 $ US | 1 806 965 000 $ US | 1 536 652 000 $ US |
| 2012 | 5 529 457 000 $ US | 2 525 523 000 $ US | 6 348 214 000 $ US | 1 845 480 000 $ US | 1 445 106 000 $ US |
| 2011 | 5 140 912 000 $ US | 2 287 151 000 $ US | 5 976 120 000 $ US | 1 682 523 000 $ US | 1 233 372 000 $ US |
| 2010 | 3 880 078 000 $ US | 1 771 499 000 $ US | 3 604 654 000 $ US | 1 183 403 000 $ US | 1 218 997 000 $ US |
| 2009 | 4 671 599 000 $ US | 1 250 708 000 $ US | 2 341 457 000 $ US | 548 810 000 $ US | 1 303 199 000 $ US |
| 2008 | 4 585 692 000 $ US | 1 344 856 000 $ US | 2 130 874 000 $ US | 656 952 000 $ US | 1 428 018 000 $ US |
| 2007 | 4 432 199 000 $ US | 1 150 888 000 $ US | 1 673 983 000 $ US | 542 713 000 $ US | 1 152 368 000 $ US |
| 2006 | 3 260 109 000 $ US | 825 184 000 $ US | 1 409 548 000 $ US | 354 831 000 $ US | 918 156 000 $ US |
| 2005 | 2 263 893 000 $ US | 639 871 000 $ US | 1 272 519 000 $ US | 261 658 000 $ US | 683 780 000 $ US |
| 2004 | 1 969 574 000 $ US | 534 750 000 $ US | 923 821 000 $ US | 183 467 000 $ US | 504 263 000 $ US |
| 2003 | 1 575 836 000 $ US | 357 666 000 $ US | 601 923 000 $ US | 114 042 000 $ US | 426 608 000 $ US |
| 2002 | 885 229 000 $ US | 330 968 000 $ US | 410 691 000 $ US | 50 000 000 $ US | 280 509 000 $ US |
| 2001 | 857 954 000 $ US | 312 827 000 $ US | 366 937 000 $ US | 71 551 000 $ US | 117 003 000 $ US |
En 2025, les exportations de biens s'élevaient à 28,5 milliards de dollars vers les Émirats arabes unis, 8,81 milliards de dollars vers l'Inde, 7,32 milliards de dollars vers la Chine, 3,18 milliards de dollars vers la Turquie et 2,95 milliards de dollars vers Bahreïn. Le changement le plus récent dans leur ordre remonte à 2025, quand les exportations de l'Arabie saoudite vers les Émirats arabes unis ont dépassé celles vers l'Inde.
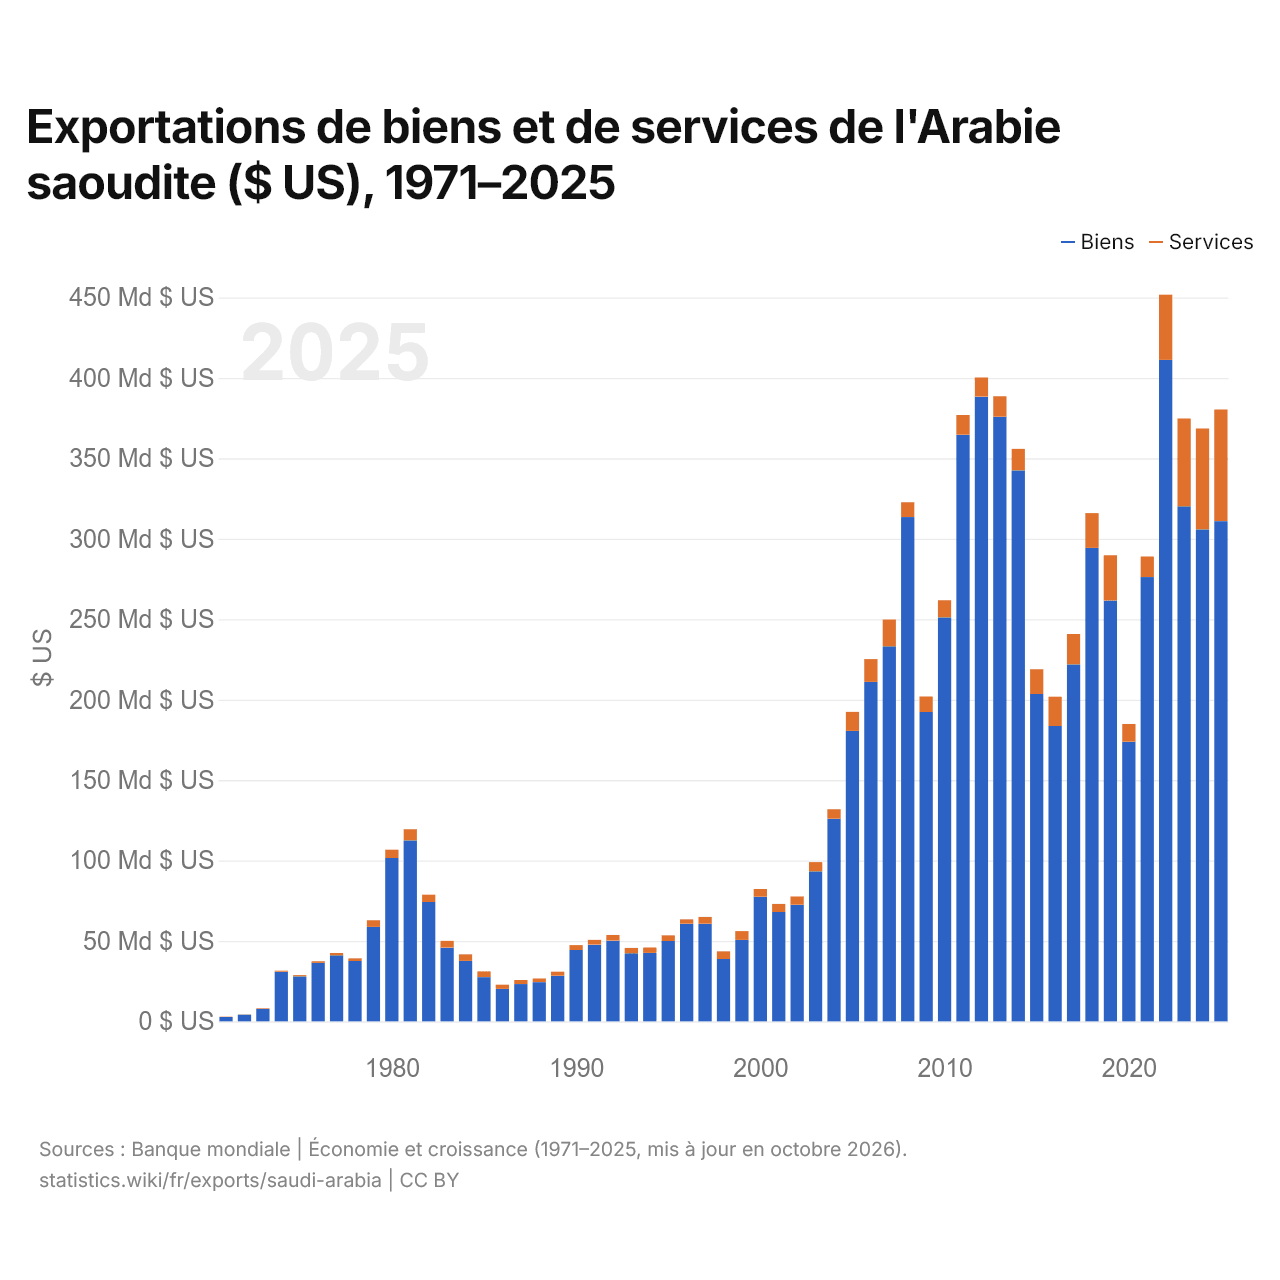
Exportations de biens et de services de l'Arabie saoudite ($ US), 1971–2025
| Année | $ US | |
|---|---|---|
| Biens | Services | |
| 2025 | 310 958 756 760 $ US | 69 411 317 974 $ US |
| 2024 | 305 776 968 328 $ US | 62 790 183 813 $ US |
| 2023 | 320 220 014 287 $ US | 54 567 987 019 $ US |
| 2022 | 411 213 614 018 $ US | 40 551 902 865 $ US |
| 2021 | 276 198 400 000 $ US | 12 747 253 138 $ US |
| 2020 | 173 864 000 000 $ US | 11 001 516 771 $ US |
| 2019 | 261 617 163 552 $ US | 28 145 423 048 $ US |
| 2018 | 294 387 200 000 $ US | 21 565 192 178 $ US |
| 2017 | 221 861 671 481 $ US | 18 916 201 763 $ US |
| 2016 | 183 607 466 667 $ US | 18 196 166 816 $ US |
| 2015 | 203 536 533 333 $ US | 15 391 972 225 $ US |
| 2014 | 342 456 880 000 $ US | 13 420 203 330 $ US |
| 2013 | 375 900 941 867 $ US | 12 750 628 941 $ US |
| 2012 | 388 369 600 000 $ US | 11 880 644 915 $ US |
| 2011 | 364 698 649 600 $ US | 12 260 581 718 $ US |
| 2010 | 251 142 666 675 $ US | 10 617 979 860 $ US |
| 2009 | 192 307 200 000 $ US | 9 627 870 727 $ US |
| 2008 | 313 480 533 333 $ US | 9 196 203 154 $ US |
| 2007 | 233 174 133 333 $ US | 16 655 344 003 $ US |
| 2006 | 211 023 466 667 $ US | 14 199 073 575 $ US |
| 2005 | 180 571 733 333 $ US | 11 804 005 753 $ US |
| 2004 | 125 997 600 000 $ US | 5 851 733 333 $ US |
| 2003 | 93 244 106 667 $ US | 5 712 800 000 $ US |
| 2002 | 72 464 266 667 $ US | 5 176 933 333 $ US |
| 2001 | 67 972 800 000 $ US | 5 007 746 133 $ US |
| 2000 | 77 480 533 333 $ US | 4 778 933 333 $ US |
| 1999 | 50 688 933 333 $ US | 5 372 533 333 $ US |
| 1998 | 38 770 133 333 $ US | 4 723 200 000 $ US |
| 1997 | 60 651 466 667 $ US | 4 250 933 333 $ US |
| 1996 | 60 647 733 333 $ US | 2 768 533 333 $ US |
| 1995 | 49 974 133 333 $ US | 3 475 466 667 $ US |
| 1994 | 42 557 333 333 $ US | 3 342 133 333 $ US |
| 1993 | 42 338 666 667 $ US | 3 278 666 667 $ US |
| 1992 | 50 220 000 000 $ US | 3 461 866 667 $ US |
| 1991 | 47 725 333 333 $ US | 2 904 000 000 $ US |
| 1990 | 44 354 666 667 $ US | 3 026 666 667 $ US |
| 1989 | 28 346 666 667 $ US | 2 506 666 667 $ US |
| 1988 | 24 344 000 000 $ US | 2 290 666 667 $ US |
| 1987 | 23 168 000 000 $ US | 2 512 000 000 $ US |
| 1986 | 20 168 634 064 $ US | 2 603 709 949 $ US |
| 1985 | 27 478 262 711 $ US | 3 561 434 633 $ US |
| 1984 | 37 544 580 646 $ US | 4 112 025 499 $ US |
| 1983 | 45 864 267 927 $ US | 4 150 795 848 $ US |
| 1982 | 74 202 836 567 $ US | 4 565 116 724 $ US |
| 1981 | 112 422 487 282 $ US | 7 021 416 554 $ US |
| 1980 | 101 573 862 343 $ US | 5 191 265 730 $ US |
| 1979 | 58 771 079 838 $ US | 4 079 341 356 $ US |
| 1978 | 37 534 250 750 $ US | 1 626 680 303 $ US |
| 1977 | 41 051 725 299 $ US | 1 407 066 253 $ US |
| 1976 | 36 314 447 602 $ US | 1 073 654 391 $ US |
| 1975 | 27 888 233 860 $ US | 841 479 839 $ US |
| 1974 | 30 870 422 544 $ US | 645 070 423 $ US |
| 1973 | 7 702 499 438 $ US | 356 122 566 $ US |
| 1972 | 4 058 142 708 $ US | 217 142 000 $ US |
| 1971 | 2 705 696 803 $ US | 153 783 426 $ US |
En 2025, les exportations de biens de l'Arabie saoudite s'élevaient à 311 milliards de dollars et celles de services à 69,4 milliards de dollars ; les services représentaient 18,2 % du total, contre 5,4 % en 1971.
L'Arabie saoudite dans le classement mondial des exportations, 2025
| Rang | Pays | Exportations | Part mondiale | |
|---|---|---|---|---|
| 24 |
 Thaïlande |
411 Md $US | 1,18 % | |
| 25 |
 Brésil |
406 Md $US | 1,16 % | |
| 26 |
Turquie
|
397 Md $US | 1,14 % | vs Turquie |
| 27 |
 Arabie saoudite |
380 Md $US | 1,09 % | |
| 28 |
 Suède |
356 Md $US | 1,02 % | |
| 29 |
 Malaisie |
335 Md $US | 0,96 % | |
| 30 |
 Indonésie |
330 Md $US | 0,95 % | vs Indonésie |
Exportations de biens et services de l'Arabie saoudite, % du PIB, 1968–2025
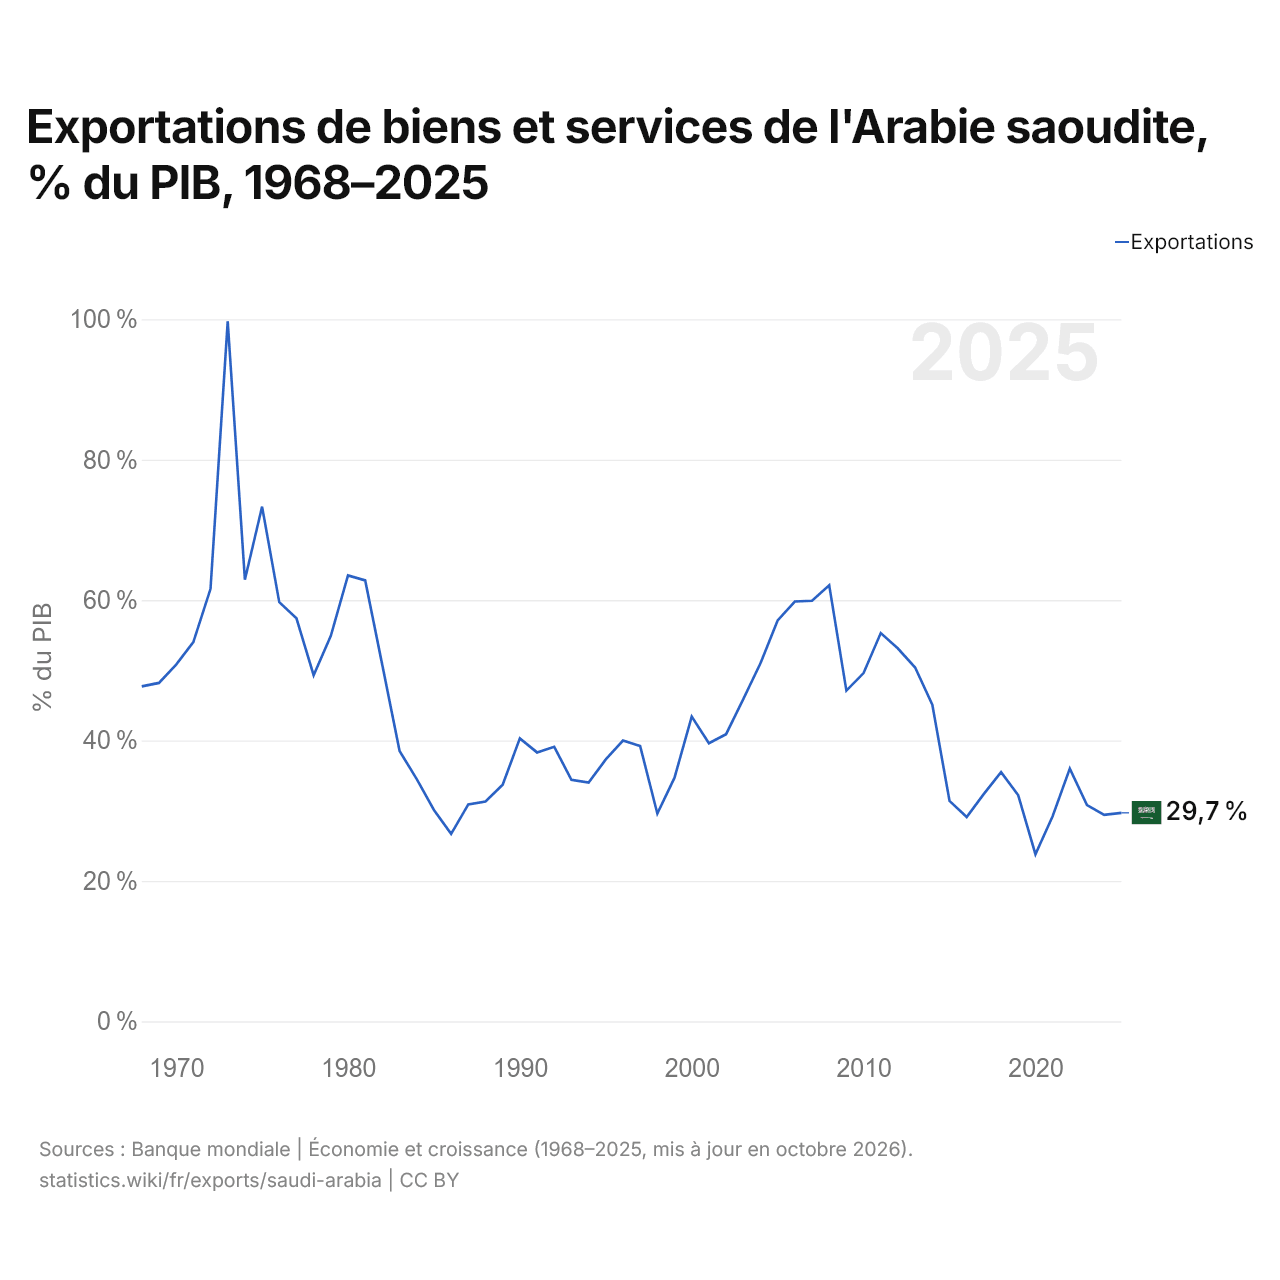
En 2025, les exportations de biens et services de l'Arabie saoudite équivalaient à 29,7 % de son PIB, contre 47,7 % en 1968. La part la plus élevée a été de 99,7 %, en 1973.
Comparer les exportations de l'Arabie saoudite avec celles d'autres pays
Sources :
- TradeMap (2001–2025, mis à jour en octobre 2026)
- Banque mondiale | Économie et croissance (1968–2025, mis à jour en octobre 2026)
Creative Commons Attribution (CC BY) : vous pouvez copier, partager, adapter et réutiliser ce contenu, y compris à des fins commerciales, à condition de citer statistics.wiki et d’indiquer les modifications apportées. Les sources citées ci-dessus peuvent avoir leurs propres conditions de licence.