
Exportations de biens et services de la Malaisie par année ($ US), 1960–2025
| Année | $ US | Rang mondial |
|---|---|---|
| Exportations | Rang mondial | |
| 2025 | 335 105 024 619 $ US | #29 |
| 2024 | 301 221 326 764 $ US | #31 |
| 2023 | 274 681 075 590 $ US | #32 |
| 2022 | 313 245 644 474 $ US | #30 |
| 2021 | 264 015 450 976 $ US | #30 |
| 2020 | 207 798 540 353 $ US | #29 |
| 2019 | 238 379 861 290 $ US | #30 |
| 2018 | 245 967 590 635 $ US | #30 |
| 2017 | 223 413 837 325 $ US | #30 |
| 2016 | 201 165 058 575 $ US | #28 |
| 2015 | 209 287 287 857 $ US | #28 |
| 2014 | 249 470 799 240 $ US | #27 |
| 2013 | 244 490 716 806 $ US | #26 |
| 2012 | 249 353 066 125 $ US | #24 |
| 2011 | 254 020 012 399 $ US | #25 |
| 2010 | 221 687 585 588 $ US | #25 |
| 2009 | 184 897 274 878 $ US | #24 |
| 2008 | 229 656 580 530 $ US | #24 |
| 2007 | 205 488 238 927 $ US | #22 |
| 2006 | 182 517 092 278 $ US | #22 |
| 2005 | 162 048 875 496 $ US | #21 |
| 2004 | 143 927 631 579 $ US | #20 |
| 2003 | 117 854 210 526 $ US | #20 |
| 2002 | 109 221 052 632 $ US | #20 |
| 2001 | 102 435 789 474 $ US | #20 |
| 2000 | 112 369 210 526 $ US | #19 |
| 1999 | 96 016 052 632 $ US | #18 |
| 1998 | 83 529 351 814 $ US | #20 |
| 1997 | 93 294 414 082 $ US | #19 |
| 1996 | 92 359 488 036 $ US | #19 |
| 1995 | 83 462 121 212 $ US | #19 |
| 1994 | 66 398 033 836 $ US | #19 |
| 1993 | 52 793 700 310 $ US | #21 |
| 1992 | 44 957 788 511 $ US | #24 |
| 1991 | 38 245 926 680 $ US | #24 |
| 1990 | 32 783 400 342 $ US | #24 |
| 1989 | 27 728 453 708 $ US | #25 |
| 1988 | 23 426 148 711 $ US | #26 |
| 1987 | 20 240 209 109 $ US | #26 |
| 1986 | 15 613 366 483 $ US | #27 |
| 1985 | 17 131 003 020 $ US | #26 |
| 1984 | 18 420 475 482 $ US | #26 |
| 1983 | 15 637 264 405 $ US | #27 |
| 1982 | 13 636 254 642 $ US | #30 |
| 1981 | 13 086 963 598 $ US | #30 |
| 1980 | 14 091 708 190 $ US | #31 |
| 1979 | 11 882 425 945 $ US | #31 |
| 1978 | 8 024 465 878 $ US | #32 |
| 1977 | 6 588 433 756 $ US | #32 |
| 1976 | 5 726 370 459 $ US | #33 |
| 1975 | 4 235 509 660 $ US | #34 |
| 1974 | 4 587 741 014 $ US | #33 |
| 1973 | 3 178 858 361 $ US | #33 |
| 1972 | 1 816 243 409 $ US | #36 |
| 1971 | 1 717 415 948 $ US | #33 |
| 1970 | 1 760 409 249 $ US | #29 |
| 1969 | 1 730 355 871 $ US | - |
| 1968 | 1 439 622 111 $ US | - |
| 1967 | 1 306 341 916 $ US | - |
| 1966 | 1 336 395 293 $ US | - |
| 1965 | 1 327 248 613 $ US | - |
| 1964 | 1 178 941 729 $ US | - |
| 1963 | 1 147 581 683 $ US | - |
| 1962 | 921 528 018 $ US | - |
| 1961 | 921 854 685 $ US | - |
| 1960 | 1 016 914 825 $ US | - |
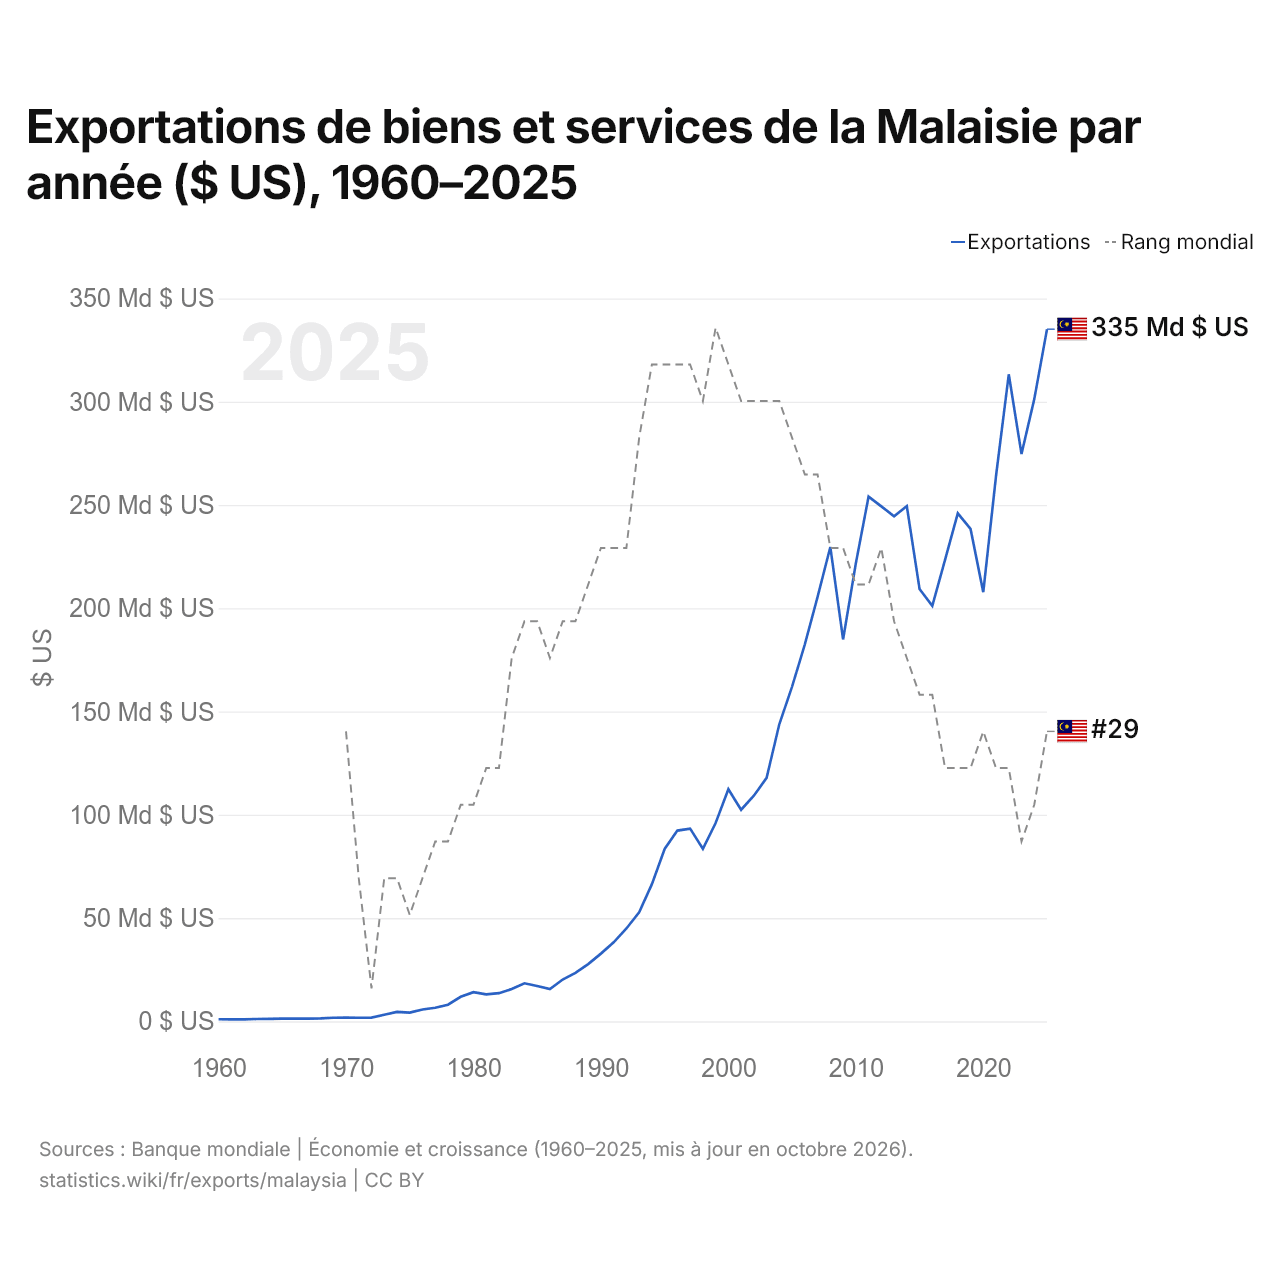
En 2025, les exportations de biens et services de la Malaisie s'élevaient à 335 milliards de dollars, contre 1,02 milliard de dollars en 1960. Le minimum a été de 922 millions de dollars, en 1962. Elles se classaient au 29e rang mondial, en hausse par rapport au 31e rang en 2024. Leur meilleur rang a été le 18e, occupé pour la dernière fois en 1999.
En 2025, les exportations de biens et services de la Malaisie étaient les 12es plus élevées de 44 pays situés en Asie. Les importations de biens et services de la Malaisie s'élevaient à 309 milliards de dollars en 2025, au 29e rang mondial. En 2025, les exportations de la Malaisie dépassaient ses importations de 26,2 milliards de dollars, soit un excédent commercial.
Exportations de biens de la Malaisie par catégorie, 2025
Exportations de biens, 2025: 375 Md $US
En 2025, la première catégorie des exportations de biens de la Malaisie était « machines, électronique et véhicules », avec 57,2 %, suivie de « pétrole, gaz, minerais et autres matières premières », avec 14,7 %.
Destinations des exportations de biens de la Malaisie : les 10 premières, 2025
| Rang | Pays | Exportations de biens | Part | |
|---|---|---|---|---|
| 1 |
 Singapour |
58,3 Md $US | 15,5 % | vs Singapour |
| 2 |
 États-Unis |
54,4 Md $US | 14,5 % | |
| 3 |
 Chine |
44,1 Md $US | 11,8 % | vs Chine |
| 4 |
 Japon |
17,8 Md $US | 4,75 % | vs Japon |
| 5 |
 Thaïlande |
15,0 Md $US | 3,99 % | vs Thaïlande |
| 6 |
 Vietnam |
12,9 Md $US | 3,44 % | vs Vietnam |
| 7 |
 Corée du Sud |
12,3 Md $US | 3,28 % | vs Corée du Sud |
| 8 |
 Inde |
12,2 Md $US | 3,26 % | |
| 9 |
 Indonésie |
12,0 Md $US | 3,19 % | vs Indonésie |
| 10 |
 Australie |
11,4 Md $US | 3,03 % | |
| Autres partenaires et non précisés | 125 Md $US | 33,3 % |
Exportations de biens de la Malaisie vers ses 5 principales destinations ($ US), 2001–2025
| Année | $ US | ||||
|---|---|---|---|---|---|
| Singapour | États-Unis | Chine | Japon | Thaïlande | |
| 2025 | 58 303 756 000 $ US | 54 445 627 000 $ US | 44 130 895 000 $ US | 17 844 423 000 $ US | 14 969 445 000 $ US |
| 2024 | 50 536 731 000 $ US | 43 512 765 000 $ US | 41 081 818 000 $ US | 18 084 921 000 $ US | 12 911 879 000 $ US |
| 2023 | 48 142 314 000 $ US | 35 492 137 000 $ US | 42 195 719 000 $ US | 18 813 393 000 $ US | 12 886 405 000 $ US |
| 2022 | 52 928 153 000 $ US | 38 075 981 000 $ US | 47 934 522 000 $ US | 22 357 885 000 $ US | 14 984 878 000 $ US |
| 2021 | 41 855 577 000 $ US | 34 372 619 000 $ US | 46 360 706 000 $ US | 18 170 240 000 $ US | 12 648 581 000 $ US |
| 2020 | 33 846 404 000 $ US | 25 940 693 000 $ US | 37 758 818 000 $ US | 14 686 769 000 $ US | 10 777 697 000 $ US |
| 2019 | 33 050 887 000 $ US | 23 146 016 000 $ US | 33 706 910 000 $ US | 15 753 503 000 $ US | 13 475 084 000 $ US |
| 2018 | 34 498 254 000 $ US | 22 546 148 000 $ US | 34 439 740 000 $ US | 17 125 944 000 $ US | 14 076 943 000 $ US |
| 2017 | 31 558 974 000 $ US | 20 662 227 000 $ US | 29 361 911 000 $ US | 17 431 058 000 $ US | 11 759 167 000 $ US |
| 2016 | 27 646 509 000 $ US | 19 399 587 000 $ US | 23 809 577 000 $ US | 15 286 460 000 $ US | 10 653 435 000 $ US |
| 2015 | 27 937 522 000 $ US | 18 992 742 000 $ US | 26 151 439 000 $ US | 19 011 633 000 $ US | 11 442 103 000 $ US |
| 2014 | 33 262 666 000 $ US | 19 702 600 000 $ US | 28 222 683 000 $ US | 25 276 973 000 $ US | 12 307 657 000 $ US |
| 2013 | 31 778 866 000 $ US | 18 440 580 000 $ US | 30 775 462 000 $ US | 25 115 837 000 $ US | 12 660 984 000 $ US |
| 2012 | 30 931 146 000 $ US | 19 718 960 000 $ US | 28 742 900 000 $ US | 26 997 638 000 $ US | 12 182 165 000 $ US |
| 2011 | 28 812 577 000 $ US | 18 850 437 000 $ US | 29 821 382 000 $ US | 26 134 473 000 $ US | 11 674 034 000 $ US |
| 2010 | 26 552 830 000 $ US | 18 981 095 000 $ US | 25 057 169 000 $ US | 20 611 236 000 $ US | 10 628 483 000 $ US |
| 2009 | 21 931 898 000 $ US | 17 235 960 000 $ US | 19 103 882 000 $ US | 15 462 309 000 $ US | 8 481 072 000 $ US |
| 2008 | 29 064 213 000 $ US | 24 810 581 000 $ US | 19 012 612 000 $ US | 21 186 469 000 $ US | 9 478 651 000 $ US |
| 2007 | 25 590 475 000 $ US | 27 543 325 000 $ US | 15 443 851 000 $ US | 16 203 924 000 $ US | 8 612 231 000 $ US |
| 2006 | 24 757 812 000 $ US | 30 186 525 000 $ US | 11 638 253 000 $ US | 14 244 768 000 $ US | 8 499 268 000 $ US |
| 2005 | 22 078 783 000 $ US | 27 815 727 000 $ US | 9 284 400 000 $ US | 13 340 230 000 $ US | 7 592 167 000 $ US |
| 2004 | 18 931 037 000 $ US | 23 767 415 000 $ US | 8 496 381 000 $ US | 12 762 911 000 $ US | 6 026 435 000 $ US |
| 2003 | 16 522 635 000 $ US | 20 539 529 000 $ US | 6 810 027 000 $ US | 11 221 733 000 $ US | 4 615 312 000 $ US |
| 2002 | 15 964 090 000 $ US | 18 828 725 000 $ US | 5 254 156 000 $ US | 10 467 443 000 $ US | 3 972 624 000 $ US |
| 2001 | 14 912 904 000 $ US | 17 815 888 000 $ US | 3 820 992 000 $ US | 11 711 219 000 $ US | 3 359 950 000 $ US |
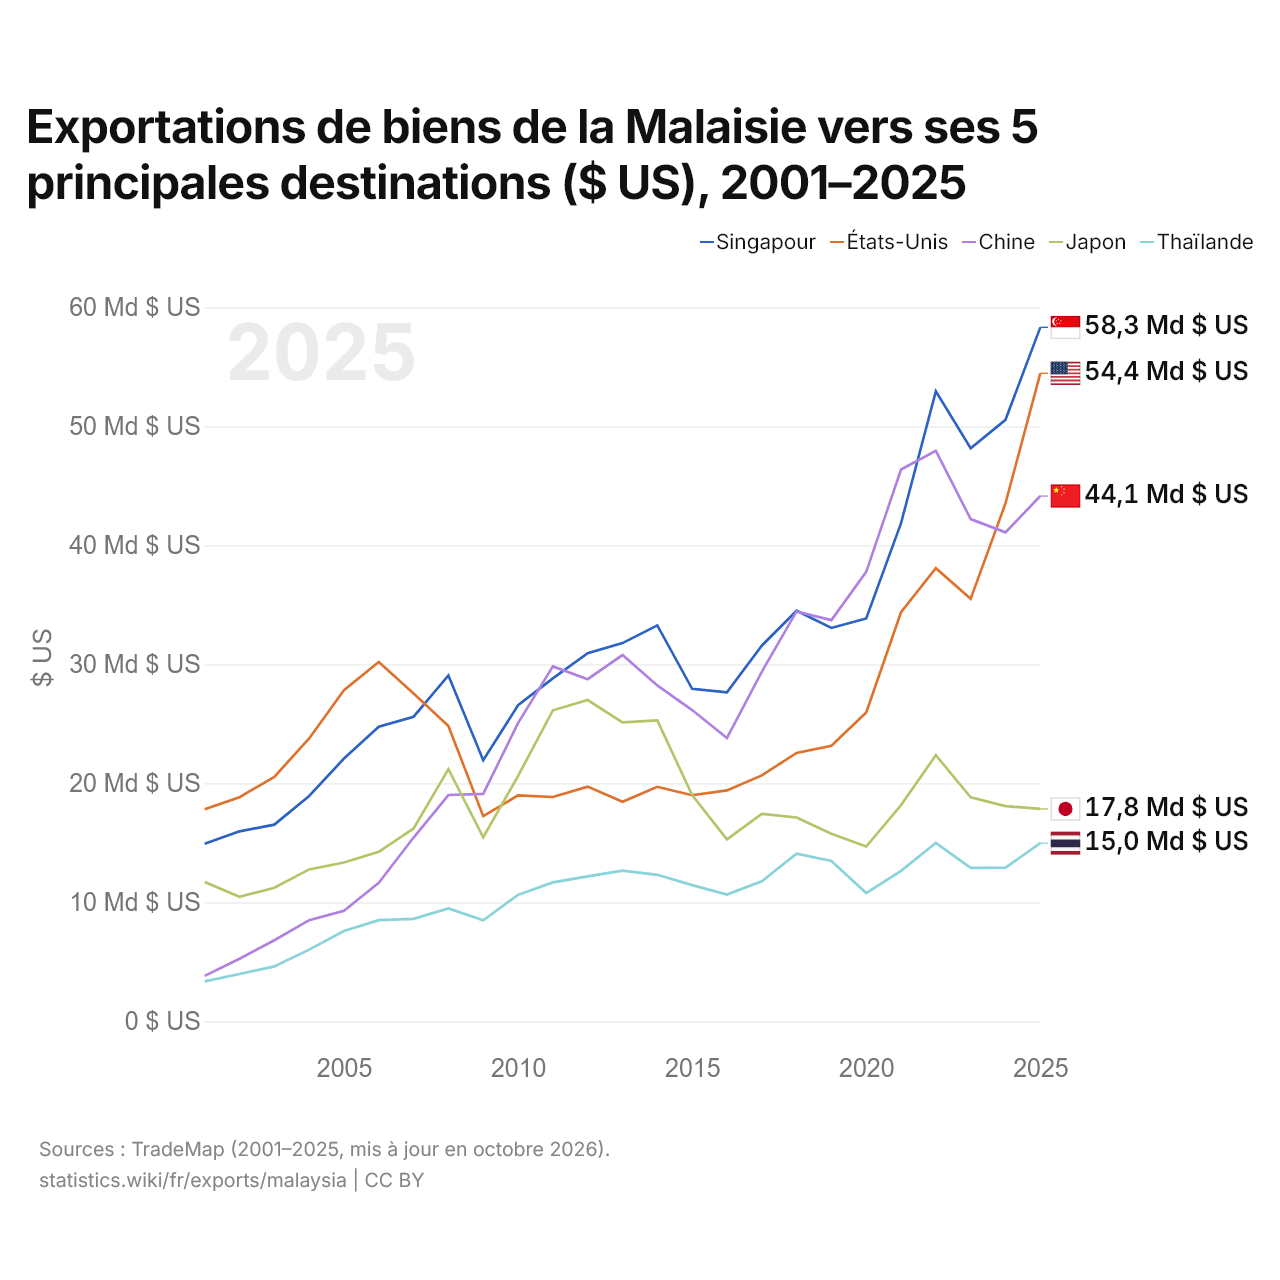
En 2025, les exportations de biens s'élevaient à 58,3 milliards de dollars vers Singapour, 54,4 milliards de dollars vers les États-Unis, 44,1 milliards de dollars vers la Chine, 17,8 milliards de dollars vers le Japon et 15 milliards de dollars vers la Thaïlande. Le premier rang des cinq destinations de la Malaisie est occupé par Singapour depuis 2022. Le changement le plus récent dans leur ordre remonte à 2024, quand les exportations de la Malaisie vers les États-Unis ont dépassé celles vers la Chine.
Exportations de biens et de services de la Malaisie ($ US), 1974–2025
| Année | $ US | |
|---|---|---|
| Biens | Services | |
| 2025 | 276 969 169 770 $ US | 65 021 579 202 $ US |
| 2024 | 249 808 619 669 $ US | 52 717 181 185 $ US |
| 2023 | 232 008 840 846 $ US | 42 667 586 609 $ US |
| 2022 | 280 937 810 570 $ US | 31 942 077 455 $ US |
| 2021 | 242 589 871 740 $ US | 21 245 983 014 $ US |
| 2020 | 186 061 725 691 $ US | 22 155 193 218 $ US |
| 2019 | 197 272 482 850 $ US | 41 088 650 981 $ US |
| 2018 | 205 655 448 514 $ US | 40 230 526 274 $ US |
| 2017 | 186 586 103 000 $ US | 37 115 785 947 $ US |
| 2016 | 165 520 019 572 $ US | 35 600 533 128 $ US |
| 2015 | 174 630 973 654 $ US | 34 937 198 258 $ US |
| 2014 | 207 482 725 607 $ US | 42 056 108 582 $ US |
| 2013 | 202 285 344 605 $ US | 42 100 106 118 $ US |
| 2012 | 208 795 078 593 $ US | 40 581 121 799 $ US |
| 2011 | 215 164 017 943 $ US | 38 842 713 816 $ US |
| 2010 | 187 335 559 432 $ US | 34 676 139 483 $ US |
| 2009 | 158 058 040 692 $ US | 28 291 461 584 $ US |
| 2008 | 199 222 448 139 $ US | 30 751 381 927 $ US |
| 2007 | 176 545 189 705 $ US | 29 075 806 055 $ US |
| 2006 | 161 484 902 705 $ US | 21 080 904 111 $ US |
| 2005 | 141 602 986 006 $ US | 19 749 687 611 $ US |
| 2004 | 126 589 236 842 $ US | 17 311 228 947 $ US |
| 2003 | 104 929 500 000 $ US | 13 640 342 105 $ US |
| 2002 | 93 315 868 421 $ US | 14 918 421 053 $ US |
| 2001 | 87 791 578 947 $ US | 14 571 315 789 $ US |
| 2000 | 98 240 526 316 $ US | 14 045 894 737 $ US |
| 1999 | 83 874 236 842 $ US | 12 093 368 421 $ US |
| 1998 | 71 882 783 883 $ US | 11 516 738 334 $ US |
| 1997 | 77 538 264 664 $ US | 15 727 332 241 $ US |
| 1996 | 76 985 066 233 $ US | 15 135 481 037 $ US |
| 1995 | 71 767 170 169 $ US | 11 601 561 915 $ US |
| 1994 | 56 897 254 715 $ US | 9 319 972 513 $ US |
| 1993 | 46 237 998 209 $ US | 6 411 573 776 $ US |
| 1992 | 39 822 824 729 $ US | 4 989 041 042 $ US |
| 1991 | 33 711 910 014 $ US | 4 374 439 408 $ US |
| 1990 | 28 805 767 364 $ US | 3 858 958 362 $ US |
| 1989 | 24 775 903 600 $ US | 2 870 230 511 $ US |
| 1988 | 20 979 971 615 $ US | 2 378 967 332 $ US |
| 1987 | 17 876 771 997 $ US | 2 272 548 375 $ US |
| 1986 | 13 655 160 392 $ US | 1 981 450 933 $ US |
| 1985 | 15 250 650 244 $ US | 1 934 321 145 $ US |
| 1984 | 16 520 870 302 $ US | 1 932 462 656 $ US |
| 1983 | 13 804 200 328 $ US | 1 851 157 782 $ US |
| 1982 | 12 069 924 036 $ US | 1 579 178 368 $ US |
| 1981 | 11 771 062 772 $ US | 1 315 466 826 $ US |
| 1980 | 12 962 568 816 $ US | 1 135 109 063 $ US |
| 1979 | 11 073 633 068 $ US | 790 059 898 $ US |
| 1978 | 7 380 264 463 $ US | 627 795 269 $ US |
| 1977 | 6 093 162 783 $ US | 491 207 162 $ US |
| 1976 | 5 292 781 053 $ US | 398 178 295 $ US |
| 1975 | 3 826 160 820 $ US | 409 811 526 $ US |
| 1974 | 4 199 302 056 $ US | 372 237 301 $ US |
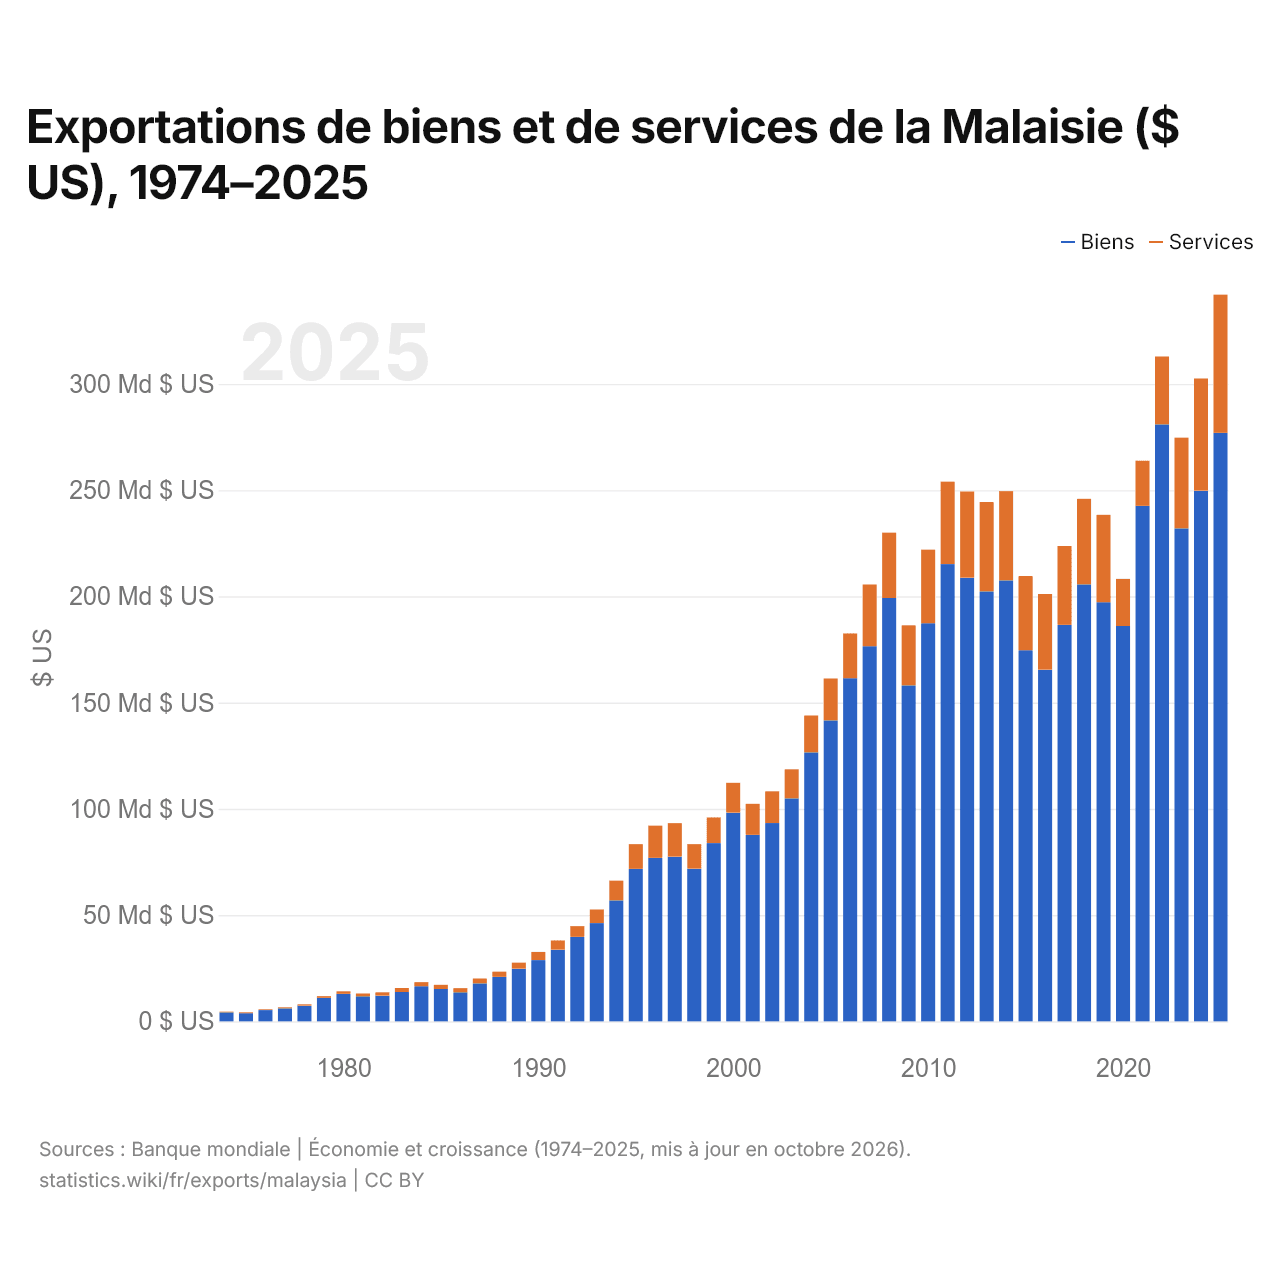
En 2025, les exportations de biens de la Malaisie s'élevaient à 277 milliards de dollars et celles de services à 65 milliards de dollars ; les services représentaient 19,0 % du total, contre 8,1 % en 1974.
La Malaisie dans le classement mondial des exportations, 2025
| Rang | Pays | Exportations | Part mondiale | |
|---|---|---|---|---|
| 26 |
 Turquie |
397 Md $US | 1,14 % | vs Turquie |
| 27 |
 Arabie saoudite |
380 Md $US | 1,09 % | |
| 28 |
 Suède |
356 Md $US | 1,02 % | |
| 29 |
 Malaisie |
335 Md $US | 0,96 % | |
| 30 |
Indonésie
|
330 Md $US | 0,95 % | vs Indonésie |
| 31 |
 Danemark |
324 Md $US | 0,93 % | |
| 32 |
 Autriche |
317 Md $US | 0,91 % |
Exportations de biens et services de la Malaisie, % du PIB, 1960–2025
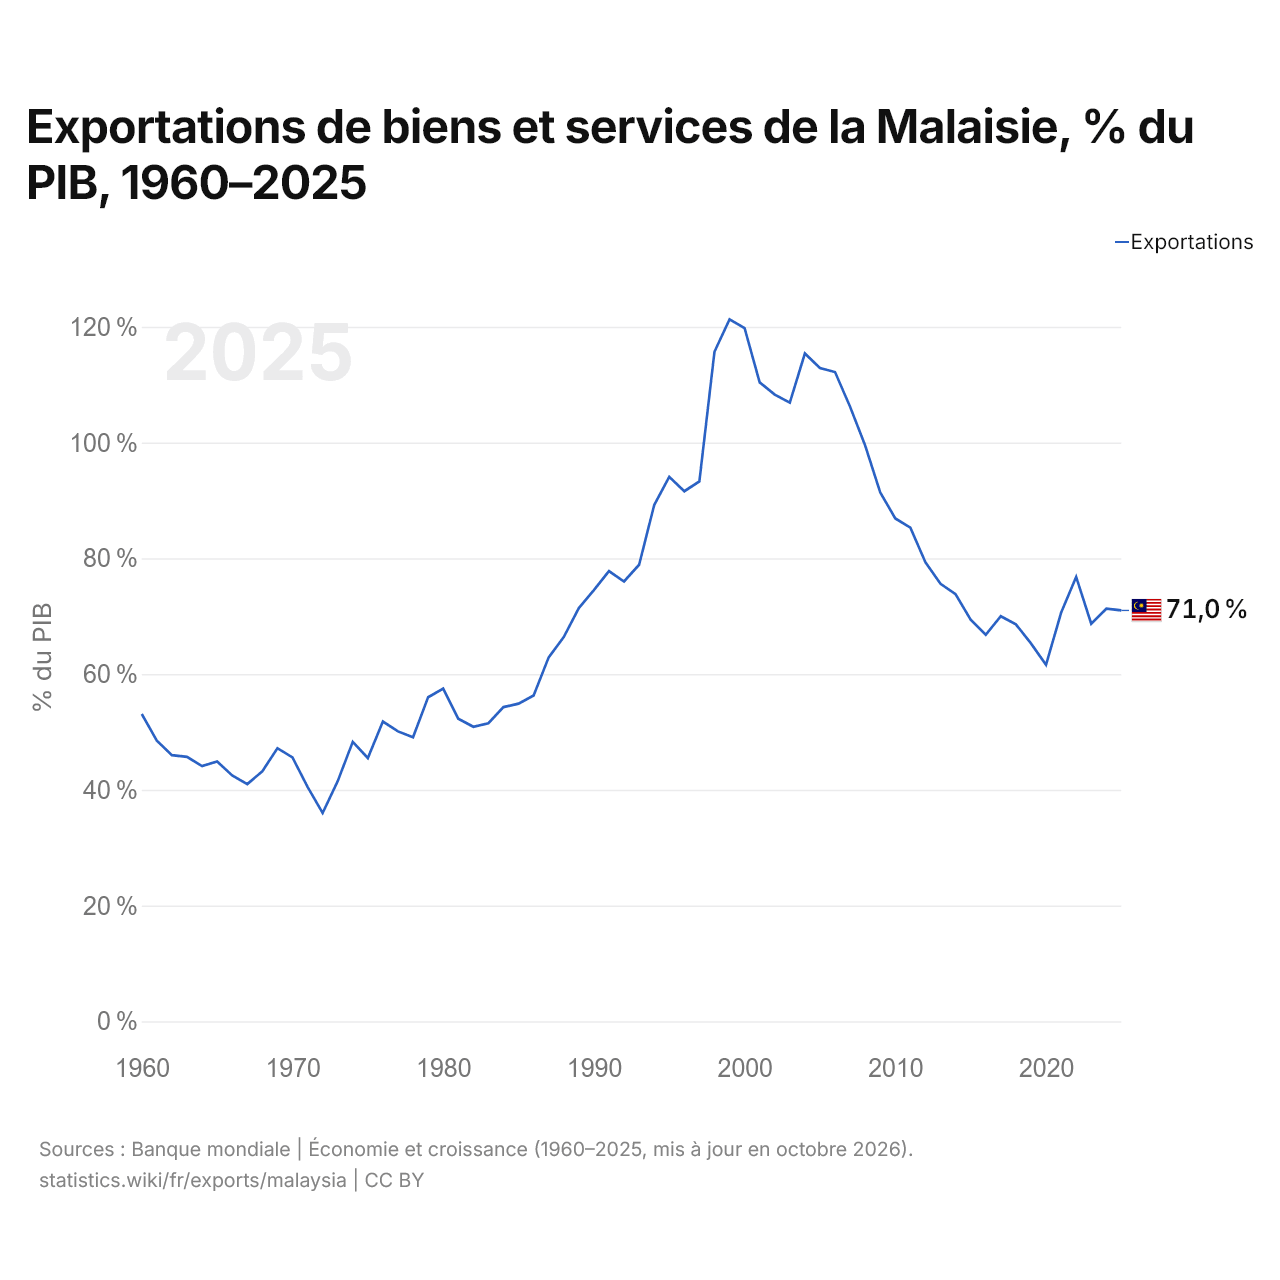
En 2025, les exportations de biens et services de la Malaisie équivalaient à 71,0 % de son PIB, contre 53,1 % en 1960. La part la plus élevée a été de 121,3 %, en 1999.
Comparer les exportations de la Malaisie avec celles d'autres pays
Sources :
- TradeMap (2001–2025, mis à jour en octobre 2026)
- Banque mondiale | Économie et croissance (1960–2025, mis à jour en octobre 2026)
Creative Commons Attribution (CC BY) : vous pouvez copier, partager, adapter et réutiliser ce contenu, y compris à des fins commerciales, à condition de citer statistics.wiki et d’indiquer les modifications apportées. Les sources citées ci-dessus peuvent avoir leurs propres conditions de licence.