
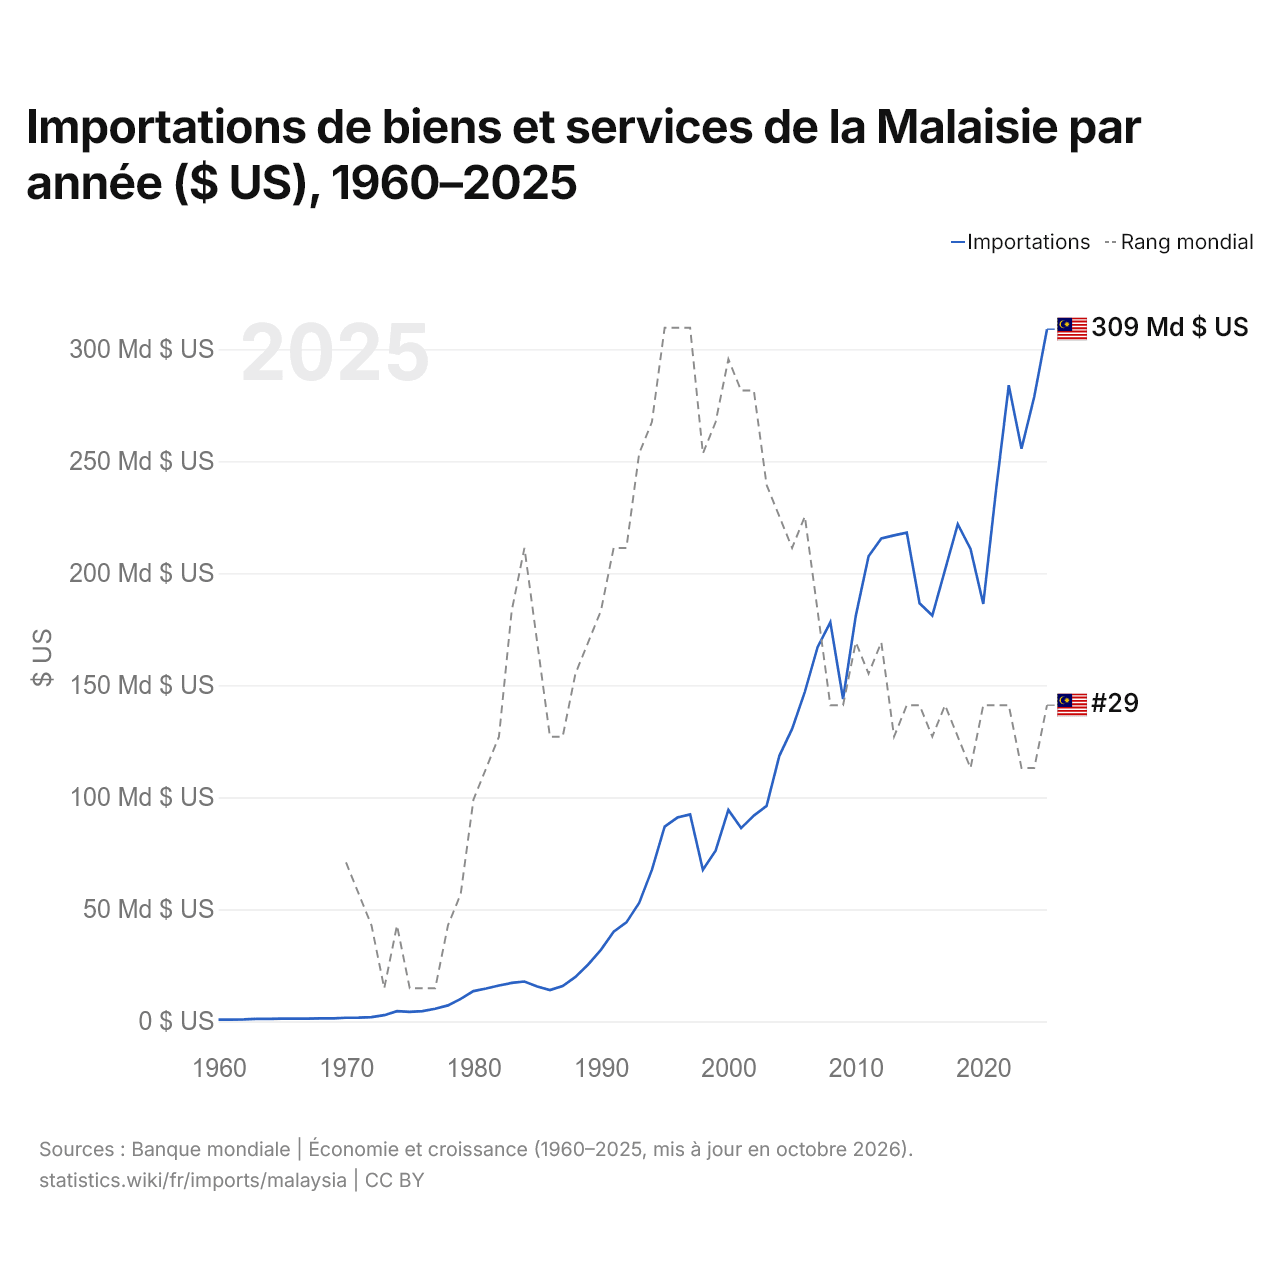
Importations de biens et services de la Malaisie par année ($ US), 1960–2025
| Année | $ US | Rang mondial |
|---|---|---|
| Importations | Rang mondial | |
| 2025 | 308 949 499 863 $ US | #29 |
| 2024 | 278 760 544 031 $ US | #31 |
| 2023 | 255 625 703 550 $ US | #31 |
| 2022 | 283 918 591 272 $ US | #29 |
| 2021 | 236 990 392 678 $ US | #29 |
| 2020 | 186 310 380 061 $ US | #29 |
| 2019 | 210 893 037 729 $ US | #31 |
| 2018 | 221 902 484 183 $ US | #30 |
| 2017 | 201 496 430 250 $ US | #29 |
| 2016 | 181 125 866 049 $ US | #30 |
| 2015 | 186 603 344 673 $ US | #29 |
| 2014 | 218 115 959 742 $ US | #29 |
| 2013 | 216 892 331 705 $ US | #30 |
| 2012 | 215 525 053 249 $ US | #27 |
| 2011 | 207 619 404 295 $ US | #28 |
| 2010 | 181 099 423 890 $ US | #27 |
| 2009 | 143 890 358 442 $ US | #29 |
| 2008 | 178 114 431 987 $ US | #29 |
| 2007 | 167 027 920 021 $ US | #26 |
| 2006 | 147 060 242 731 $ US | #23 |
| 2005 | 130 552 677 358 $ US | #24 |
| 2004 | 118 513 157 895 $ US | #23 |
| 2003 | 96 153 421 053 $ US | #22 |
| 2002 | 91 820 789 474 $ US | #19 |
| 2001 | 86 253 947 368 $ US | #19 |
| 2000 | 94 349 736 842 $ US | #18 |
| 1999 | 76 187 894 737 $ US | #20 |
| 1998 | 67 655 931 512 $ US | #21 |
| 1997 | 92 380 580 595 $ US | #17 |
| 1996 | 90 962 318 149 $ US | #17 |
| 1995 | 86 952 551 834 $ US | #17 |
| 1994 | 67 592 211 553 $ US | #20 |
| 1993 | 52 860 519 911 $ US | #21 |
| 1992 | 44 155 181 215 $ US | #24 |
| 1991 | 40 044 733 779 $ US | #24 |
| 1990 | 31 883 543 602 $ US | #26 |
| 1989 | 25 372 465 430 $ US | #27 |
| 1988 | 19 826 003 147 $ US | #28 |
| 1987 | 15 776 869 534 $ US | #30 |
| 1986 | 13 922 838 476 $ US | #30 |
| 1985 | 15 529 741 341 $ US | #27 |
| 1984 | 17 772 765 636 $ US | #24 |
| 1983 | 17 142 918 686 $ US | #26 |
| 1982 | 15 971 622 751 $ US | #30 |
| 1981 | 14 633 320 675 $ US | #31 |
| 1980 | 13 478 905 389 $ US | #32 |
| 1979 | 9 999 808 083 $ US | #35 |
| 1978 | 7 114 292 401 $ US | #36 |
| 1977 | 5 601 956 378 $ US | #38 |
| 1976 | 4 571 968 169 $ US | #38 |
| 1975 | 4 193 454 364 $ US | #38 |
| 1974 | 4 565 307 073 $ US | #36 |
| 1973 | 2 747 070 596 $ US | #38 |
| 1972 | 1 884 339 236 $ US | #36 |
| 1971 | 1 656 477 495 $ US | #35 |
| 1970 | 1 596 749 009 $ US | #34 |
| 1969 | 1 356 648 656 $ US | - |
| 1968 | 1 322 348 606 $ US | - |
| 1967 | 1 228 595 135 $ US | - |
| 1966 | 1 212 261 778 $ US | - |
| 1965 | 1 194 948 419 $ US | - |
| 1964 | 1 132 554 994 $ US | - |
| 1963 | 1 104 134 953 $ US | - |
| 1962 | 863 381 266 $ US | - |
| 1961 | 790 861 160 $ US | - |
| 1960 | 752 314 437 $ US | - |
En 2025, les importations de biens et services de la Malaisie s'élevaient à 309 milliards de dollars, contre 752 millions de dollars en 1960. Elles se classaient au 29e rang mondial, en hausse par rapport au 31e rang en 2024. Leur meilleur rang a été le 17e, occupé pour la dernière fois en 1997.
En 2025, les importations de biens et services de la Malaisie étaient les 12es plus élevées de 44 pays situés en Asie. En 2025, les exportations de la Malaisie dépassaient ses importations de 26,2 milliards de dollars, soit un excédent commercial. Le commerce de la Malaisie, exportations et importations réunies, équivalait à 136,4 % de son PIB en 2025, au 28e rang mondial.
Importations de biens de la Malaisie par catégorie, 2025
Importations de biens, 2025: 339 Md $US
En 2025, la première catégorie des importations de biens de la Malaisie était « machines, électronique et véhicules », avec 54,4 %, suivie de « pétrole, gaz, minerais et autres matières premières », avec 16,3 %.
Origines des importations de biens de la Malaisie : les 10 premières, 2025
| Rang | Pays | Importations de biens | Part | |
|---|---|---|---|---|
| 1 |
 Chine |
82,4 Md $US | 24,3 % | vs Chine |
| 2 |
 Singapour |
35,7 Md $US | 10,5 % | vs Singapour |
| 3 |
 États-Unis |
30,9 Md $US | 9,11 % | |
| 4 |
 Japon |
15,6 Md $US | 4,59 % | vs Japon |
| 5 |
 Corée du Sud |
15,1 Md $US | 4,44 % | vs Corée du Sud |
| 6 |
 Indonésie |
14,6 Md $US | 4,31 % | vs Indonésie |
| 7 |
 Thaïlande |
12,7 Md $US | 3,75 % | vs Thaïlande |
| 8 |
 Vietnam |
8,62 Md $US | 2,54 % | vs Vietnam |
| 9 |
 Allemagne |
7,13 Md $US | 2,1 % | |
| 10 |
 Australie |
7,01 Md $US | 2,07 % | |
| Autres partenaires et non précisés | 109 Md $US | 32,3 % |
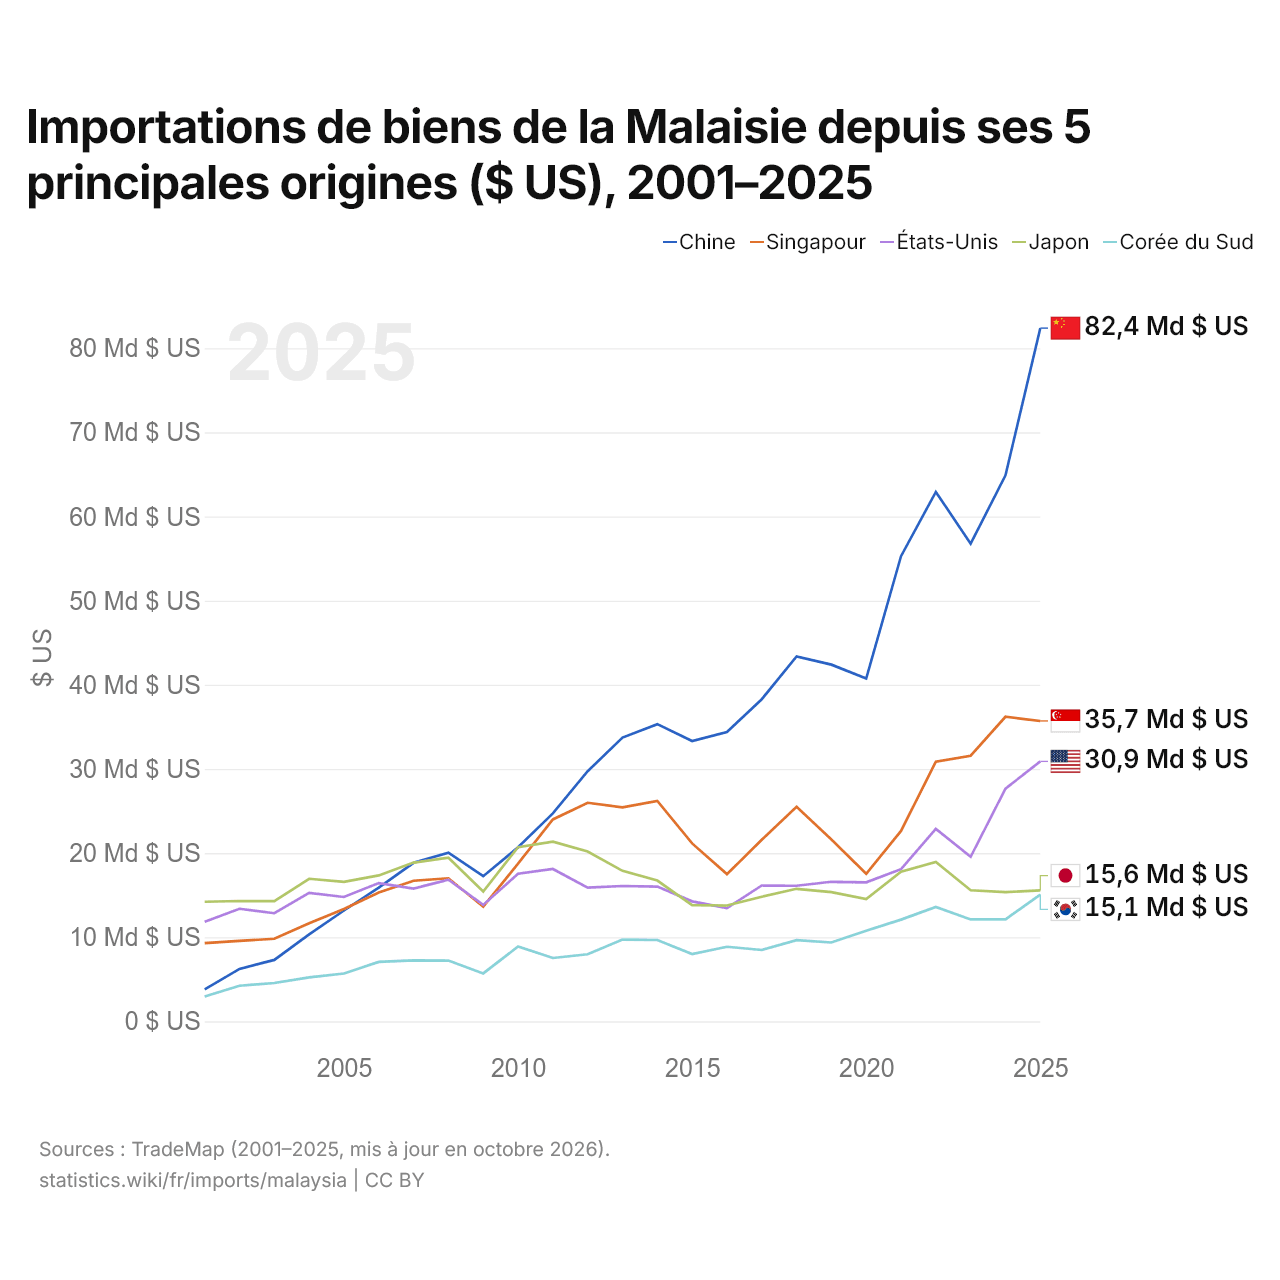
Importations de biens de la Malaisie depuis ses 5 principales origines ($ US), 2001–2025
| Année | $ US | ||||
|---|---|---|---|---|---|
| Chine | Singapour | États-Unis | Japon | Corée du Sud | |
| 2025 | 82 394 835 000 $ US | 35 701 325 000 $ US | 30 896 268 000 $ US | 15 557 292 000 $ US | 15 071 524 000 $ US |
| 2024 | 64 894 112 000 $ US | 36 198 563 000 $ US | 27 649 738 000 $ US | 15 354 307 000 $ US | 12 124 714 000 $ US |
| 2023 | 56 772 167 000 $ US | 31 568 844 000 $ US | 19 554 627 000 $ US | 15 572 253 000 $ US | 12 116 782 000 $ US |
| 2022 | 62 927 993 000 $ US | 30 871 517 000 $ US | 22 872 112 000 $ US | 18 951 096 000 $ US | 13 603 333 000 $ US |
| 2021 | 55 285 162 000 $ US | 22 624 611 000 $ US | 18 083 190 000 $ US | 17 794 100 000 $ US | 12 089 502 000 $ US |
| 2020 | 40 754 170 000 $ US | 17 534 569 000 $ US | 16 525 903 000 $ US | 14 532 350 000 $ US | 10 764 806 000 $ US |
| 2019 | 42 395 009 000 $ US | 21 620 587 000 $ US | 16 584 568 000 $ US | 15 351 881 000 $ US | 9 369 094 000 $ US |
| 2018 | 43 378 353 000 $ US | 25 510 360 000 $ US | 16 116 608 000 $ US | 15 749 962 000 $ US | 9 650 585 000 $ US |
| 2017 | 38 286 785 000 $ US | 21 581 763 000 $ US | 16 146 742 000 $ US | 14 805 199 000 $ US | 8 482 126 000 $ US |
| 2016 | 34 387 414 000 $ US | 17 494 758 000 $ US | 13 450 062 000 $ US | 13 765 631 000 $ US | 8 862 705 000 $ US |
| 2015 | 33 319 278 000 $ US | 21 145 608 000 $ US | 14 260 332 000 $ US | 13 802 748 000 $ US | 7 998 385 000 $ US |
| 2014 | 35 322 309 000 $ US | 26 200 004 000 $ US | 16 009 272 000 $ US | 16 731 372 000 $ US | 9 667 998 000 $ US |
| 2013 | 33 728 561 000 $ US | 25 432 068 000 $ US | 16 087 775 000 $ US | 17 888 705 000 $ US | 9 710 622 000 $ US |
| 2012 | 29 723 042 000 $ US | 25 978 492 000 $ US | 15 884 979 000 $ US | 20 181 275 000 $ US | 7 965 934 000 $ US |
| 2011 | 24 710 273 000 $ US | 23 995 387 000 $ US | 18 106 865 000 $ US | 21 346 068 000 $ US | 7 530 378 000 $ US |
| 2010 | 20 679 866 000 $ US | 18 731 505 000 $ US | 17 551 425 000 $ US | 20 704 520 000 $ US | 8 891 365 000 $ US |
| 2009 | 17 245 921 000 $ US | 13 622 423 000 $ US | 13 835 476 000 $ US | 15 430 301 000 $ US | 5 694 372 000 $ US |
| 2008 | 20 046 602 000 $ US | 17 007 216 000 $ US | 16 834 425 000 $ US | 19 453 713 000 $ US | 7 220 972 000 $ US |
| 2007 | 18 841 698 000 $ US | 16 715 262 000 $ US | 15 776 161 000 $ US | 18 866 751 000 $ US | 7 238 240 000 $ US |
| 2006 | 15 883 589 000 $ US | 15 313 893 000 $ US | 16 434 447 000 $ US | 17 341 034 000 $ US | 7 061 968 000 $ US |
| 2005 | 13 173 660 000 $ US | 13 356 095 000 $ US | 14 776 362 000 $ US | 16 578 957 000 $ US | 5 679 022 000 $ US |
| 2004 | 10 335 270 000 $ US | 11 651 658 000 $ US | 15 258 594 000 $ US | 16 944 509 000 $ US | 5 223 822 000 $ US |
| 2003 | 7 299 652 000 $ US | 9 810 976 000 $ US | 12 850 600 000 $ US | 14 282 271 000 $ US | 4 554 628 000 $ US |
| 2002 | 6 228 932 000 $ US | 9 566 790 000 $ US | 13 376 906 000 $ US | 14 300 167 000 $ US | 4 234 674 000 $ US |
| 2001 | 3 804 427 000 $ US | 9 291 935 000 $ US | 11 838 633 000 $ US | 14 211 044 000 $ US | 2 948 124 000 $ US |
En 2025, les importations de biens s'élevaient à 82,4 milliards de dollars en provenance de la Chine, 35,7 milliards de dollars en provenance de Singapour, 30,9 milliards de dollars en provenance des États-Unis, 15,6 milliards de dollars en provenance du Japon et 15,1 milliards de dollars en provenance de la Corée du Sud. Le premier rang des cinq fournisseurs de la Malaisie est occupé par la Chine depuis 2011. Le changement le plus récent dans leur ordre remonte à 2017, quand les importations de la Malaisie en provenance des États-Unis ont dépassé celles en provenance du Japon.
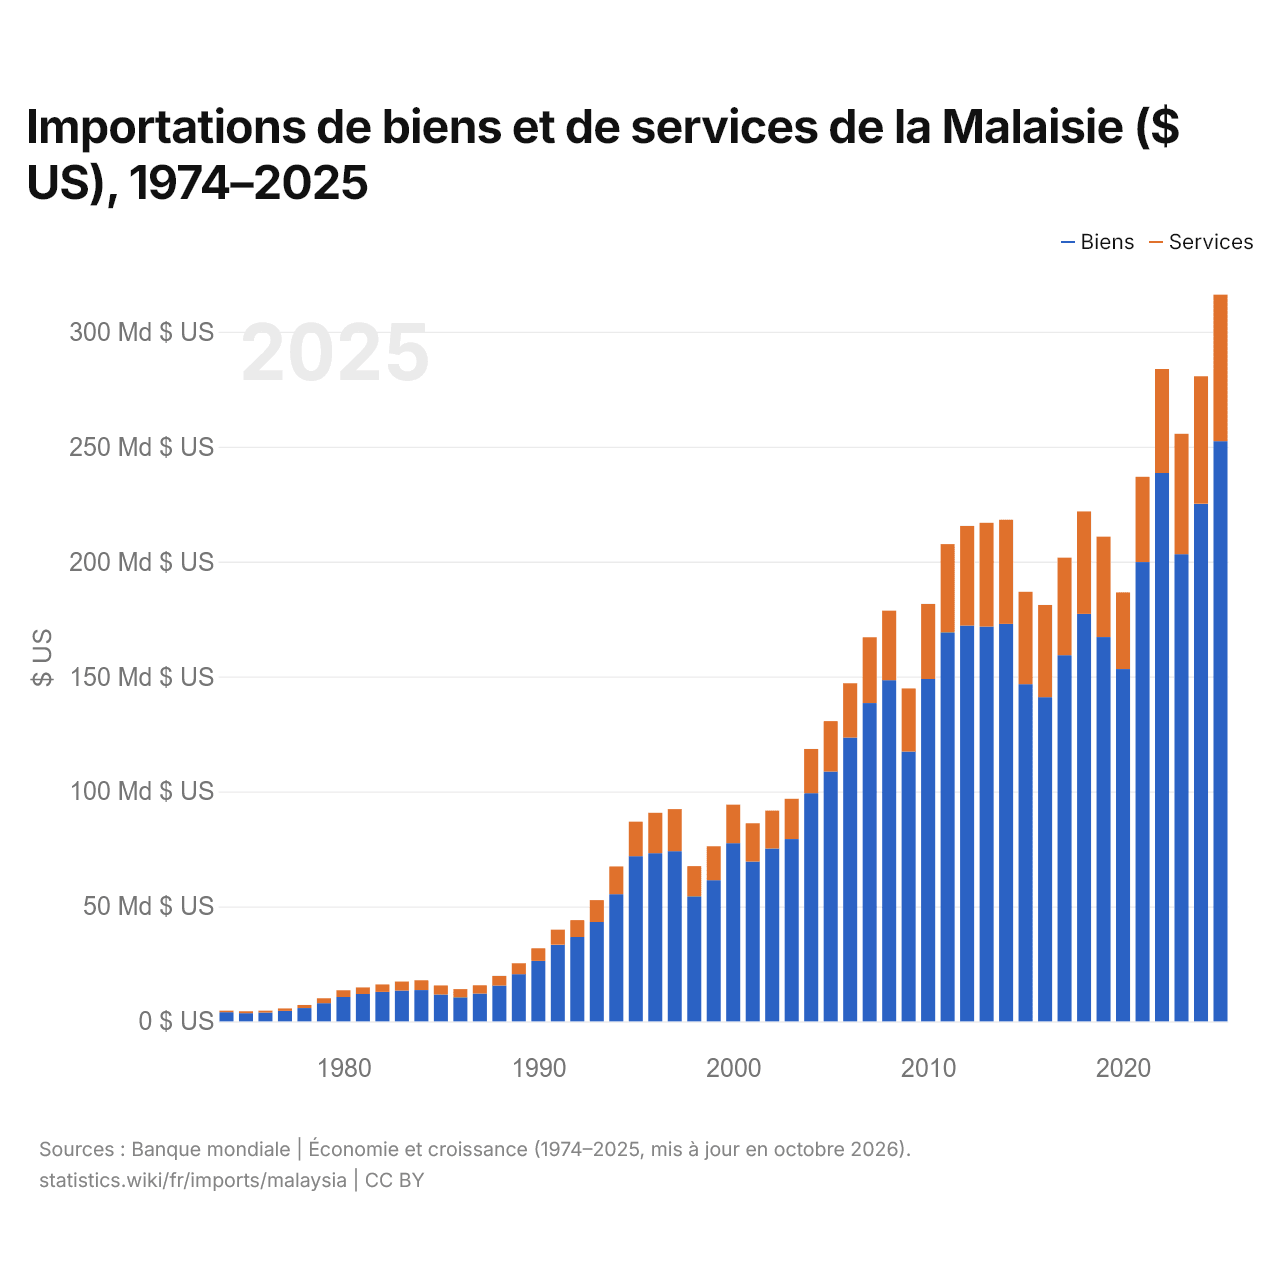
Importations de biens et de services de la Malaisie ($ US), 1974–2025
| Année | $ US | |
|---|---|---|
| Biens | Services | |
| 2025 | 252 386 190 699 $ US | 63 721 884 596 $ US |
| 2024 | 225 188 529 674 $ US | 55 436 593 477 $ US |
| 2023 | 203 226 769 495 $ US | 52 367 141 728 $ US |
| 2022 | 238 512 865 570 $ US | 45 244 981 916 $ US |
| 2021 | 199 775 860 847 $ US | 37 079 568 385 $ US |
| 2020 | 153 232 904 069 $ US | 33 380 568 102 $ US |
| 2019 | 167 149 541 157 $ US | 43 710 611 539 $ US |
| 2018 | 177 229 630 862 $ US | 44 601 873 163 $ US |
| 2017 | 159 270 121 799 $ US | 42 443 489 288 $ US |
| 2016 | 140 985 502 811 $ US | 40 144 714 580 $ US |
| 2015 | 146 687 100 439 $ US | 40 169 379 566 $ US |
| 2014 | 172 877 628 664 $ US | 45 319 650 864 $ US |
| 2013 | 171 707 920 961 $ US | 45 137 192 445 $ US |
| 2012 | 172 152 028 141 $ US | 43 348 518 287 $ US |
| 2011 | 169 225 636 072 $ US | 38 344 535 724 $ US |
| 2010 | 148 932 471 859 $ US | 32 644 635 837 $ US |
| 2009 | 117 326 991 632 $ US | 27 471 538 281 $ US |
| 2008 | 148 391 351 161 $ US | 30 269 789 906 $ US |
| 2007 | 138 432 168 744 $ US | 28 668 366 316 $ US |
| 2006 | 123 443 067 167 $ US | 23 651 024 056 $ US |
| 2005 | 108 621 428 220 $ US | 21 955 728 606 $ US |
| 2004 | 99 217 134 211 $ US | 19 268 607 895 $ US |
| 2003 | 79 281 578 947 $ US | 17 531 710 526 $ US |
| 2002 | 75 221 210 526 $ US | 16 447 842 105 $ US |
| 2001 | 69 524 736 842 $ US | 16 656 578 947 $ US |
| 2000 | 77 519 236 842 $ US | 16 747 421 053 $ US |
| 1999 | 61 404 105 263 $ US | 14 735 263 158 $ US |
| 1998 | 54 377 830 865 $ US | 13 126 676 222 $ US |
| 1997 | 74 028 727 750 $ US | 18 296 655 934 $ US |
| 1996 | 73 136 806 584 $ US | 17 572 738 646 $ US |
| 1995 | 71 870 587 981 $ US | 14 980 808 808 $ US |
| 1994 | 55 320 046 185 $ US | 12 052 174 775 $ US |
| 1993 | 43 201 202 753 $ US | 9 515 965 805 $ US |
| 1992 | 36 672 533 253 $ US | 7 335 762 842 $ US |
| 1991 | 33 321 010 400 $ US | 6 564 204 504 $ US |
| 1990 | 26 280 327 187 $ US | 5 484 541 800 $ US |
| 1989 | 20 498 429 526 $ US | 4 791 716 016 $ US |
| 1988 | 15 553 405 844 $ US | 4 205 387 998 $ US |
| 1987 | 12 093 402 294 $ US | 3 594 563 505 $ US |
| 1986 | 10 440 677 528 $ US | 3 575 134 050 $ US |
| 1985 | 11 677 210 411 $ US | 3 926 635 679 $ US |
| 1984 | 13 589 961 494 $ US | 4 254 063 300 $ US |
| 1983 | 13 366 074 318 $ US | 3 964 243 405 $ US |
| 1982 | 12 801 278 876 $ US | 3 269 258 905 $ US |
| 1981 | 11 886 073 894 $ US | 2 855 747 845 $ US |
| 1980 | 10 569 238 901 $ US | 2 956 520 409 $ US |
| 1979 | 7 913 850 421 $ US | 2 107 892 603 $ US |
| 1978 | 5 760 259 065 $ US | 1 358 783 845 $ US |
| 1977 | 4 551 690 515 $ US | 1 050 265 106 $ US |
| 1976 | 3 811 809 607 $ US | 832 161 160 $ US |
| 1975 | 3 550 864 392 $ US | 848 447 715 $ US |
| 1974 | 3 958 760 318 $ US | 698 360 384 $ US |
En 2025, les importations de biens de la Malaisie s'élevaient à 252 milliards de dollars et celles de services à 63,7 milliards de dollars ; les services représentaient 20,2 % du total, contre 15,0 % en 1974.
La Malaisie dans le classement mondial des importations, 2025
| Rang | Pays | Importations | Part mondiale | |
|---|---|---|---|---|
| 26 |
Thaïlande
|
388 Md $US | 1,15 % | vs Thaïlande |
| 27 |
 Arabie saoudite |
360 Md $US | 1,07 % | |
| 28 |
 Suède |
342 Md $US | 1,01 % | |
| 29 |
 Malaisie |
309 Md $US | 0,92 % | |
| 30 |
 Autriche |
303 Md $US | 0,9 % | |
| 31 |
Indonésie
|
297 Md $US | 0,88 % | vs Indonésie |
| 32 |
 Danemark |
273 Md $US | 0,81 % |
Importations de biens et services de la Malaisie, % du PIB, 1960–2025
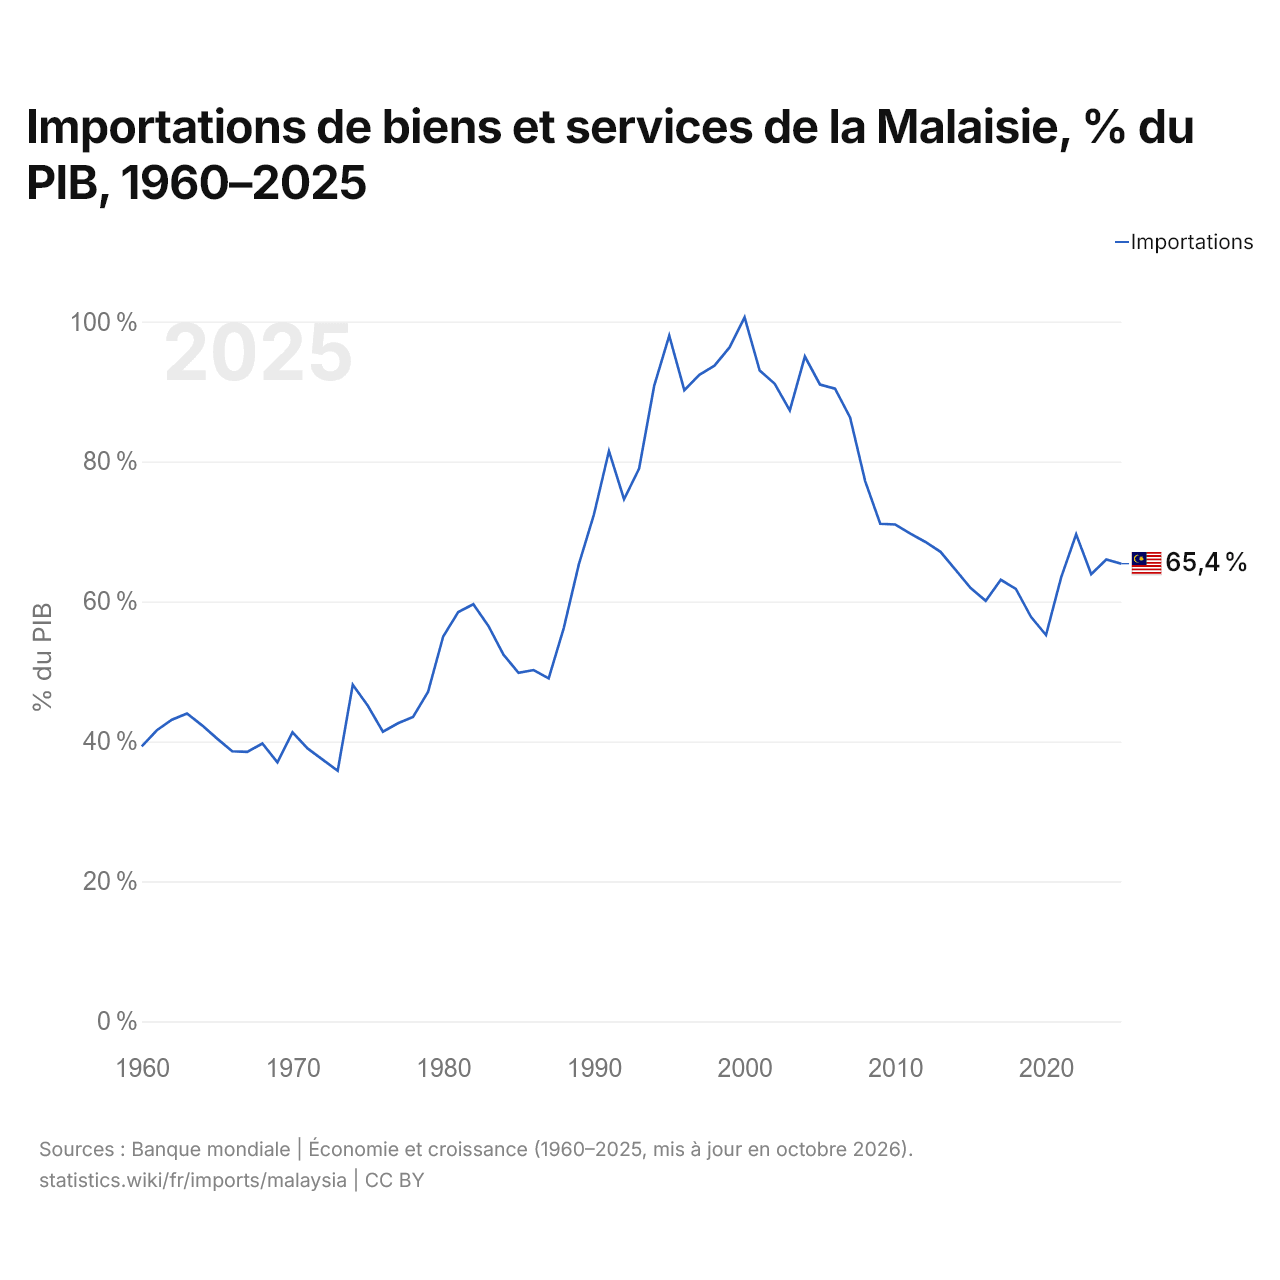
En 2025, les importations de biens et services de la Malaisie équivalaient à 65,4 % de son PIB, contre 39,3 % en 1960. La part la plus élevée a été de 100,6 %, en 2000.
Comparer les importations de la Malaisie avec celles d'autres pays
Sources :
- TradeMap (2001–2025, mis à jour en octobre 2026)
- Banque mondiale | Économie et croissance (1960–2025, mis à jour en octobre 2026)
Creative Commons Attribution (CC BY) : vous pouvez copier, partager, adapter et réutiliser ce contenu, y compris à des fins commerciales, à condition de citer statistics.wiki et d’indiquer les modifications apportées. Les sources citées ci-dessus peuvent avoir leurs propres conditions de licence.