
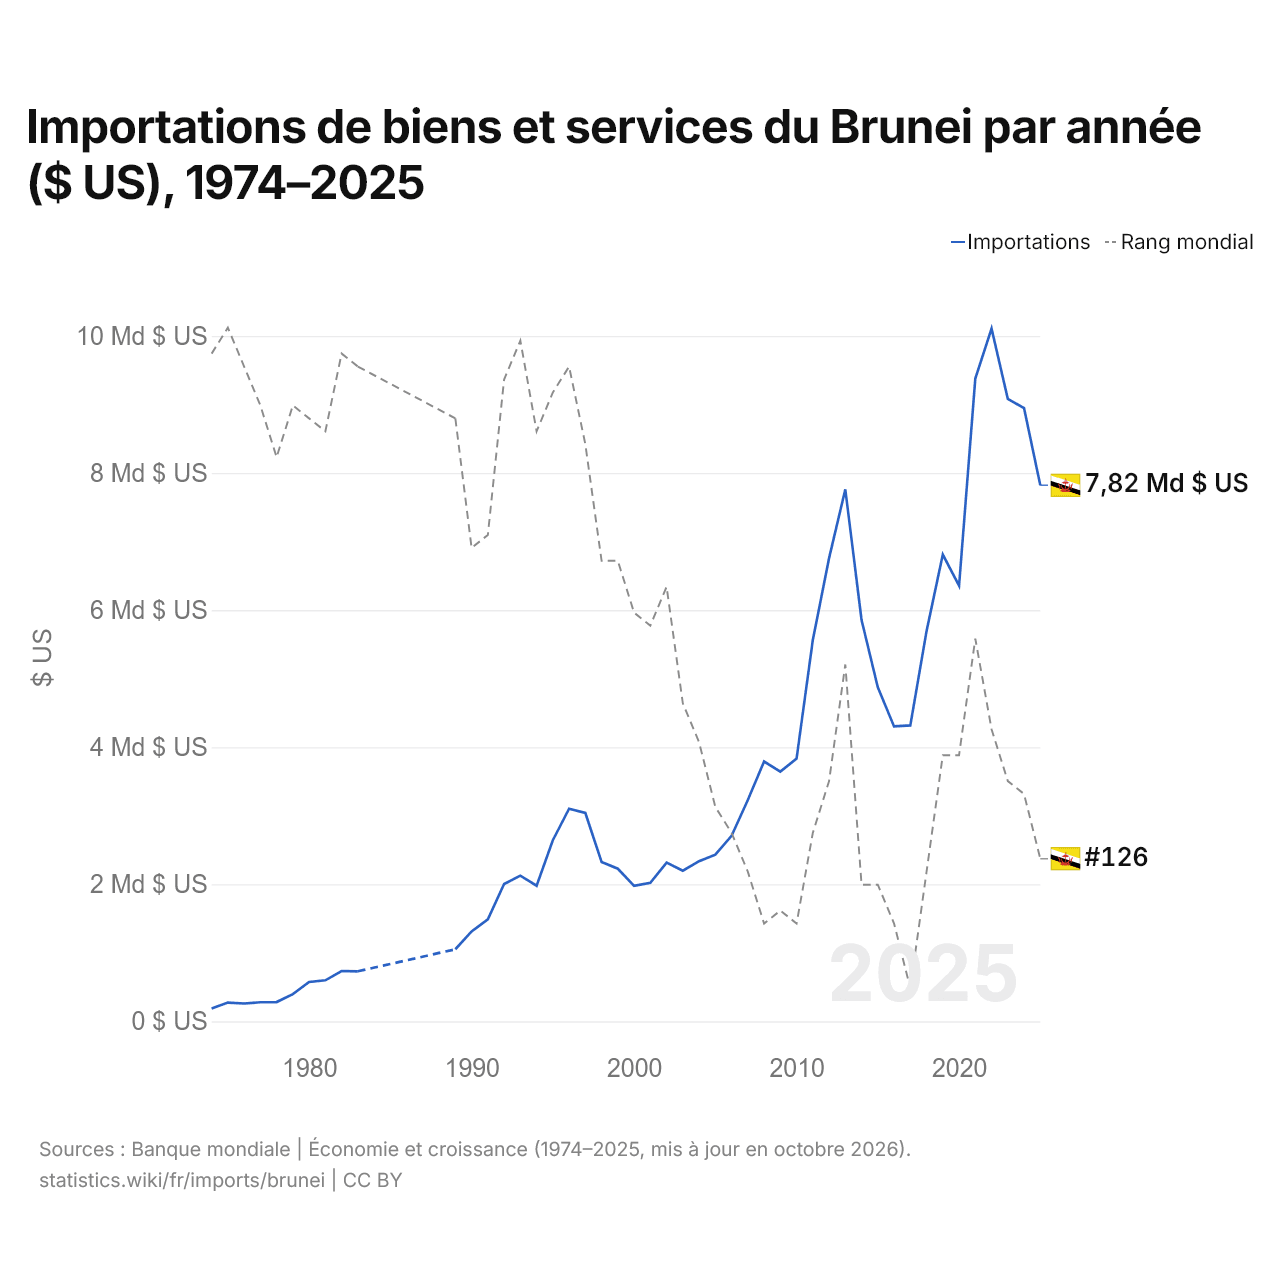
Importations de biens et services du Brunei par année ($ US), 1974–2025
| Année | $ US | Rang mondial |
|---|---|---|
| Importations | Rang mondial | |
| 2025 | 7 822 316 770 $ US | #126 |
| 2024 | 8 946 252 974 $ US | #121 |
| 2023 | 9 081 237 975 $ US | #120 |
| 2022 | 10 106 443 643 $ US | #116 |
| 2021 | 9 377 937 978 $ US | #109 |
| 2020 | 6 355 257 110 $ US | #118 |
| 2019 | 6 810 532 693 $ US | #118 |
| 2018 | 5 693 328 955 $ US | #127 |
| 2017 | 4 318 058 848 $ US | #136 |
| 2016 | 4 302 691 141 $ US | #131 |
| 2015 | 4 872 546 659 $ US | #128 |
| 2014 | 5 854 952 488 $ US | #128 |
| 2013 | 7 761 572 006 $ US | #111 |
| 2012 | 6 758 610 783 $ US | #120 |
| 2011 | 5 563 288 956 $ US | #124 |
| 2010 | 3 832 962 525 $ US | #131 |
| 2009 | 3 643 381 167 $ US | #130 |
| 2008 | 3 790 860 498 $ US | #131 |
| 2007 | 3 230 040 502 $ US | #127 |
| 2006 | 2 707 260 784 $ US | #124 |
| 2005 | 2 430 951 690 $ US | #122 |
| 2004 | 2 337 174 926 $ US | #117 |
| 2003 | 2 197 963 417 $ US | #114 |
| 2002 | 2 315 388 241 $ US | #105 |
| 2001 | 2 022 108 049 $ US | #108 |
| 2000 | 1 976 887 497 $ US | #107 |
| 1999 | 2 226 605 159 $ US | #103 |
| 1998 | 2 325 523 034 $ US | #103 |
| 1997 | 3 040 127 801 $ US | #94 |
| 1996 | 3 102 037 458 $ US | #88 |
| 1995 | 2 642 913 837 $ US | #90 |
| 1994 | 1 978 468 605 $ US | #93 |
| 1993 | 2 125 274 865 $ US | #86 |
| 1992 | 2 004 337 718 $ US | #89 |
| 1991 | 1 487 077 074 $ US | #101 |
| 1990 | 1 311 976 113 $ US | #102 |
| 1989 | 1 051 142 977 $ US | #92 |
| 1988 | - | - |
| 1987 | - | - |
| 1986 | - | - |
| 1985 | - | - |
| 1984 | - | - |
| 1983 | 729 750 834 $ US | #88 |
| 1982 | 734 570 858 $ US | #87 |
| 1981 | 598 762 148 $ US | #93 |
| 1980 | 574 909 117 $ US | #92 |
| 1979 | 396 402 395 $ US | #91 |
| 1978 | 280 999 549 $ US | #95 |
| 1977 | 278 757 071 $ US | #91 |
| 1976 | 259 830 455 $ US | #88 |
| 1975 | 273 689 537 $ US | #85 |
| 1974 | 186 304 792 $ US | #87 |
En 2025, les importations de biens et services du Brunei s'élevaient à 7,82 milliards de dollars, contre 186 millions de dollars en 1974. Le maximum a été de 10,1 milliards de dollars, en 2022. Elles se classaient au 126e rang mondial, en baisse par rapport au 121e rang en 2024. Leur meilleur rang a été le 85e, occupé pour la dernière fois en 1975.
En 2025, les importations de biens et services du Brunei étaient les 39es plus élevées de 44 pays situés en Asie. En 2025, les exportations du Brunei dépassaient ses importations de 2,94 milliards de dollars, soit un excédent commercial. Le commerce du Brunei, exportations et importations réunies, équivalait à 123,6 % de son PIB en 2025, au 38e rang mondial.
Importations de biens du Brunei par catégorie, 2025
Importations de biens, 2025: 6,60 Md $US
En 2025, la première catégorie des importations de biens du Brunei était « pétrole, gaz, minerais et autres matières premières », avec 66,5 %, suivie de « machines, électronique et véhicules », avec 12,9 %.
Origines des importations de biens du Brunei : les 10 premières, 2025
| Rang | Pays | Importations de biens | Part | |
|---|---|---|---|---|
| 1 |
 Malaisie |
2,31 Md $US | 35 % | |
| 2 |
 Russie |
532 M $US | 8,06 % | |
| 3 |
 Australie |
476 M $US | 7,21 % | |
| 4 |
 EAU |
467 M $US | 7,07 % | |
| 5 |
 Chine |
462 M $US | 7 % | |
| 6 |
 Singapour |
338 M $US | 5,12 % | vs Singapour |
| 7 |
 États-Unis |
192 M $US | 2,91 % | |
| 8 |
 Indonésie |
184 M $US | 2,79 % | |
| 9 |
 Vietnam |
162 M $US | 2,46 % | |
| 10 |
 Nigeria |
157 M $US | 2,37 % | |
| Autres partenaires et non précisés | 1,32 Md $US | 20 % |
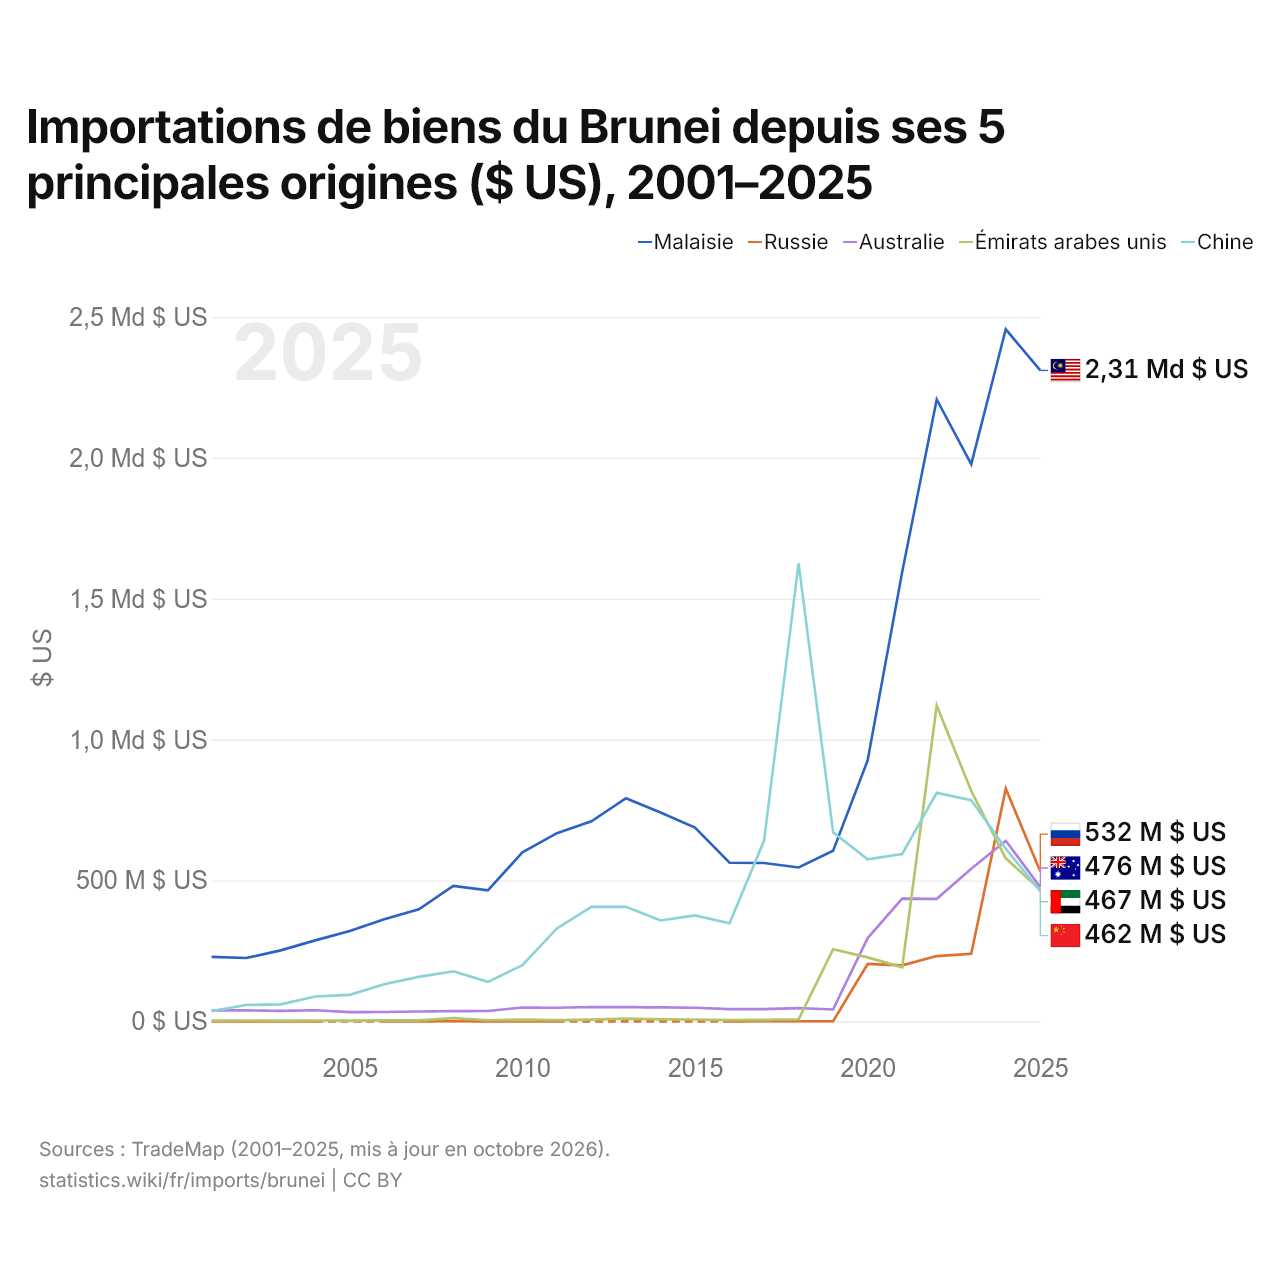
Importations de biens du Brunei depuis ses 5 principales origines ($ US), 2001–2025
| Année | $ US | ||||
|---|---|---|---|---|---|
| Malaisie | Russie | Australie | Émirats arabes unis | Chine | |
| 2025 | 2 309 884 000 $ US | 531 997 000 $ US | 476 048 000 $ US | 466 770 000 $ US | 462 019 000 $ US |
| 2024 | 2 456 013 000 $ US | 825 833 000 $ US | 640 812 000 $ US | 578 396 000 $ US | 612 699 000 $ US |
| 2023 | 1 977 277 000 $ US | 239 984 000 $ US | 541 630 000 $ US | 817 253 000 $ US | 784 412 000 $ US |
| 2022 | 2 207 034 000 $ US | 231 592 000 $ US | 434 567 000 $ US | 1 120 580 000 $ US | 810 946 000 $ US |
| 2021 | 1 595 001 000 $ US | 198 452 000 $ US | 435 582 000 $ US | 192 073 000 $ US | 594 030 000 $ US |
| 2020 | 926 136 000 $ US | 203 749 000 $ US | 295 569 000 $ US | 226 843 000 $ US | 574 904 000 $ US |
| 2019 | 605 177 000 $ US | 631 000 $ US | 42 117 000 $ US | 256 069 000 $ US | 670 827 000 $ US |
| 2018 | 545 971 000 $ US | 217 000 $ US | 46 941 000 $ US | 6 720 000 $ US | 1 625 057 000 $ US |
| 2017 | 561 967 000 $ US | 334 000 $ US | 43 556 000 $ US | 5 331 000 $ US | 641 325 000 $ US |
| 2016 | 562 760 000 $ US | 44 000 $ US | 43 277 000 $ US | 4 517 000 $ US | 348 335 000 $ US |
| 2015 | 687 846 000 $ US | - | 48 197 000 $ US | 6 508 000 $ US | 376 191 000 $ US |
| 2014 | 741 054 000 $ US | - | 49 367 000 $ US | 6 837 000 $ US | 357 884 000 $ US |
| 2013 | 792 044 000 $ US | - | 50 363 000 $ US | 9 646 000 $ US | 406 299 000 $ US |
| 2012 | 709 924 000 $ US | - | 50 873 000 $ US | 6 296 000 $ US | 406 678 000 $ US |
| 2011 | 667 818 000 $ US | 13 000 $ US | 48 149 000 $ US | 4 141 000 $ US | 329 692 000 $ US |
| 2010 | 599 493 000 $ US | 121 000 $ US | 49 083 000 $ US | 5 938 000 $ US | 199 141 000 $ US |
| 2009 | 464 499 000 $ US | 30 000 $ US | 36 525 000 $ US | 3 976 000 $ US | 140 051 000 $ US |
| 2008 | 480 341 000 $ US | 244 000 $ US | 35 969 000 $ US | 11 418 000 $ US | 177 757 000 $ US |
| 2007 | 397 289 000 $ US | 42 000 $ US | 34 798 000 $ US | 3 635 000 $ US | 157 824 000 $ US |
| 2006 | 362 478 000 $ US | 27 000 $ US | 33 074 000 $ US | 3 284 000 $ US | 131 717 000 $ US |
| 2005 | 320 494 000 $ US | - | 32 875 000 $ US | 2 354 000 $ US | 93 901 000 $ US |
| 2004 | 287 349 000 $ US | 43 000 $ US | 39 436 000 $ US | 3 081 000 $ US | 88 292 000 $ US |
| 2003 | 251 714 000 $ US | 2 000 $ US | 36 966 000 $ US | 2 734 000 $ US | 60 444 000 $ US |
| 2002 | 224 640 000 $ US | 73 000 $ US | 39 015 000 $ US | 2 907 000 $ US | 57 871 000 $ US |
| 2001 | 228 880 000 $ US | 2 000 $ US | 38 787 000 $ US | 2 698 000 $ US | 36 294 000 $ US |
En 2025, les importations de biens s'élevaient à 2,31 milliards de dollars en provenance de la Malaisie, 532 millions de dollars en provenance de la Russie, 476 millions de dollars en provenance de l'Australie, 467 millions de dollars en provenance des Émirats arabes unis et 462 millions de dollars en provenance de la Chine. Le premier rang des cinq fournisseurs du Brunei est occupé par la Malaisie depuis 2020. Le changement le plus récent dans leur ordre remonte à 2025, quand les importations du Brunei en provenance des Émirats arabes unis ont dépassé celles en provenance de la Chine.
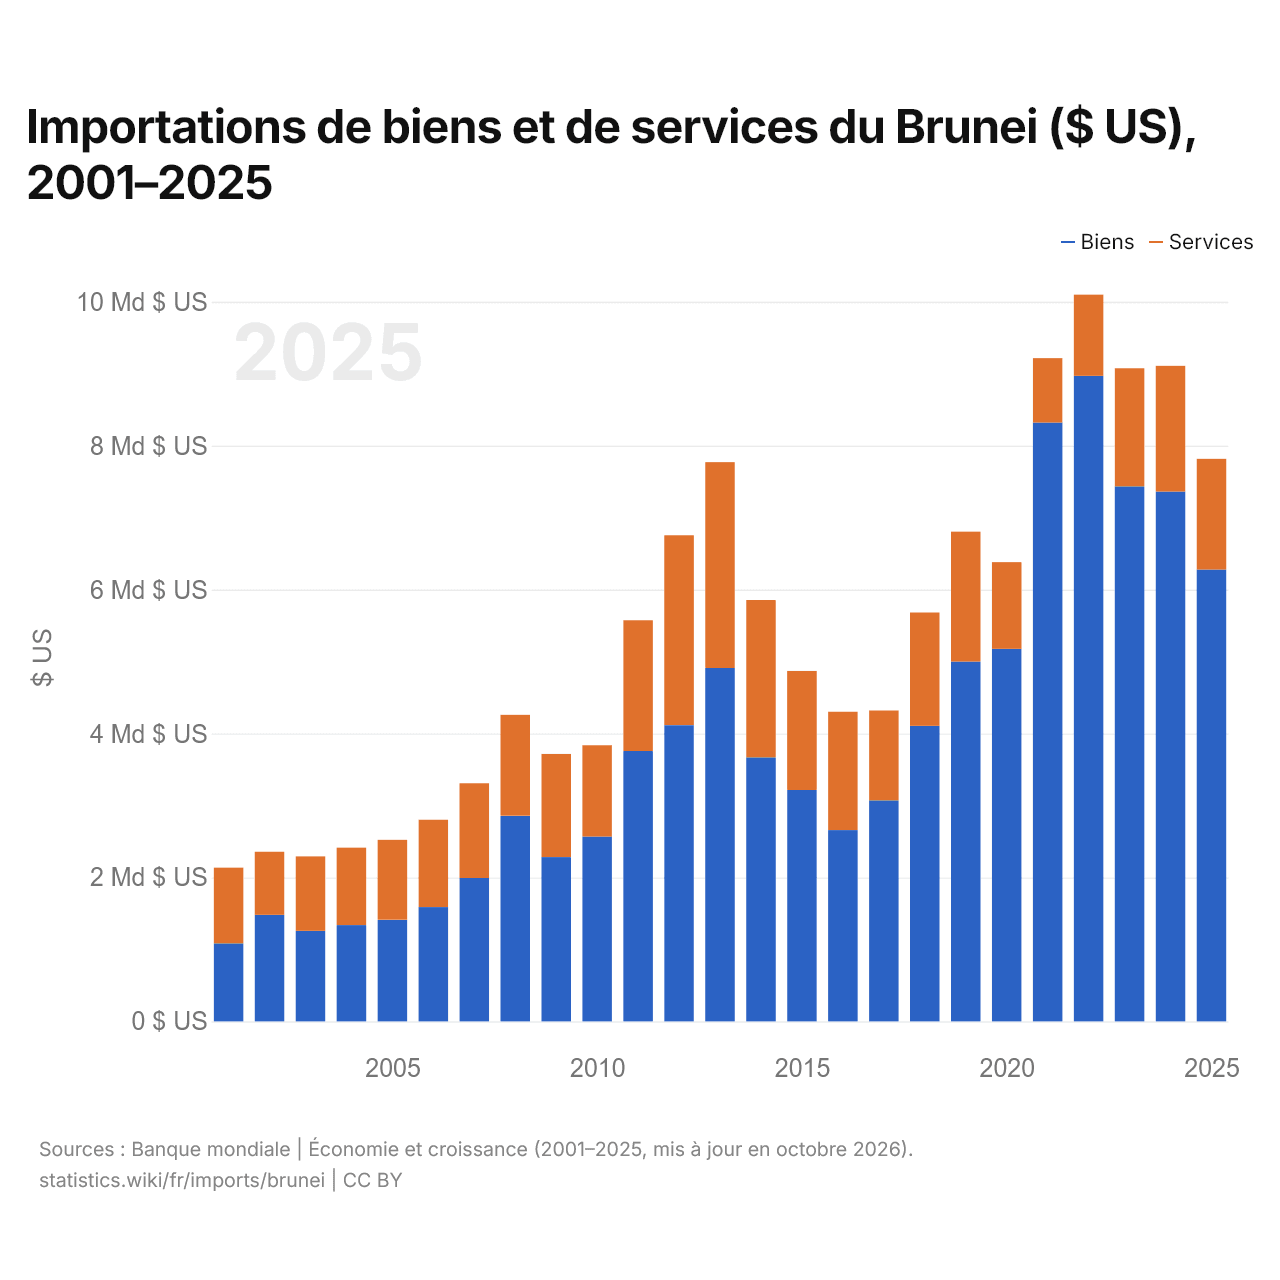
Importations de biens et de services du Brunei ($ US), 2001–2025
| Année | $ US | |
|---|---|---|
| Biens | Services | |
| 2025 | 6 278 658 580 $ US | 1 539 263 231 $ US |
| 2024 | 7 364 290 807 $ US | 1 746 204 731 $ US |
| 2023 | 7 435 235 839 $ US | 1 641 757 817 $ US |
| 2022 | 8 971 190 606 $ US | 1 128 137 718 $ US |
| 2021 | 8 321 686 455 $ US | 895 486 830 $ US |
| 2020 | 5 175 992 497 $ US | 1 206 228 993 $ US |
| 2019 | 4 999 476 103 $ US | 1 806 316 939 $ US |
| 2018 | 4 106 071 118 $ US | 1 575 625 756 $ US |
| 2017 | 3 071 512 368 $ US | 1 248 997 651 $ US |
| 2016 | 2 658 454 285 $ US | 1 644 488 334 $ US |
| 2015 | 3 215 783 470 $ US | 1 654 012 200 $ US |
| 2014 | 3 667 930 427 $ US | 2 186 833 136 $ US |
| 2013 | 4 911 721 891 $ US | 2 859 224 099 $ US |
| 2012 | 4 116 175 062 $ US | 2 639 349 620 $ US |
| 2011 | 3 756 641 414 $ US | 1 818 050 562 $ US |
| 2010 | 2 568 019 073 $ US | 1 269 213 960 $ US |
| 2009 | 2 282 430 795 $ US | 1 434 187 541 $ US |
| 2008 | 2 857 682 730 $ US | 1 402 500 474 $ US |
| 2007 | 1 991 788 915 $ US | 1 316 836 165 $ US |
| 2006 | 1 588 325 382 $ US | 1 213 557 773 $ US |
| 2005 | 1 411 802 452 $ US | 1 110 128 041 $ US |
| 2004 | 1 337 576 084 $ US | 1 075 709 467 $ US |
| 2003 | 1 257 961 931 $ US | 1 033 761 551 $ US |
| 2002 | 1 480 390 568 $ US | 876 181 696 $ US |
| 2001 | 1 082 795 670 $ US | 1 053 875 852 $ US |
En 2025, les importations de biens du Brunei s'élevaient à 6,28 milliards de dollars et celles de services à 1,54 milliard de dollars ; les services représentaient 19,7 % du total, contre 49,3 % en 2001.
Le Brunei dans le classement mondial des importations, 2025
| Rang | Pays | Importations | Part mondiale | |
|---|---|---|---|---|
| 123 |
 Burkina Faso |
8,29 Md $US | 0,02 % | |
| 124 |
 Cuba |
8,07 Md $US (2020) | 0,04 % | |
| 125 |
 Mali |
8,03 Md $US | 0,02 % | |
| 126 |
 Brunei |
7,82 Md $US | 0,02 % | |
| 127 |
 Botswana |
7,48 Md $US | 0,02 % | |
| 128 |
 Congo-Brazza |
7,12 Md $US | 0,02 % | |
| 129 |
 Zambie |
6,97 Md $US (2024) | 0,02 % |
Importations de biens et services du Brunei, % du PIB, 1974–2025
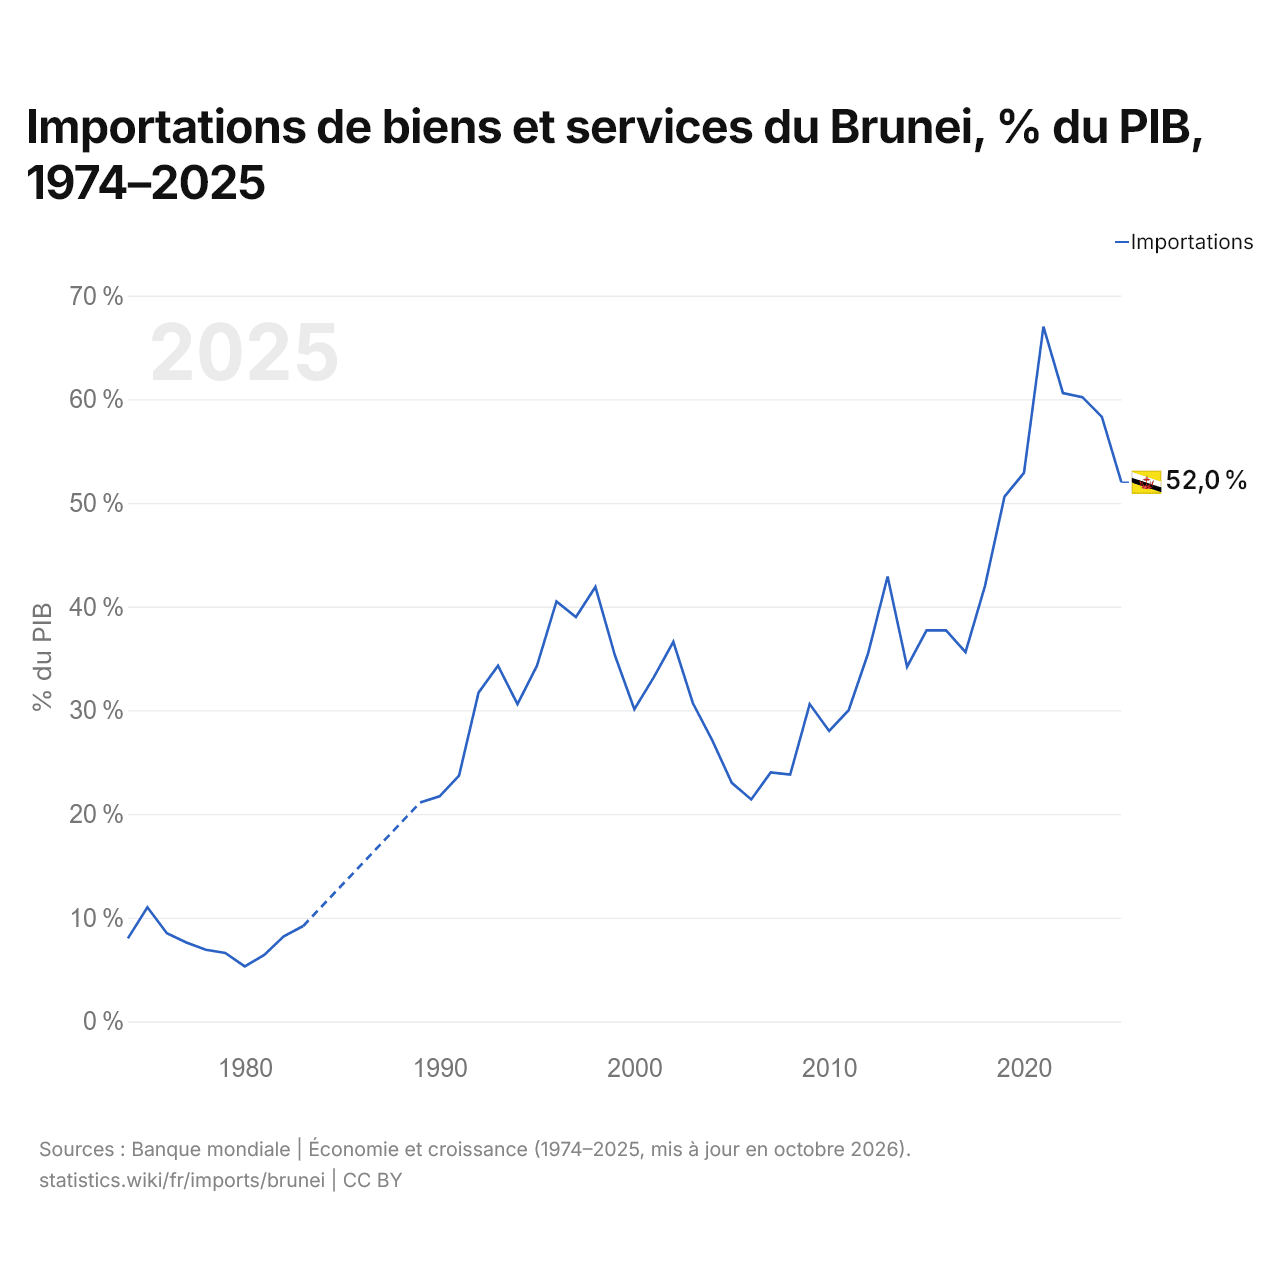
En 2025, les importations de biens et services du Brunei équivalaient à 52,0 % de son PIB, contre 8,0 % en 1974. La part la plus élevée a été de 67,0 %, en 2021.
Comparer les importations du Brunei avec celles d'autres pays
Sources :
- TradeMap (2001–2025, mis à jour en octobre 2026)
- Banque mondiale | Économie et croissance (1974–2025, mis à jour en octobre 2026)
Creative Commons Attribution (CC BY) : vous pouvez copier, partager, adapter et réutiliser ce contenu, y compris à des fins commerciales, à condition de citer statistics.wiki et d’indiquer les modifications apportées. Les sources citées ci-dessus peuvent avoir leurs propres conditions de licence.