
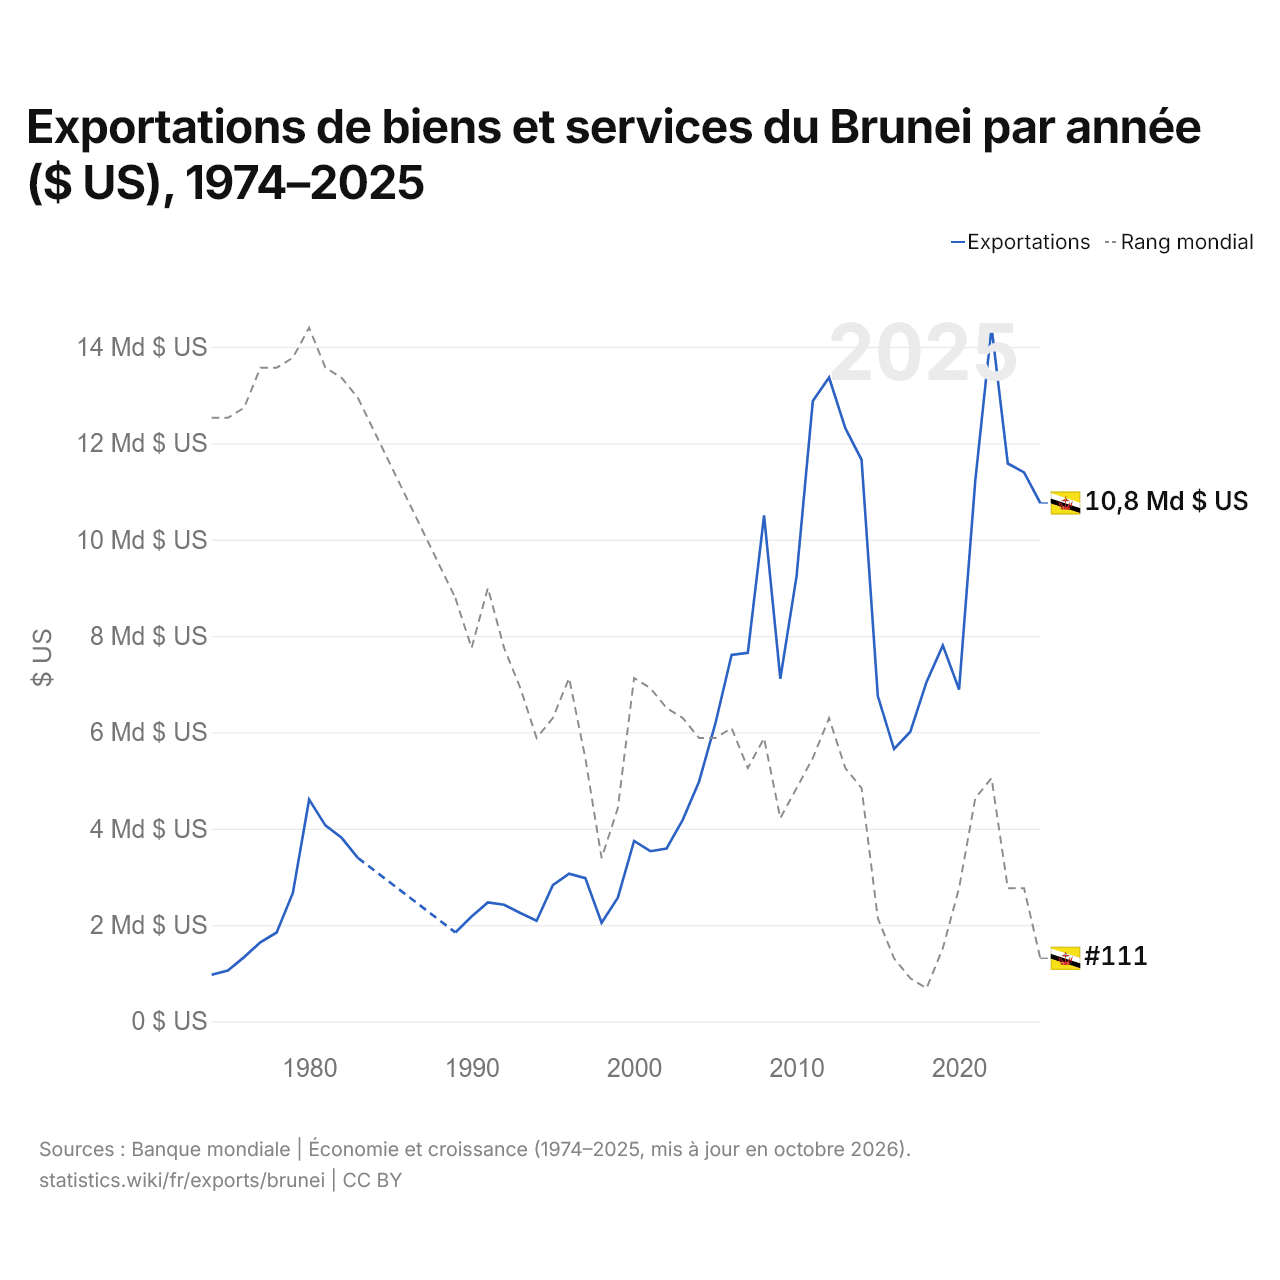
Exportations de biens et services du Brunei par année ($ US), 1974–2025
| Année | $ US | Rang mondial |
|---|---|---|
| Exportations | Rang mondial | |
| 2025 | 10 758 583 397 $ US | #111 |
| 2024 | 11 393 732 340 $ US | #104 |
| 2023 | 11 578 413 348 $ US | #104 |
| 2022 | 14 411 072 072 $ US | #93 |
| 2021 | 11 228 855 781 $ US | #95 |
| 2020 | 6 886 059 826 $ US | #104 |
| 2019 | 7 804 888 585 $ US | #110 |
| 2018 | 7 045 735 066 $ US | #114 |
| 2017 | 6 012 333 921 $ US | #113 |
| 2016 | 5 651 998 520 $ US | #111 |
| 2015 | 6 751 297 357 $ US | #107 |
| 2014 | 11 656 782 738 $ US | #94 |
| 2013 | 12 312 003 443 $ US | #92 |
| 2012 | 13 364 336 606 $ US | #87 |
| 2011 | 12 875 904 772 $ US | #91 |
| 2010 | 9 239 730 724 $ US | #94 |
| 2009 | 7 112 433 442 $ US | #97 |
| 2008 | 10 502 405 645 $ US | #89 |
| 2007 | 7 651 436 598 $ US | #92 |
| 2006 | 7 607 073 552 $ US | #88 |
| 2005 | 6 177 687 114 $ US | #89 |
| 2004 | 4 978 970 766 $ US | #89 |
| 2003 | 4 187 448 793 $ US | #87 |
| 2002 | 3 588 069 785 $ US | #86 |
| 2001 | 3 531 476 908 $ US | #84 |
| 2000 | 3 743 517 639 $ US | #83 |
| 1999 | 2 567 616 760 $ US | #96 |
| 1998 | 2 044 691 629 $ US | #101 |
| 1997 | 2 972 105 447 $ US | #91 |
| 1996 | 3 065 868 297 $ US | #83 |
| 1995 | 2 827 057 060 $ US | #87 |
| 1994 | 2 087 801 582 $ US | #89 |
| 1993 | 2 248 434 358 $ US | #84 |
| 1992 | 2 421 166 297 $ US | #80 |
| 1991 | 2 468 235 362 $ US | #74 |
| 1990 | 2 175 960 383 $ US | #80 |
| 1989 | 1 845 396 865 $ US | #75 |
| 1988 | - | - |
| 1987 | - | - |
| 1986 | - | - |
| 1985 | - | - |
| 1984 | - | - |
| 1983 | 3 393 672 653 $ US | #55 |
| 1982 | 3 809 768 577 $ US | #53 |
| 1981 | 4 066 849 309 $ US | #52 |
| 1980 | 4 601 608 064 $ US | #48 |
| 1979 | 2 665 369 238 $ US | #51 |
| 1978 | 1 844 746 650 $ US | #52 |
| 1977 | 1 639 747 479 $ US | #52 |
| 1976 | 1 332 744 061 $ US | #56 |
| 1975 | 1 052 165 479 $ US | #57 |
| 1974 | 966 815 177 $ US | #57 |
En 2025, les exportations de biens et services du Brunei s'élevaient à 10,8 milliards de dollars, contre 967 millions de dollars en 1974. Le maximum a été de 14,4 milliards de dollars, en 2022. Elles se classaient au 111e rang mondial, en baisse par rapport au 104e rang en 2024. Leur meilleur rang a été le 48e, occupé pour la dernière fois en 1980.
En 2025, les exportations de biens et services du Brunei étaient les 33es plus élevées de 44 pays situés en Asie. Les importations de biens et services du Brunei s'élevaient à 7,82 milliards de dollars en 2025, au 126e rang mondial. En 2025, les exportations du Brunei dépassaient ses importations de 2,94 milliards de dollars, soit un excédent commercial.
Exportations de biens du Brunei par catégorie, 2025
Exportations de biens, 2025: 10,3 Md $US
En 2025, la première catégorie des exportations de biens du Brunei était « pétrole, gaz, minerais et autres matières premières », avec 79,3 %, suivie de « produits chimiques, pharmaceutiques et plastiques », avec 17,8 %.
Destinations des exportations de biens du Brunei : les 10 premières, 2025
| Rang | Pays | Exportations de biens | Part | |
|---|---|---|---|---|
| 1 |
 Australie |
2,41 Md $US | 23,4 % | |
| 2 |
 Chine |
1,91 Md $US | 18,6 % | |
| 3 |
 Japon |
1,30 Md $US | 12,6 % | |
| 4 |
 Singapour |
1,10 Md $US | 10,7 % | vs Singapour |
| 5 |
 Thaïlande |
653 M $US | 6,35 % | |
| 6 |
 Malaisie |
519 M $US | 5,04 % | |
| 7 |
 Corée du Sud |
475 M $US | 4,61 % | |
| 8 |
 Vietnam |
470 M $US | 4,56 % | |
| 9 |
 Philippines |
380 M $US | 3,7 % | |
| 10 |
 Inde |
192 M $US | 1,86 % | |
| Autres partenaires et non précisés | 886 M $US | 8,61 % |
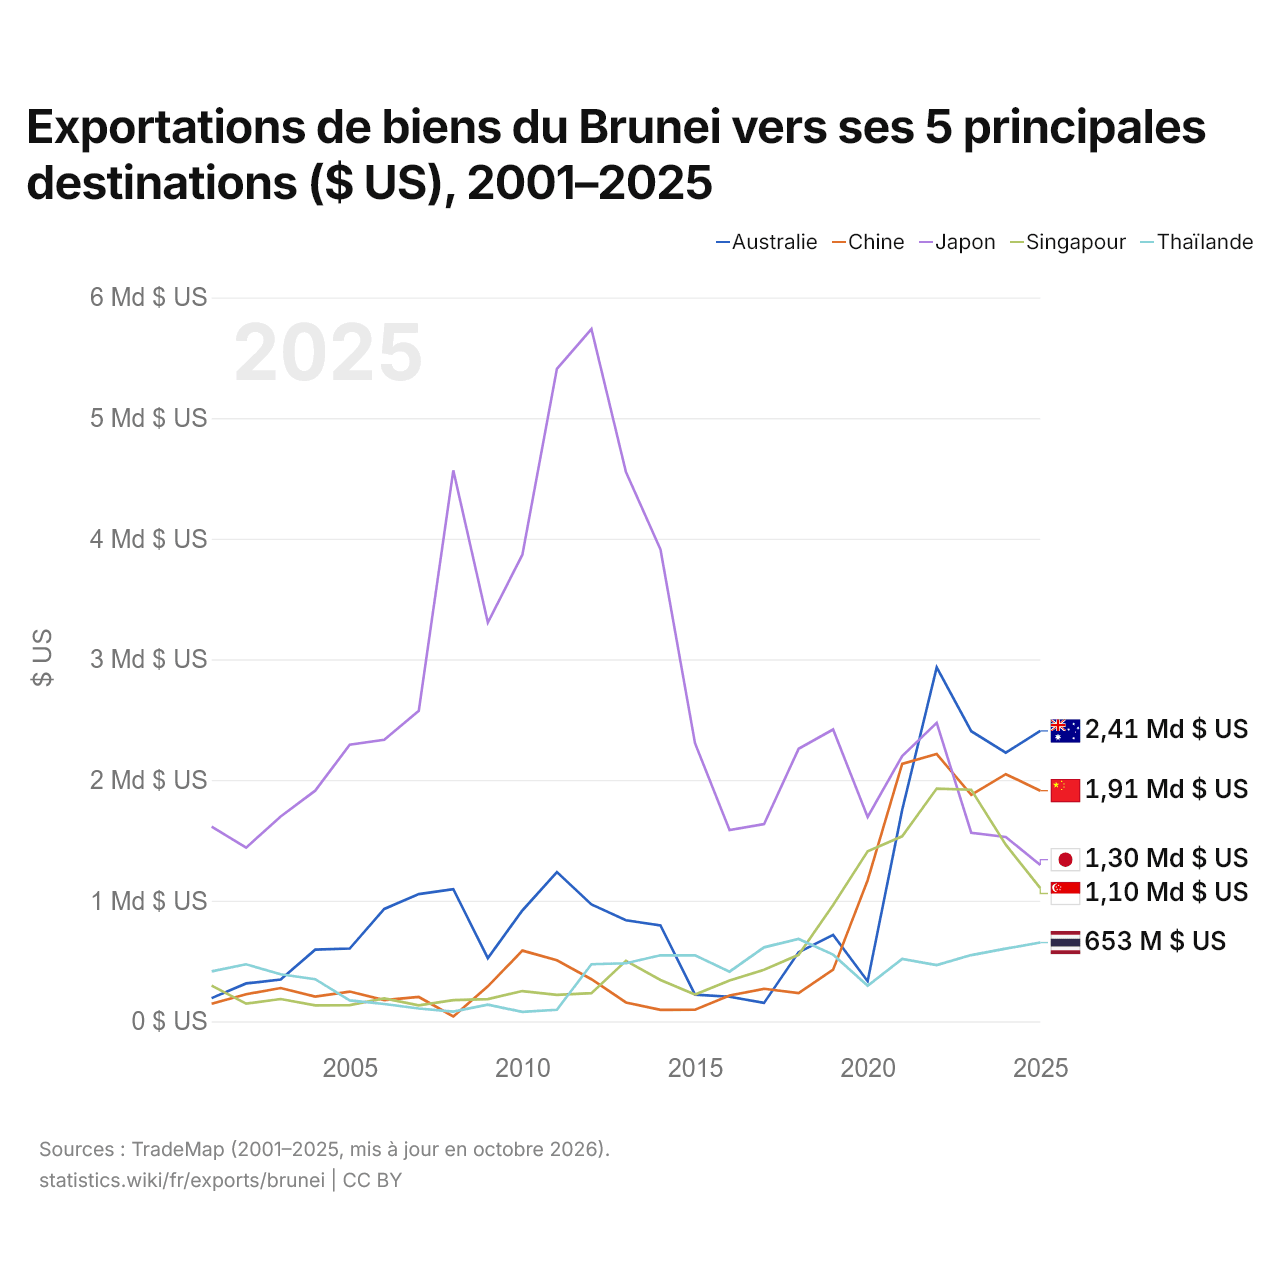
Exportations de biens du Brunei vers ses 5 principales destinations ($ US), 2001–2025
| Année | $ US | ||||
|---|---|---|---|---|---|
| Australie | Chine | Japon | Singapour | Thaïlande | |
| 2025 | 2 406 935 000 $ US | 1 911 530 000 $ US | 1 296 258 000 $ US | 1 103 501 000 $ US | 653 247 000 $ US |
| 2024 | 2 226 358 000 $ US | 2 048 373 000 $ US | 1 528 532 000 $ US | 1 463 898 000 $ US | 602 297 000 $ US |
| 2023 | 2 404 615 000 $ US | 1 876 996 000 $ US | 1 563 084 000 $ US | 1 919 067 000 $ US | 549 200 000 $ US |
| 2022 | 2 933 777 000 $ US | 2 215 272 000 $ US | 2 473 700 000 $ US | 1 929 401 000 $ US | 466 150 000 $ US |
| 2021 | 1 752 400 000 $ US | 2 134 024 000 $ US | 2 199 227 000 $ US | 1 533 123 000 $ US | 517 987 000 $ US |
| 2020 | 332 390 000 $ US | 1 169 912 000 $ US | 1 693 151 000 $ US | 1 409 499 000 $ US | 293 968 000 $ US |
| 2019 | 716 189 000 $ US | 428 506 000 $ US | 2 419 029 000 $ US | 964 450 000 $ US | 552 667 000 $ US |
| 2018 | 572 366 000 $ US | 234 798 000 $ US | 2 258 648 000 $ US | 551 118 000 $ US | 682 612 000 $ US |
| 2017 | 152 735 000 $ US | 269 873 000 $ US | 1 634 906 000 $ US | 426 740 000 $ US | 613 233 000 $ US |
| 2016 | 204 120 000 $ US | 213 973 000 $ US | 1 584 799 000 $ US | 339 059 000 $ US | 411 960 000 $ US |
| 2015 | 221 471 000 $ US | 96 302 000 $ US | 2 305 049 000 $ US | 221 788 000 $ US | 546 717 000 $ US |
| 2014 | 795 494 000 $ US | 95 383 000 $ US | 3 910 752 000 $ US | 342 558 000 $ US | 547 589 000 $ US |
| 2013 | 837 518 000 $ US | 156 246 000 $ US | 4 553 393 000 $ US | 501 121 000 $ US | 481 223 000 $ US |
| 2012 | 968 685 000 $ US | 348 949 000 $ US | 5 737 859 000 $ US | 233 200 000 $ US | 473 029 000 $ US |
| 2011 | 1 237 174 000 $ US | 505 573 000 $ US | 5 408 517 000 $ US | 218 890 000 $ US | 96 210 000 $ US |
| 2010 | 918 801 000 $ US | 586 177 000 $ US | 3 867 431 000 $ US | 250 891 000 $ US | 78 037 000 $ US |
| 2009 | 523 619 000 $ US | 289 730 000 $ US | 3 305 359 000 $ US | 184 101 000 $ US | 137 735 000 $ US |
| 2008 | 1 095 764 000 $ US | 39 916 000 $ US | 4 566 559 000 $ US | 175 881 000 $ US | 81 144 000 $ US |
| 2007 | 1 054 539 000 $ US | 202 030 000 $ US | 2 573 632 000 $ US | 132 952 000 $ US | 106 362 000 $ US |
| 2006 | 931 600 000 $ US | 176 538 000 $ US | 2 333 917 000 $ US | 190 694 000 $ US | 143 813 000 $ US |
| 2005 | 603 311 000 $ US | 246 765 000 $ US | 2 292 501 000 $ US | 134 709 000 $ US | 173 743 000 $ US |
| 2004 | 594 159 000 $ US | 205 350 000 $ US | 1 911 674 000 $ US | 132 512 000 $ US | 349 157 000 $ US |
| 2003 | 346 357 000 $ US | 276 257 000 $ US | 1 697 612 000 $ US | 185 191 000 $ US | 390 658 000 $ US |
| 2002 | 314 210 000 $ US | 224 647 000 $ US | 1 439 500 000 $ US | 146 744 000 $ US | 472 850 000 $ US |
| 2001 | 192 367 000 $ US | 145 134 000 $ US | 1 613 200 000 $ US | 295 578 000 $ US | 414 511 000 $ US |
En 2025, les exportations de biens s'élevaient à 2,41 milliards de dollars vers l'Australie, 1,91 milliard de dollars vers la Chine, 1,3 milliard de dollars vers le Japon, 1,1 milliard de dollars vers Singapour et 653 millions de dollars vers la Thaïlande. Le premier rang des cinq destinations du Brunei est occupé par l'Australie depuis 2022. Le changement le plus récent dans leur ordre remonte à 2024, quand les exportations du Brunei vers le Japon ont dépassé celles vers Singapour.
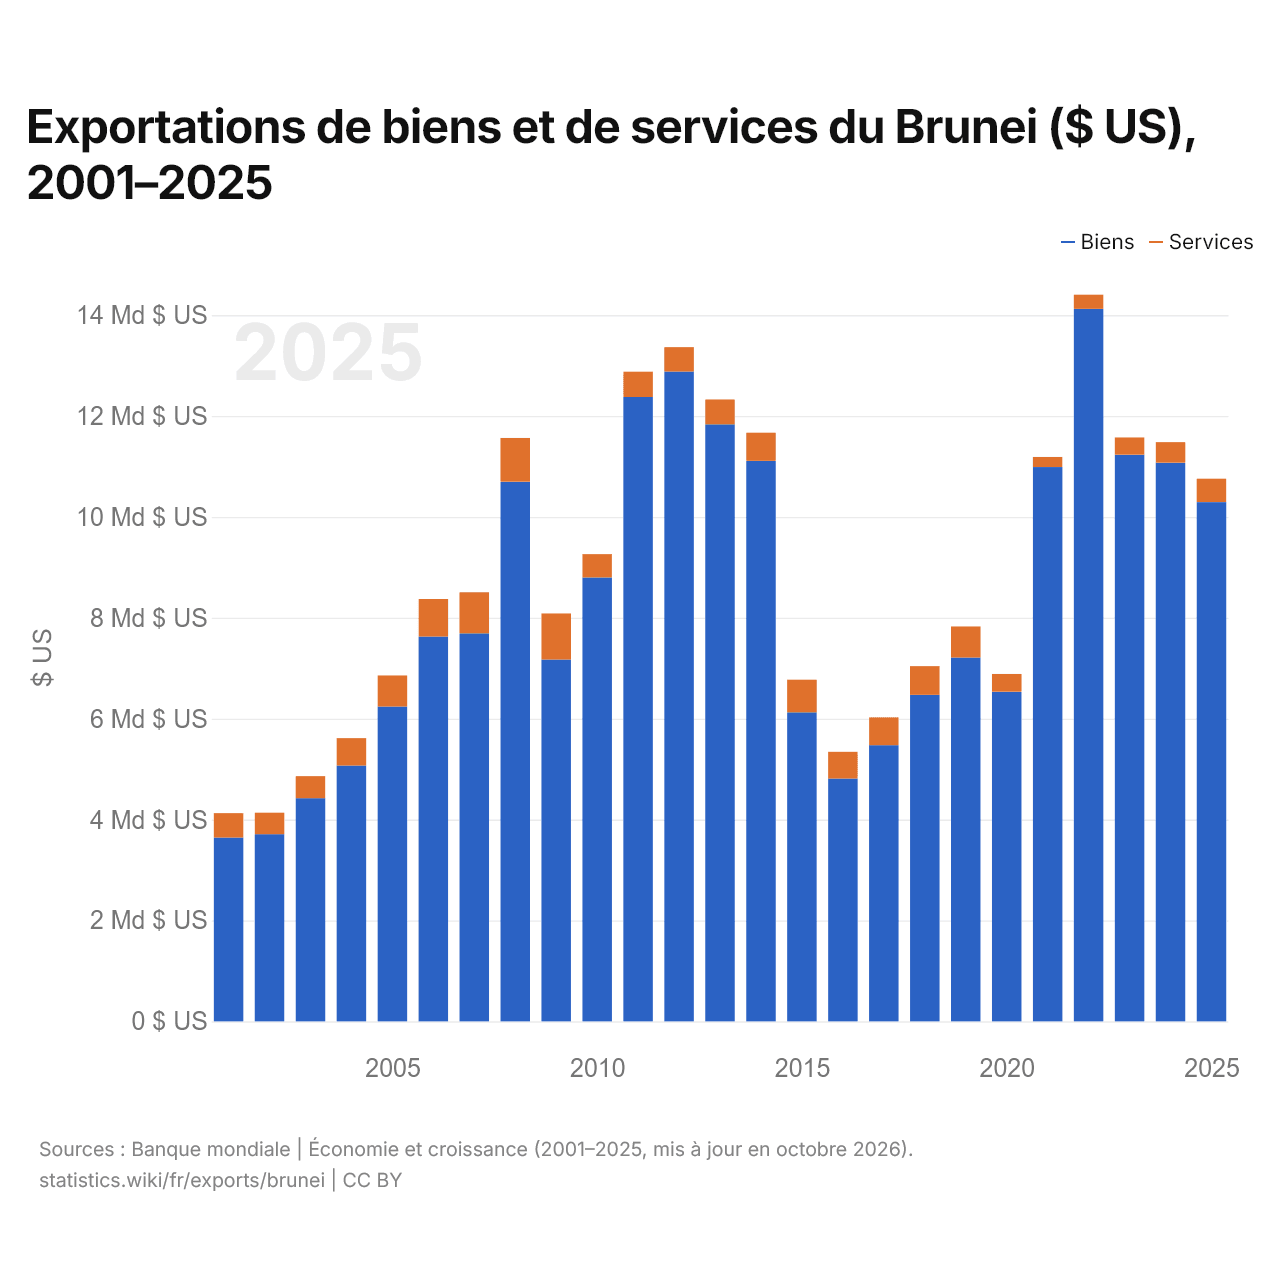
Exportations de biens et de services du Brunei ($ US), 2001–2025
| Année | $ US | |
|---|---|---|
| Biens | Services | |
| 2025 | 10 292 856 127 $ US | 463 217 798 $ US |
| 2024 | 11 073 238 079 $ US | 409 655 983 $ US |
| 2023 | 11 233 014 445 $ US | 339 973 005 $ US |
| 2022 | 14 124 044 438 $ US | 281 080 636 $ US |
| 2021 | 10 988 074 079 $ US | 200 316 989 $ US |
| 2020 | 6 535 165 749 $ US | 351 043 083 $ US |
| 2019 | 7 209 991 572 $ US | 617 709 365 $ US |
| 2018 | 6 470 749 447 $ US | 570 189 091 $ US |
| 2017 | 5 474 293 015 $ US | 551 451 275 $ US |
| 2016 | 4 811 718 565 $ US | 530 322 831 $ US |
| 2015 | 6 125 471 665 $ US | 647 721 573 $ US |
| 2014 | 11 111 405 941 $ US | 556 811 340 $ US |
| 2013 | 11 835 474 929 $ US | 492 589 893 $ US |
| 2012 | 12 881 822 980 $ US | 482 855 898 $ US |
| 2011 | 12 376 247 123 $ US | 501 693 119 $ US |
| 2010 | 8 799 576 438 $ US | 462 074 227 $ US |
| 2009 | 7 171 881 681 $ US | 914 911 082 $ US |
| 2008 | 10 697 696 963 $ US | 867 252 989 $ US |
| 2007 | 7 691 599 164 $ US | 813 339 673 $ US |
| 2006 | 7 626 932 018 $ US | 744 542 033 $ US |
| 2005 | 6 240 958 255 $ US | 616 113 166 $ US |
| 2004 | 5 068 835 389 $ US | 544 237 617 $ US |
| 2003 | 4 423 954 153 $ US | 436 353 739 $ US |
| 2002 | 3 708 861 472 $ US | 426 717 971 $ US |
| 2001 | 3 643 592 053 $ US | 482 139 256 $ US |
En 2025, les exportations de biens du Brunei s'élevaient à 10,3 milliards de dollars et celles de services à 463 millions de dollars ; les services représentaient 4,3 % du total, contre 11,7 % en 2001.
Le Brunei dans le classement mondial des exportations, 2025
| Rang | Pays | Exportations | Part mondiale | |
|---|---|---|---|---|
| 108 |
 Guinée |
11,7 Md $US | 0,03 % | |
| 109 |
 Macédoine du Nord |
11,4 Md $US | 0,03 % | |
| 110 |
 Albanie |
11,3 Md $US | 0,03 % | |
| 111 |
 Brunei |
10,8 Md $US | 0,03 % | |
| 112 |
 Maurice |
10,5 Md $US | 0,03 % | |
| 113 |
 Burkina Faso |
9,67 Md $US | 0,03 % | |
| 114 |
 Nicaragua |
9,25 Md $US | 0,03 % |
Exportations de biens et services du Brunei, % du PIB, 1974–2025
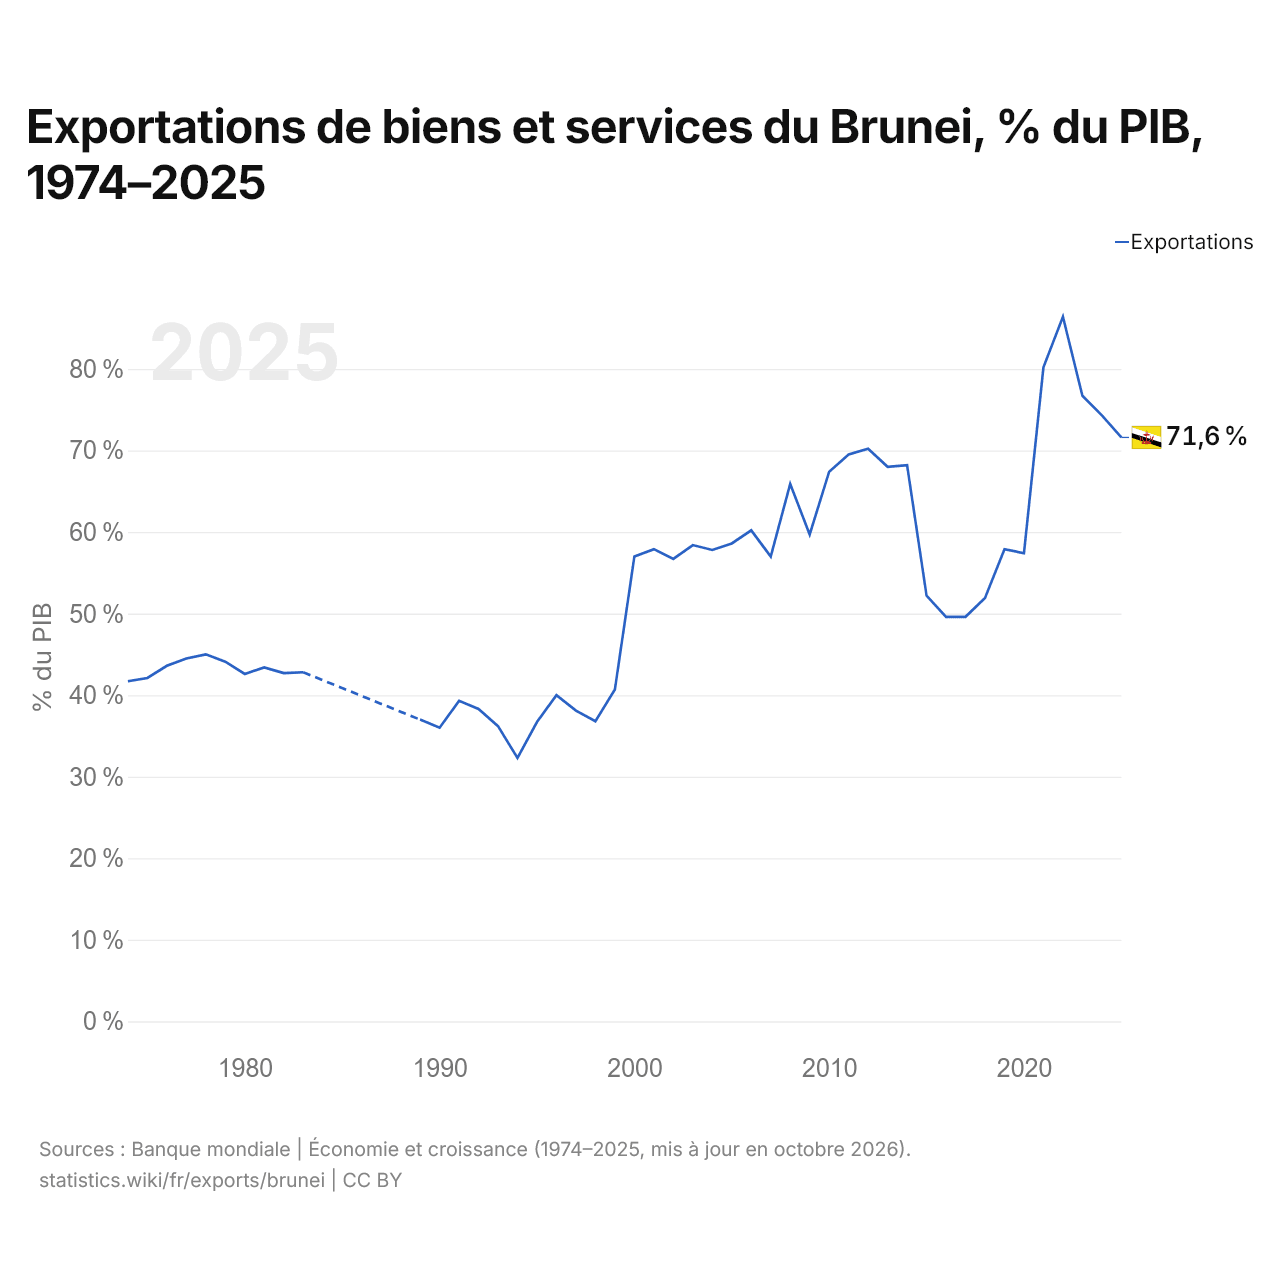
En 2025, les exportations de biens et services du Brunei équivalaient à 71,6 % de son PIB, contre 41,7 % en 1974. La part la plus élevée a été de 86,4 %, en 2022.
Comparer les exportations du Brunei avec celles d'autres pays
Sources :
- Banque mondiale | Économie et croissance (1974–2025, mis à jour en octobre 2026)
- TradeMap (2001–2025, mis à jour en octobre 2026)
Creative Commons Attribution (CC BY) : vous pouvez copier, partager, adapter et réutiliser ce contenu, y compris à des fins commerciales, à condition de citer statistics.wiki et d’indiquer les modifications apportées. Les sources citées ci-dessus peuvent avoir leurs propres conditions de licence.