
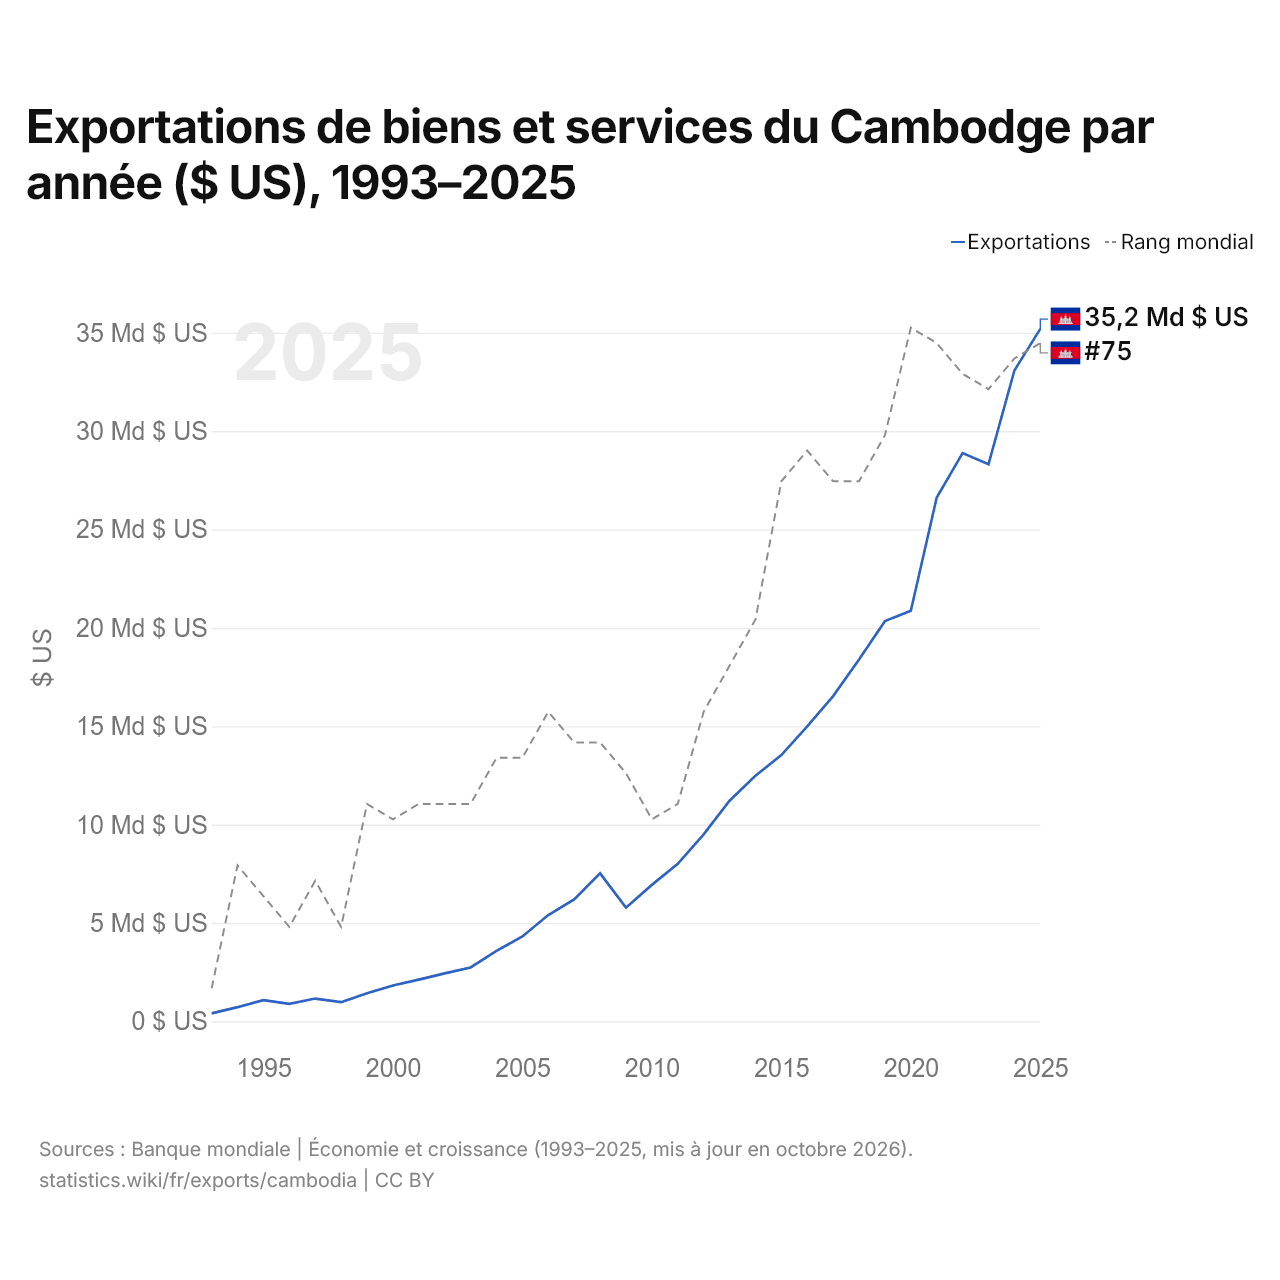
Exportations de biens et services du Cambodge par année ($ US), 1993–2025
| Année | $ US | Rang mondial |
|---|---|---|
| Exportations | Rang mondial | |
| 2025 | 35 193 057 307 $ US | #75 |
| 2024 | 33 078 910 281 $ US | #76 |
| 2023 | 28 319 442 900 $ US | #78 |
| 2022 | 28 878 876 682 $ US | #77 |
| 2021 | 26 621 743 091 $ US | #75 |
| 2020 | 20 863 615 890 $ US | #74 |
| 2019 | 20 340 881 133 $ US | #81 |
| 2018 | 18 386 489 552 $ US | #84 |
| 2017 | 16 527 255 663 $ US | #84 |
| 2016 | 14 986 346 465 $ US | #82 |
| 2015 | 13 532 995 573 $ US | #84 |
| 2014 | 12 481 981 424 $ US | #93 |
| 2013 | 11 214 912 044 $ US | #96 |
| 2012 | 9 498 870 542 $ US | #99 |
| 2011 | 8 003 673 661 $ US | #105 |
| 2010 | 6 935 619 207 $ US | #106 |
| 2009 | 5 777 715 035 $ US | #103 |
| 2008 | 7 521 137 176 $ US | #101 |
| 2007 | 6 191 862 457 $ US | #101 |
| 2006 | 5 400 482 920 $ US | #99 |
| 2005 | 4 313 261 451 $ US | #102 |
| 2004 | 3 578 124 692 $ US | #102 |
| 2003 | 2 736 752 435 $ US | #105 |
| 2002 | 2 439 168 009 $ US | #105 |
| 2001 | 2 121 742 524 $ US | #105 |
| 2000 | 1 821 406 331 $ US | #106 |
| 1999 | 1 426 037 338 $ US | #105 |
| 1998 | 974 763 068 $ US | #113 |
| 1997 | 1 157 570 060 $ US | #110 |
| 1996 | 889 438 539 $ US | #113 |
| 1995 | 1 073 111 830 $ US | #111 |
| 1994 | 719 965 852 $ US | #109 |
| 1993 | 406 842 505 $ US | #117 |
En 2025, les exportations de biens et services du Cambodge s'élevaient à 35,2 milliards de dollars, contre 407 millions de dollars en 1993. Elles se classaient au 75e rang mondial, en hausse par rapport au 76e rang en 2024. Leur meilleur rang a été le 74e, occupé pour la dernière fois en 2020.
En 2025, les exportations de biens et services du Cambodge étaient les 25es plus élevées de 44 pays situés en Asie. Les importations de biens et services du Cambodge s'élevaient à 34,6 milliards de dollars en 2025, au 76e rang mondial. En 2025, les exportations du Cambodge dépassaient ses importations de 617 millions de dollars, soit un excédent commercial.
Exportations de biens du Cambodge par catégorie, 2025
Exportations de biens, 2025: 31,3 Md $US
En 2025, la première catégorie des exportations de biens du Cambodge était « textiles, vêtements, chaussures, meubles et jouets », avec 60,2 %, suivie de « cultures, plantes et fleurs (céréales, fruits, légumes, café, oléagineux) », avec 11,1 %.
Destinations des exportations de biens du Cambodge : les 10 premières, 2025
| Rang | Pays | Exportations de biens | Part | |
|---|---|---|---|---|
| 1 |
 États-Unis |
12,7 Md $US | 40,7 % | |
| 2 |
 Vietnam |
3,73 Md $US | 11,9 % | vs Vietnam |
| 3 |
 Chine |
1,69 Md $US | 5,39 % | |
| 4 |
 Japon |
1,58 Md $US | 5,04 % | vs Japon |
| 5 |
 Canada |
1,27 Md $US | 4,06 % | |
| 6 |
 Espagne |
1,16 Md $US | 3,71 % | |
| 7 |
 Royaume-Uni |
1,02 Md $US | 3,25 % | |
| 8 |
 Pays-Bas |
967 M $US | 3,09 % | |
| 9 |
 Singapour |
920 M $US | 2,94 % | |
| 10 |
 Allemagne |
903 M $US | 2,89 % | |
| Autres partenaires et non précisés | 5,32 Md $US | 17 % |
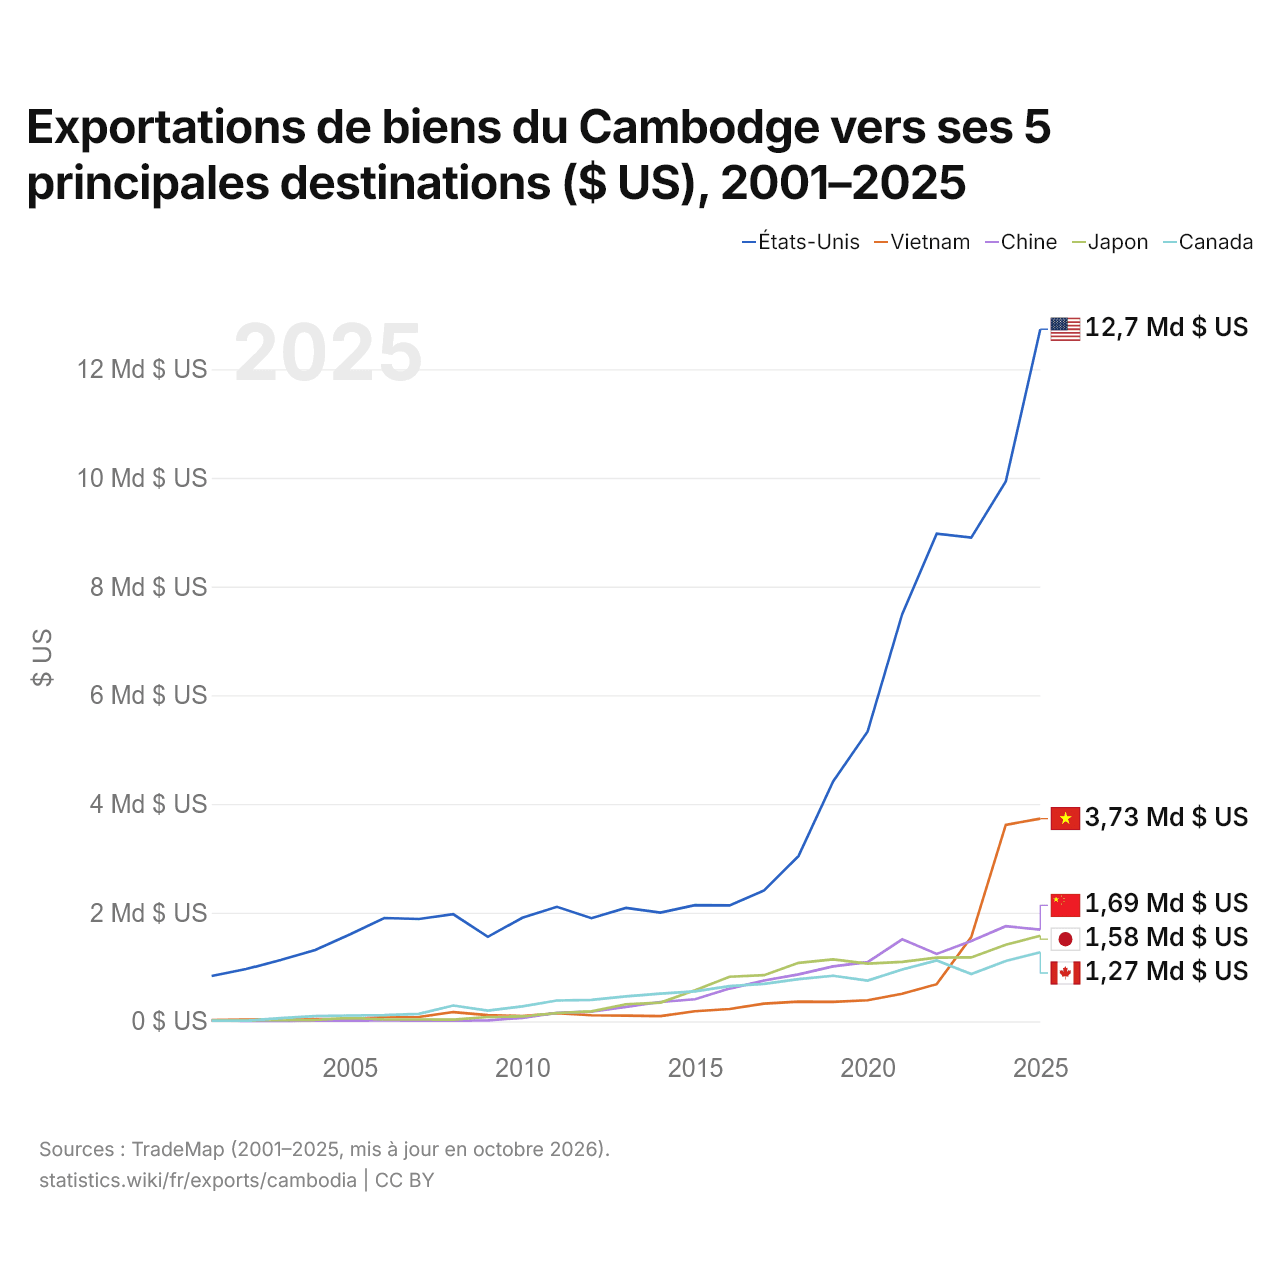
Exportations de biens du Cambodge vers ses 5 principales destinations ($ US), 2001–2025
| Année | $ US | ||||
|---|---|---|---|---|---|
| États-Unis | Vietnam | Chine | Japon | Canada | |
| 2025 | 12 734 272 000 $ US | 3 729 400 000 $ US | 1 686 589 000 $ US | 1 576 107 000 $ US | 1 271 528 000 $ US |
| 2024 | 9 932 159 000 $ US | 3 615 550 000 $ US | 1 750 115 000 $ US | 1 408 680 000 $ US | 1 109 868 000 $ US |
| 2023 | 8 900 109 000 $ US | 1 549 923 000 $ US | 1 478 739 000 $ US | 1 175 776 000 $ US | 869 538 000 $ US |
| 2022 | 8 971 372 000 $ US | 683 626 000 $ US | 1 240 630 000 $ US | 1 173 030 000 $ US | 1 120 592 000 $ US |
| 2021 | 7 490 970 000 $ US | 507 651 000 $ US | 1 510 253 000 $ US | 1 093 628 000 $ US | 954 828 000 $ US |
| 2020 | 5 333 170 000 $ US | 387 436 000 $ US | 1 089 124 000 $ US | 1 062 352 000 $ US | 750 666 000 $ US |
| 2019 | 4 414 284 000 $ US | 359 196 000 $ US | 1 012 148 000 $ US | 1 140 013 000 $ US | 839 309 000 $ US |
| 2018 | 3 044 576 000 $ US | 361 704 000 $ US | 863 317 000 $ US | 1 076 032 000 $ US | 776 812 000 $ US |
| 2017 | 2 407 917 000 $ US | 325 782 000 $ US | 750 430 000 $ US | 849 951 000 $ US | 688 824 000 $ US |
| 2016 | 2 133 414 000 $ US | 226 367 000 $ US | 602 563 000 $ US | 820 892 000 $ US | 648 878 000 $ US |
| 2015 | 2 136 784 000 $ US | 185 645 000 $ US | 405 515 000 $ US | 571 552 000 $ US | 551 035 000 $ US |
| 2014 | 2 000 174 000 $ US | 96 801 000 $ US | 356 595 000 $ US | 344 883 000 $ US | 508 972 000 $ US |
| 2013 | 2 087 970 000 $ US | 103 745 000 $ US | 266 696 000 $ US | 314 063 000 $ US | 459 528 000 $ US |
| 2012 | 1 897 688 000 $ US | 111 657 000 $ US | 178 029 000 $ US | 184 209 000 $ US | 394 707 000 $ US |
| 2011 | 2 107 192 000 $ US | 148 825 000 $ US | 154 598 000 $ US | 153 379 000 $ US | 382 564 000 $ US |
| 2010 | 1 905 612 000 $ US | 96 146 000 $ US | 65 008 000 $ US | 89 557 000 $ US | 274 421 000 $ US |
| 2009 | 1 555 059 000 $ US | 115 447 000 $ US | 16 383 000 $ US | 79 855 000 $ US | 196 158 000 $ US |
| 2008 | 1 970 288 000 $ US | 170 790 000 $ US | 12 930 000 $ US | 32 138 000 $ US | 291 455 000 $ US |
| 2007 | 1 883 474 000 $ US | 79 426 000 $ US | 10 158 000 $ US | 33 653 000 $ US | 138 313 000 $ US |
| 2006 | 1 901 504 000 $ US | 75 138 000 $ US | 15 522 000 $ US | 34 118 000 $ US | 115 315 000 $ US |
| 2005 | 1 597 763 000 $ US | 46 115 000 $ US | 14 259 000 $ US | 62 918 000 $ US | 107 167 000 $ US |
| 2004 | 1 311 580 000 $ US | 42 409 000 $ US | 12 625 000 $ US | 25 070 000 $ US | 94 461 000 $ US |
| 2003 | 1 128 563 000 $ US | 39 355 000 $ US | 6 544 000 $ US | 21 690 000 $ US | 60 009 000 $ US |
| 2002 | 961 813 000 $ US | 32 452 000 $ US | 8 338 000 $ US | 18 893 000 $ US | 10 240 000 $ US |
| 2001 | 833 853 000 $ US | 21 173 000 $ US | 16 754 000 $ US | 13 328 000 $ US | 10 415 000 $ US |
En 2025, les exportations de biens s'élevaient à 12,7 milliards de dollars vers les États-Unis, 3,73 milliards de dollars vers le Vietnam, 1,69 milliard de dollars vers la Chine, 1,58 milliard de dollars vers le Japon et 1,27 milliard de dollars vers le Canada. Le premier rang des cinq destinations du Cambodge est occupé par les États-Unis chaque année depuis 2001. Le changement le plus récent dans leur ordre remonte à 2023, quand les exportations du Cambodge vers le Vietnam ont dépassé celles vers la Chine.
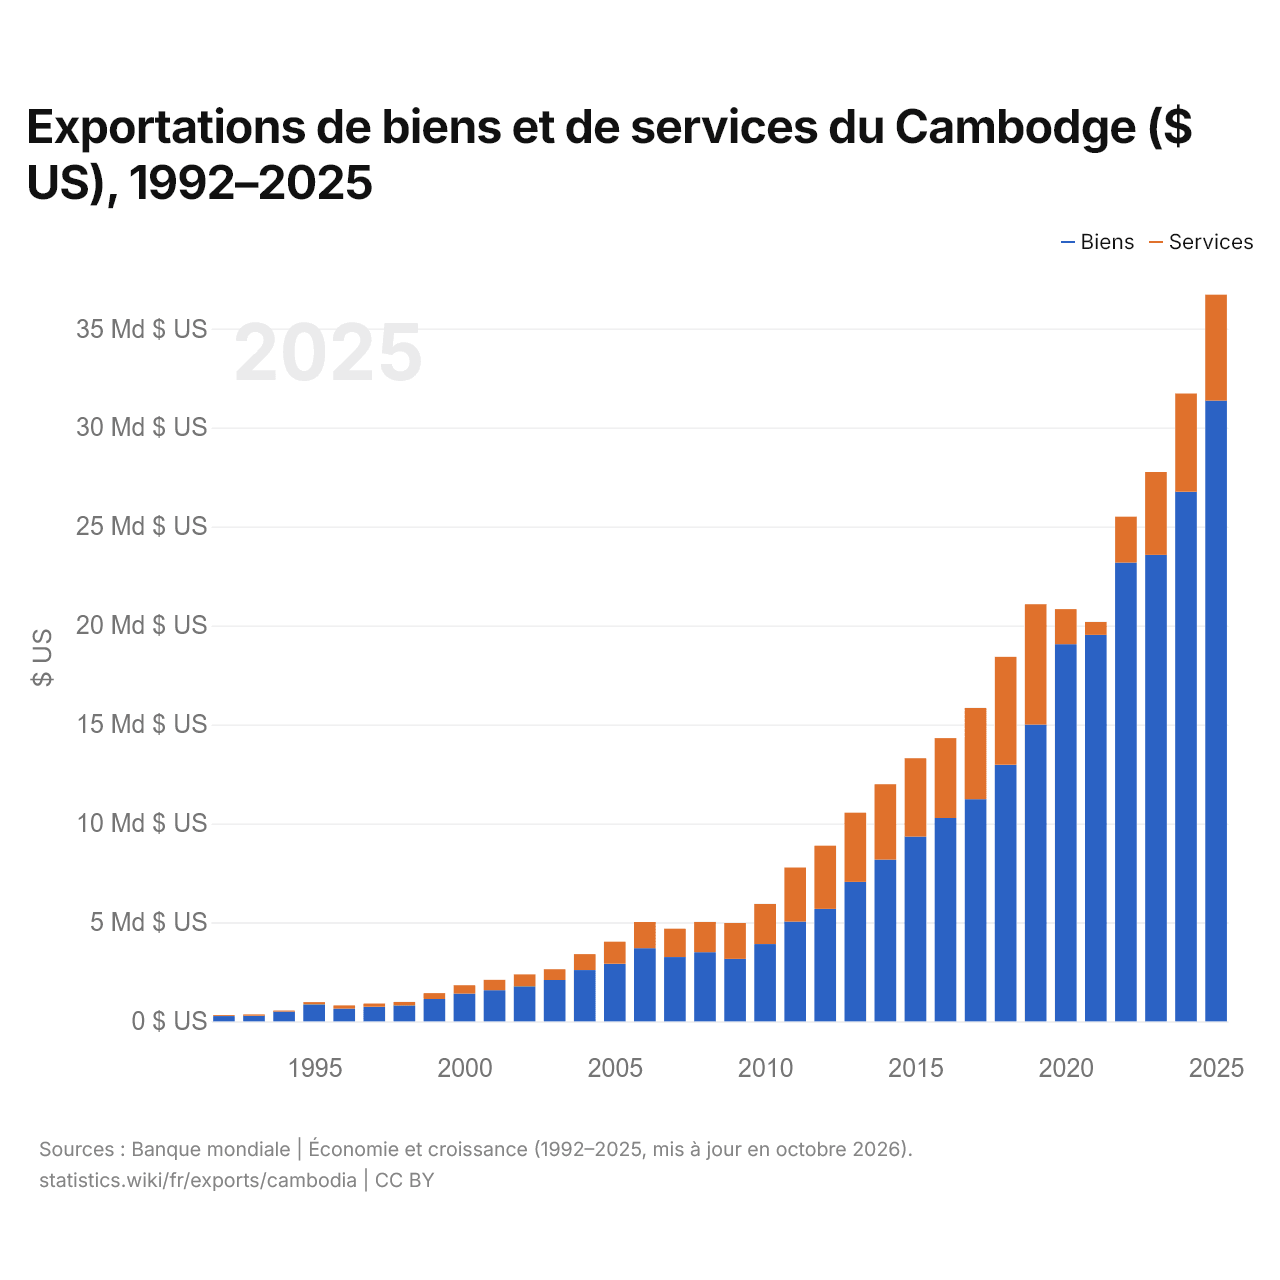
Exportations de biens et de services du Cambodge ($ US), 1992–2025
| Année | $ US | |
|---|---|---|
| Biens | Services | |
| 2025 | 31 359 193 869 $ US | 5 351 433 093 $ US |
| 2024 | 26 751 672 606 $ US | 4 966 583 656 $ US |
| 2023 | 23 564 391 216 $ US | 4 188 152 809 $ US |
| 2022 | 23 178 927 520 $ US | 2 317 934 461 $ US |
| 2021 | 19 520 944 332 $ US | 657 296 725 $ US |
| 2020 | 19 055 244 840 $ US | 1 767 432 513 $ US |
| 2019 | 14 986 142 170 $ US | 6 086 280 078 $ US |
| 2018 | 12 962 698 484 $ US | 5 451 237 383 $ US |
| 2017 | 11 223 642 803 $ US | 4 608 223 721 $ US |
| 2016 | 10 272 926 617 $ US | 4 032 905 458 $ US |
| 2015 | 9 336 304 092 $ US | 3 954 729 832 $ US |
| 2014 | 8 168 535 518 $ US | 3 810 809 306 $ US |
| 2013 | 7 043 869 638 $ US | 3 493 722 710 $ US |
| 2012 | 5 683 779 668 $ US | 3 192 106 492 $ US |
| 2011 | 5 040 651 644 $ US | 2 730 122 519 $ US |
| 2010 | 3 902 895 992 $ US | 2 028 488 798 $ US |
| 2009 | 3 153 637 940 $ US | 1 811 872 468 $ US |
| 2008 | 3 493 099 141 $ US | 1 527 394 040 $ US |
| 2007 | 3 247 780 957 $ US | 1 432 866 176 $ US |
| 2006 | 3 692 382 885 $ US | 1 324 645 885 $ US |
| 2005 | 2 907 982 186 $ US | 1 118 105 732 $ US |
| 2004 | 2 588 900 439 $ US | 804 918 414 $ US |
| 2003 | 2 086 800 285 $ US | 547 977 965 $ US |
| 2002 | 1 769 804 974 $ US | 604 185 054 $ US |
| 2001 | 1 571 184 739 $ US | 524 601 951 $ US |
| 2000 | 1 397 116 191 $ US | 428 444 057 $ US |
| 1999 | 1 130 339 200 $ US | 293 926 630 $ US |
| 1998 | 802 006 672 $ US | 177 327 148 $ US |
| 1997 | 736 000 000 $ US | 160 400 000 $ US |
| 1996 | 643 600 000 $ US | 162 800 000 $ US |
| 1995 | 855 200 000 $ US | 114 000 000 $ US |
| 1994 | 489 900 000 $ US | 54 500 000 $ US |
| 1993 | 283 672 000 $ US | 63 900 000 $ US |
| 1992 | 264 500 000 $ US | 49 700 000 $ US |
En 2025, les exportations de biens du Cambodge s'élevaient à 31,4 milliards de dollars et celles de services à 5,35 milliards de dollars ; les services représentaient 14,6 % du total, contre 15,8 % en 1992.
Le Cambodge dans le classement mondial des exportations, 2025







Exportations de biens et services du Cambodge, % du PIB, 1993–2025
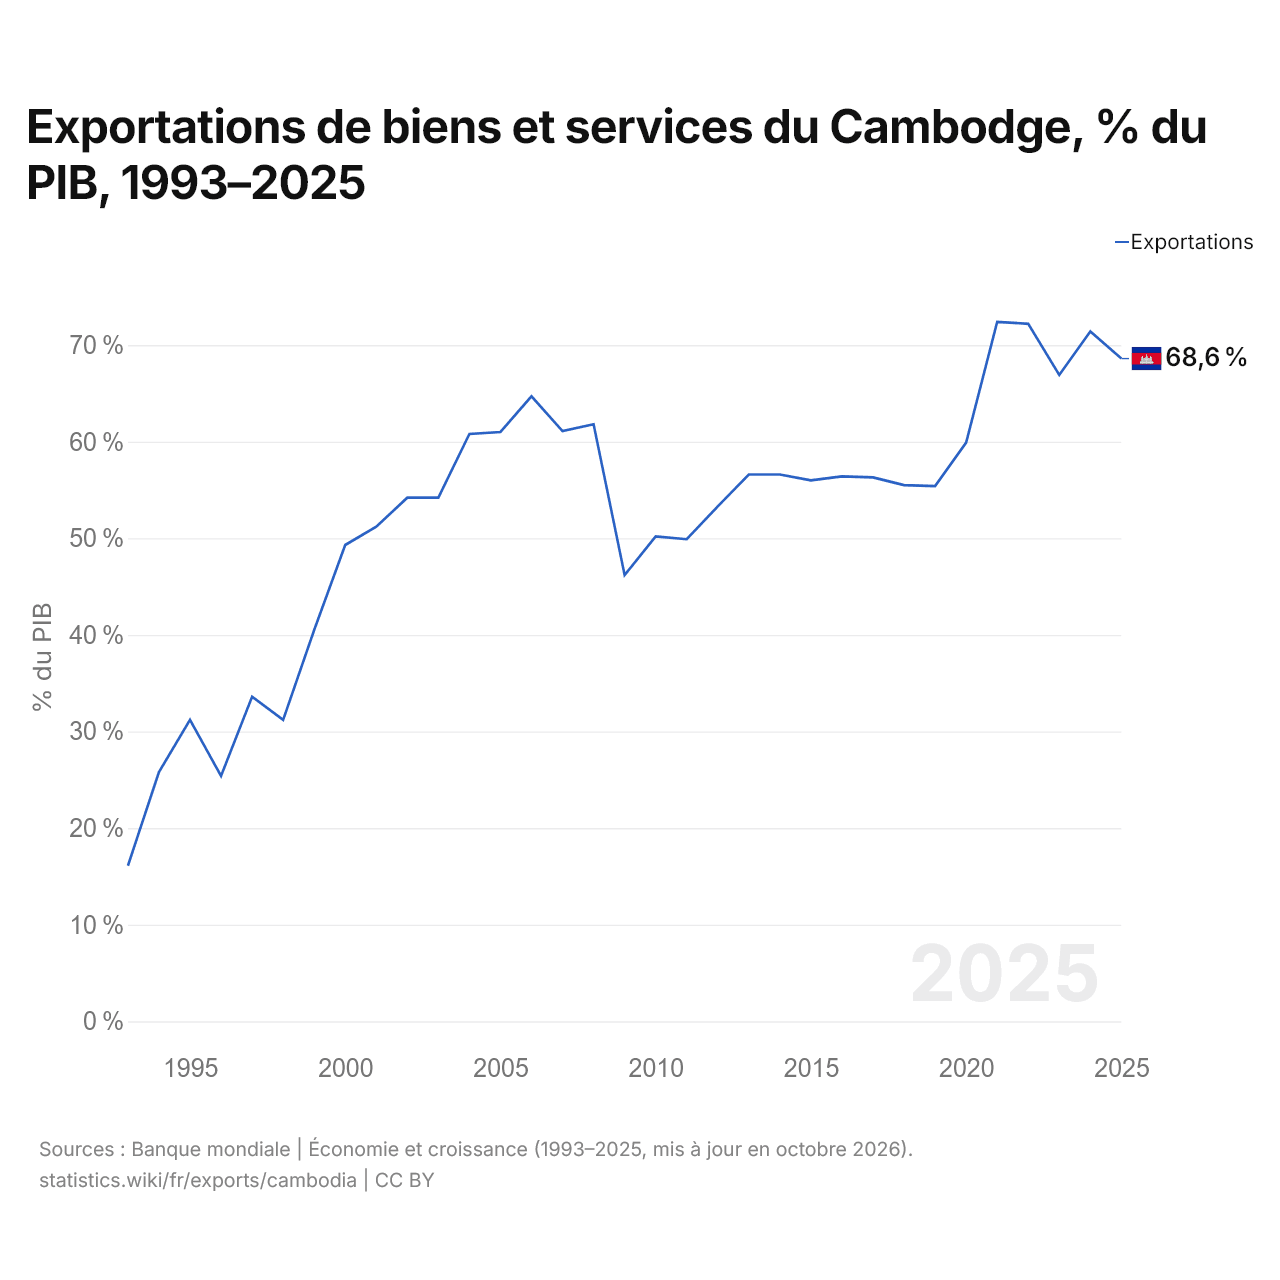
En 2025, les exportations de biens et services du Cambodge équivalaient à 68,6 % de son PIB, contre 16,1 % en 1993. La part la plus élevée a été de 72,4 %, en 2021.
Comparer les exportations du Cambodge avec celles d'autres pays
Sources :
- TradeMap (2001–2025, mis à jour en octobre 2026)
- Banque mondiale | Économie et croissance (1992–2025, mis à jour en octobre 2026)
Creative Commons Attribution (CC BY) : vous pouvez copier, partager, adapter et réutiliser ce contenu, y compris à des fins commerciales, à condition de citer statistics.wiki et d’indiquer les modifications apportées. Les sources citées ci-dessus peuvent avoir leurs propres conditions de licence.