
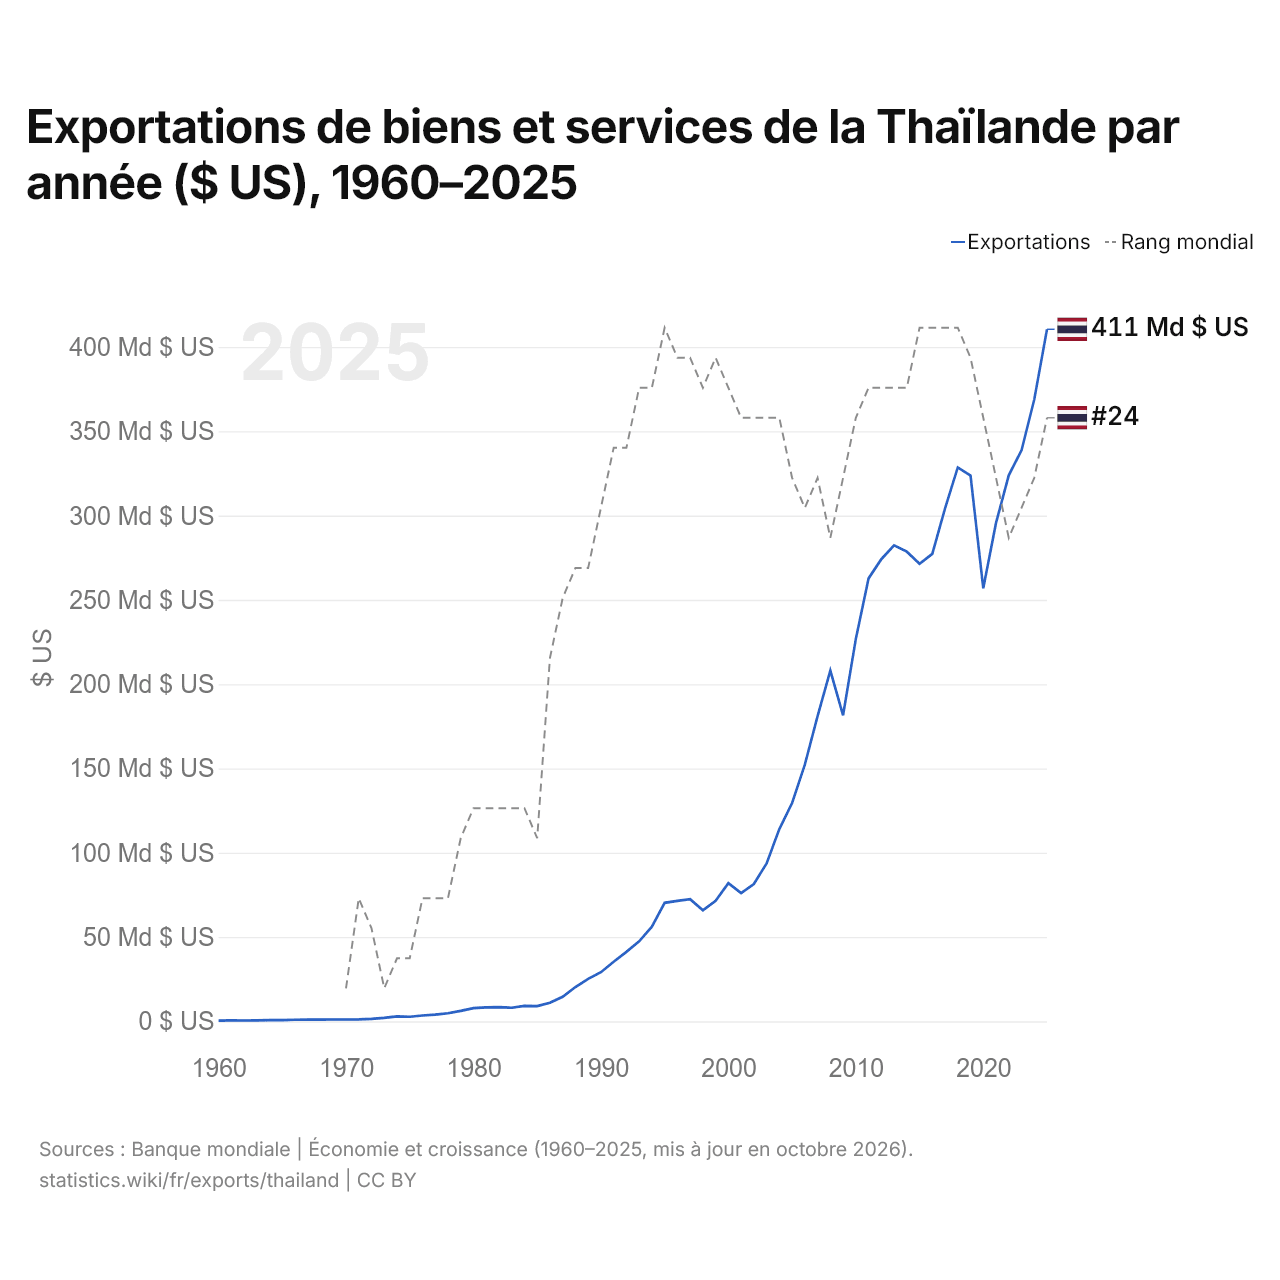
Exportations de biens et services de la Thaïlande par année ($ US), 1960–2025
| Année | $ US | Rang mondial |
|---|---|---|
| Exportations | Rang mondial | |
| 2025 | 410 531 624 594 $ US | #24 |
| 2024 | 368 836 810 863 $ US | #26 |
| 2023 | 338 714 010 202 $ US | #27 |
| 2022 | 323 854 472 232 $ US | #28 |
| 2021 | 295 639 913 234 $ US | #26 |
| 2020 | 256 835 239 507 $ US | #24 |
| 2019 | 323 768 892 197 $ US | #22 |
| 2018 | 328 569 784 687 $ US | #21 |
| 2017 | 304 266 013 738 $ US | #21 |
| 2016 | 277 248 464 807 $ US | #21 |
| 2015 | 271 423 493 718 $ US | #21 |
| 2014 | 278 596 013 717 $ US | #23 |
| 2013 | 282 342 912 104 $ US | #23 |
| 2012 | 274 121 377 629 $ US | #23 |
| 2011 | 262 743 281 925 $ US | #23 |
| 2010 | 226 787 505 596 $ US | #24 |
| 2009 | 181 530 421 335 $ US | #26 |
| 2008 | 208 095 289 026 $ US | #28 |
| 2007 | 181 094 565 788 $ US | #26 |
| 2006 | 152 293 268 280 $ US | #27 |
| 2005 | 129 498 934 986 $ US | #26 |
| 2004 | 114 062 494 756 $ US | #24 |
| 2003 | 93 686 920 142 $ US | #24 |
| 2002 | 81 447 794 223 $ US | #24 |
| 2001 | 76 088 350 937 $ US | #24 |
| 2000 | 81 953 035 120 $ US | #23 |
| 1999 | 71 490 257 382 $ US | #22 |
| 1998 | 65 860 574 771 $ US | #23 |
| 1997 | 72 442 635 001 $ US | #22 |
| 1996 | 71 417 458 049 $ US | #22 |
| 1995 | 70 305 503 762 $ US | #21 |
| 1994 | 56 094 977 835 $ US | #23 |
| 1993 | 47 453 533 153 $ US | #23 |
| 1992 | 41 206 839 588 $ US | #25 |
| 1991 | 35 329 436 945 $ US | #25 |
| 1990 | 29 129 276 618 $ US | #27 |
| 1989 | 25 231 065 262 $ US | #29 |
| 1988 | 20 357 574 272 $ US | #29 |
| 1987 | 14 601 717 480 $ US | #30 |
| 1986 | 11 033 548 459 $ US | #32 |
| 1985 | 9 030 266 962 $ US | #38 |
| 1984 | 9 154 262 959 $ US | #37 |
| 1983 | 8 053 089 819 $ US | #37 |
| 1982 | 8 385 609 881 $ US | #37 |
| 1981 | 8 309 867 953 $ US | #37 |
| 1980 | 7 800 900 873 $ US | #37 |
| 1979 | 6 178 088 809 $ US | #38 |
| 1978 | 4 773 874 326 $ US | #40 |
| 1977 | 3 947 627 127 $ US | #40 |
| 1976 | 3 436 992 450 $ US | #40 |
| 1975 | 2 732 924 326 $ US | #42 |
| 1974 | 2 958 365 413 $ US | #42 |
| 1973 | 2 016 289 602 $ US | #43 |
| 1972 | 1 487 497 926 $ US | #41 |
| 1971 | 1 179 182 692 $ US | #40 |
| 1970 | 1 064 423 077 $ US | #43 |
| 1969 | 1 075 384 615 $ US | - |
| 1968 | 1 030 048 077 $ US | - |
| 1967 | 1 024 038 462 $ US | - |
| 1966 | 929 903 846 $ US | - |
| 1965 | 739 759 615 $ US | - |
| 1964 | 674 951 923 $ US | - |
| 1963 | 535 813 730 $ US | - |
| 1962 | 519 061 303 $ US | - |
| 1961 | 525 964 886 $ US | - |
| 1960 | 445 713 376 $ US | - |
En 2025, les exportations de biens et services de la Thaïlande s'élevaient à 411 milliards de dollars, contre 446 millions de dollars en 1960. Elles se classaient au 24e rang mondial, en hausse par rapport au 26e rang en 2024. Leur meilleur rang a été le 21e, occupé pour la dernière fois en 2018.
En 2025, les exportations de biens et services de la Thaïlande étaient les 9es plus élevées de 44 pays situés en Asie. Les importations de biens et services de la Thaïlande s'élevaient à 388 milliards de dollars en 2025, au 26e rang mondial. En 2025, les exportations de la Thaïlande dépassaient ses importations de 22,4 milliards de dollars, soit un excédent commercial.
Exportations de biens de la Thaïlande par catégorie, 2025
Exportations de biens, 2025: 338 Md $US
En 2025, la première catégorie des exportations de biens de la Thaïlande était « machines, électronique et véhicules », avec 49,9 %, suivie de « pétrole, gaz, minerais et autres matières premières », avec 9,4 %.
Destinations des exportations de biens de la Thaïlande : les 10 premières, 2025
| Rang | Pays | Exportations de biens | Part | |
|---|---|---|---|---|
| 1 |
 États-Unis |
72,2 Md $US | 21,4 % | |
| 2 |
 Chine |
39,4 Md $US | 11,7 % | vs Chine |
| 3 |
 Japon |
23,5 Md $US | 6,96 % | vs Japon |
| 4 |
 Inde |
15,8 Md $US | 4,69 % | |
| 5 |
 Malaisie |
13,4 Md $US | 3,95 % | vs Malaisie |
| 6 |
 Vietnam |
12,7 Md $US | 3,77 % | vs Vietnam |
| 7 |
 Australie |
12,0 Md $US | 3,54 % | |
| 8 |
 Singapour |
11,8 Md $US | 3,49 % | |
| 9 |
 Indonésie |
9,28 Md $US | 2,75 % | vs Indonésie |
| 10 |
 Philippines |
7,85 Md $US | 2,32 % | vs Philippines |
| Autres partenaires et non précisés | 120 Md $US | 35,5 % |
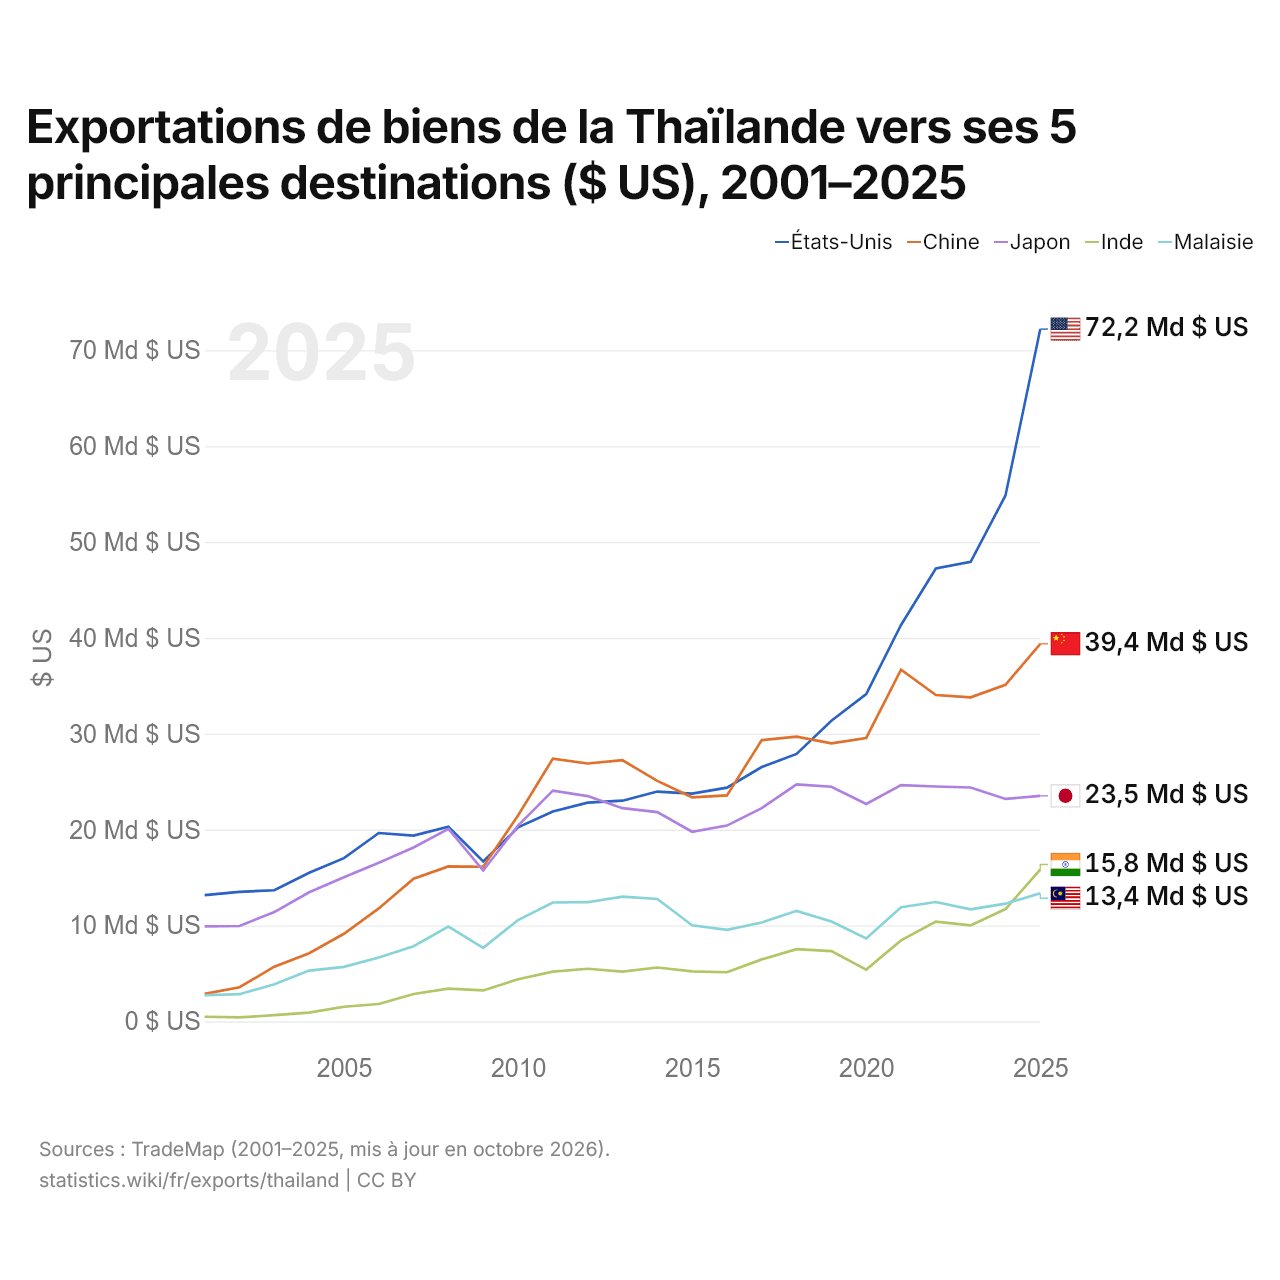
Exportations de biens de la Thaïlande vers ses 5 principales destinations ($ US), 2001–2025
| Année | $ US | ||||
|---|---|---|---|---|---|
| États-Unis | Chine | Japon | Inde | Malaisie | |
| 2025 | 72 212 304 000 $ US | 39 381 280 000 $ US | 23 523 293 000 $ US | 15 838 528 000 $ US | 13 359 476 000 $ US |
| 2024 | 54 859 278 000 $ US | 35 104 482 000 $ US | 23 201 163 000 $ US | 11 709 026 000 $ US | 12 271 994 000 $ US |
| 2023 | 47 931 378 000 $ US | 33 801 523 000 $ US | 24 395 559 000 $ US | 10 010 913 000 $ US | 11 680 085 000 $ US |
| 2022 | 47 238 814 000 $ US | 34 037 510 000 $ US | 24 493 028 000 $ US | 10 407 379 000 $ US | 12 446 272 000 $ US |
| 2021 | 41 351 369 000 $ US | 36 689 362 000 $ US | 24 633 451 000 $ US | 8 446 611 000 $ US | 11 911 898 000 $ US |
| 2020 | 34 134 647 000 $ US | 29 560 572 000 $ US | 22 678 467 000 $ US | 5 395 280 000 $ US | 8 648 556 000 $ US |
| 2019 | 31 362 113 000 $ US | 29 002 027 000 $ US | 24 472 836 000 $ US | 7 324 108 000 $ US | 10 421 020 000 $ US |
| 2018 | 27 893 610 000 $ US | 29 703 268 000 $ US | 24 717 571 000 $ US | 7 525 215 000 $ US | 11 525 506 000 $ US |
| 2017 | 26 527 135 000 $ US | 29 339 373 000 $ US | 22 242 302 000 $ US | 6 462 082 000 $ US | 10 307 088 000 $ US |
| 2016 | 24 376 995 000 $ US | 23 568 131 000 $ US | 20 420 004 000 $ US | 5 116 849 000 $ US | 9 538 652 000 $ US |
| 2015 | 23 757 510 000 $ US | 23 371 308 000 $ US | 19 771 635 000 $ US | 5 204 755 000 $ US | 10 018 895 000 $ US |
| 2014 | 23 967 867 000 $ US | 25 084 369 000 $ US | 21 820 597 000 $ US | 5 614 841 000 $ US | 12 764 450 000 $ US |
| 2013 | 23 017 138 000 $ US | 27 238 224 000 $ US | 22 235 592 000 $ US | 5 182 286 000 $ US | 13 014 893 000 $ US |
| 2012 | 22 816 643 000 $ US | 26 899 634 000 $ US | 23 495 120 000 $ US | 5 481 361 000 $ US | 12 427 648 000 $ US |
| 2011 | 21 893 128 000 $ US | 27 402 402 000 $ US | 24 070 267 000 $ US | 5 181 438 000 $ US | 12 398 740 000 $ US |
| 2010 | 20 230 501 000 $ US | 21 473 195 000 $ US | 20 415 711 000 $ US | 4 393 576 000 $ US | 10 566 684 000 $ US |
| 2009 | 16 684 947 000 $ US | 16 123 831 000 $ US | 15 731 838 000 $ US | 3 222 349 000 $ US | 7 663 654 000 $ US |
| 2008 | 20 297 685 000 $ US | 16 157 864 000 $ US | 20 077 626 000 $ US | 3 402 950 000 $ US | 9 880 747 000 $ US |
| 2007 | 19 372 064 000 $ US | 14 872 546 000 $ US | 18 133 187 000 $ US | 2 852 867 000 $ US | 7 833 096 000 $ US |
| 2006 | 19 646 952 000 $ US | 11 774 180 000 $ US | 16 542 485 000 $ US | 1 810 747 000 $ US | 6 664 972 000 $ US |
| 2005 | 17 024 771 000 $ US | 9 134 204 000 $ US | 15 029 432 000 $ US | 1 518 928 000 $ US | 5 684 913 000 $ US |
| 2004 | 15 502 663 000 $ US | 7 097 954 000 $ US | 13 457 061 000 $ US | 911 657 000 $ US | 5 297 012 000 $ US |
| 2003 | 13 671 640 000 $ US | 5 701 477 000 $ US | 11 399 102 000 $ US | 640 297 000 $ US | 3 876 719 000 $ US |
| 2002 | 13 506 537 000 $ US | 3 554 360 000 $ US | 9 946 776 000 $ US | 413 205 000 $ US | 2 833 118 000 $ US |
| 2001 | 13 169 936 000 $ US | 2 862 718 000 $ US | 9 898 256 000 $ US | 482 061 000 $ US | 2 722 699 000 $ US |
En 2025, les exportations de biens s'élevaient à 72,2 milliards de dollars vers les États-Unis, 39,4 milliards de dollars vers la Chine, 23,5 milliards de dollars vers le Japon, 15,8 milliards de dollars vers l'Inde et 13,4 milliards de dollars vers la Malaisie. Le premier rang des cinq destinations de la Thaïlande est occupé par les États-Unis depuis 2019. Le changement le plus récent dans leur ordre remonte à 2025, quand les exportations de la Thaïlande vers l'Inde ont dépassé celles vers la Malaisie.
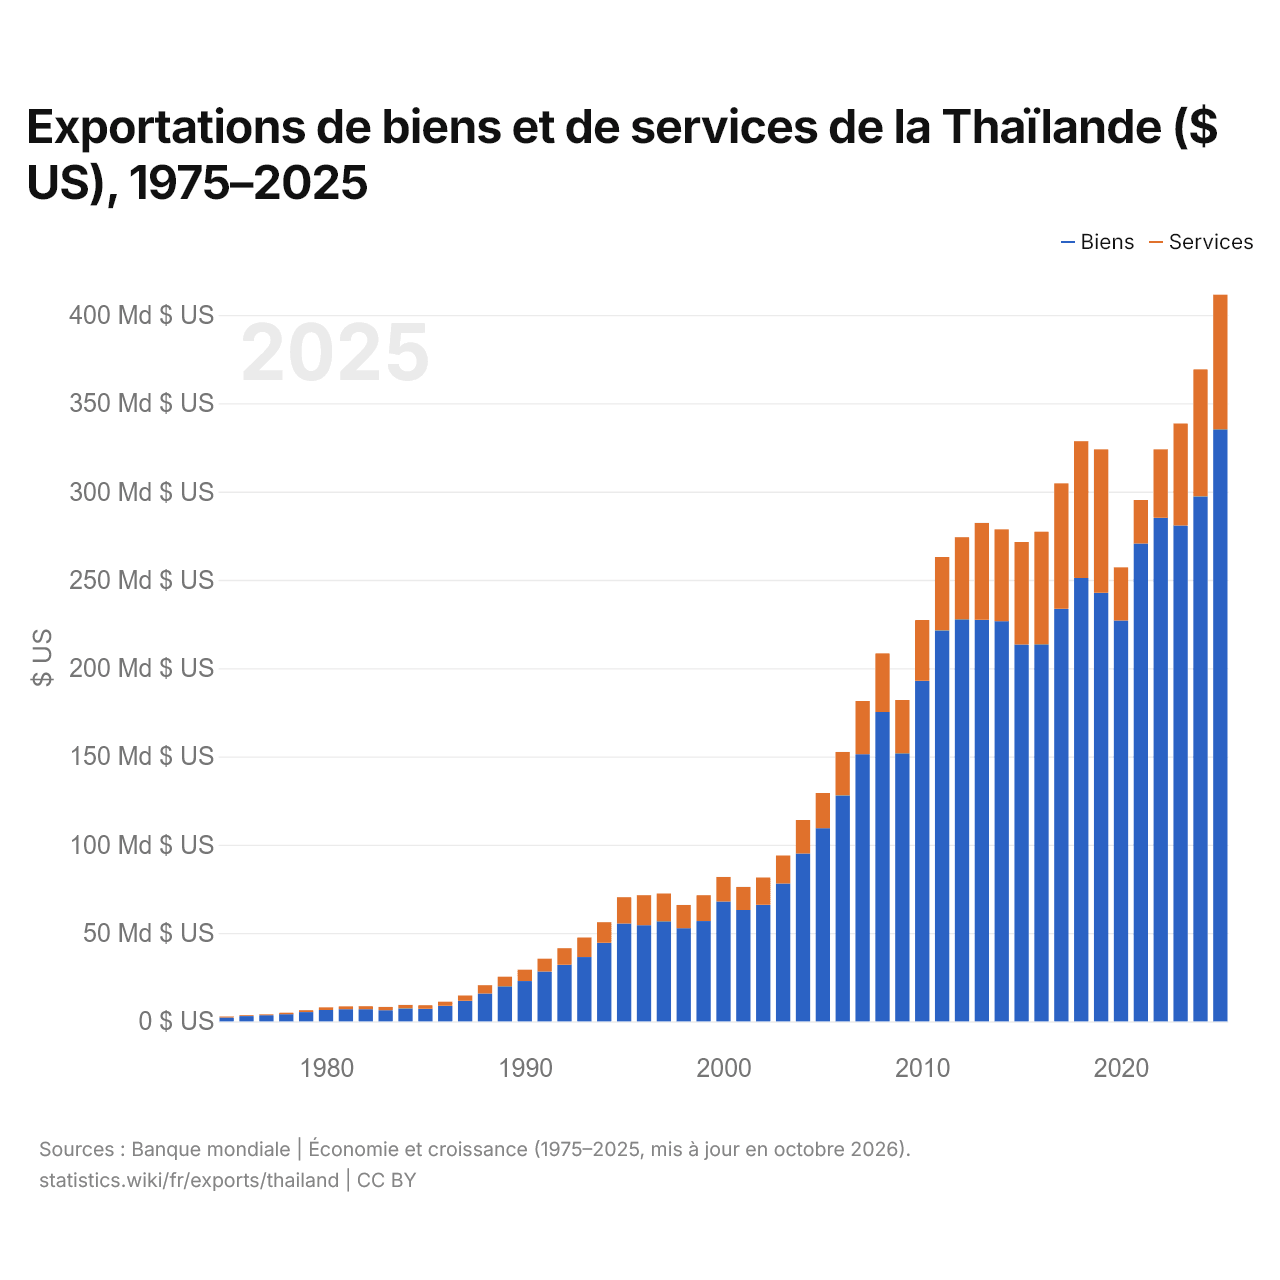
Exportations de biens et de services de la Thaïlande ($ US), 1975–2025
| Année | $ US | |
|---|---|---|
| Biens | Services | |
| 2025 | 335 258 290 768 $ US | 76 251 980 529 $ US |
| 2024 | 297 269 887 737 $ US | 71 917 963 214 $ US |
| 2023 | 280 745 604 805 $ US | 57 779 380 776 $ US |
| 2022 | 285 162 032 507 $ US | 38 777 953 642 $ US |
| 2021 | 270 564 324 097 $ US | 24 626 063 575 $ US |
| 2020 | 226 983 915 747 $ US | 30 121 631 510 $ US |
| 2019 | 242 700 800 852 $ US | 81 177 527 679 $ US |
| 2018 | 251 108 126 951 $ US | 77 473 628 713 $ US |
| 2017 | 233 688 041 598 $ US | 70 964 140 350 $ US |
| 2016 | 213 487 498 233 $ US | 63 786 404 939 $ US |
| 2015 | 213 364 021 658 $ US | 58 082 146 243 $ US |
| 2014 | 226 638 126 269 $ US | 51 940 180 537 $ US |
| 2013 | 227 455 335 389 $ US | 54 804 079 249 $ US |
| 2012 | 227 655 209 875 $ US | 46 521 371 222 $ US |
| 2011 | 221 399 030 000 $ US | 41 544 596 361 $ US |
| 2010 | 192 902 960 000 $ US | 34 339 814 272 $ US |
| 2009 | 151 763 790 000 $ US | 30 204 226 733 $ US |
| 2008 | 175 233 060 000 $ US | 33 124 720 000 $ US |
| 2007 | 151 258 340 000 $ US | 30 113 900 000 $ US |
| 2006 | 127 941 340 000 $ US | 24 611 780 000 $ US |
| 2005 | 109 362 010 000 $ US | 19 925 420 000 $ US |
| 2004 | 94 978 718 537 $ US | 19 040 150 913 $ US |
| 2003 | 78 083 315 058 $ US | 15 798 334 791 $ US |
| 2002 | 66 052 137 107 $ US | 15 390 634 773 $ US |
| 2001 | 63 082 304 852 $ US | 13 024 282 632 $ US |
| 2000 | 67 893 605 164 $ US | 13 868 246 342 $ US |
| 1999 | 56 775 078 012 $ US | 14 635 147 646 $ US |
| 1998 | 52 752 885 286 $ US | 13 155 630 795 $ US |
| 1997 | 56 655 902 127 $ US | 15 763 256 735 $ US |
| 1996 | 54 408 384 561 $ US | 17 007 424 377 $ US |
| 1995 | 55 446 656 854 $ US | 14 845 200 949 $ US |
| 1994 | 44 504 227 354 $ US | 11 639 967 945 $ US |
| 1993 | 36 406 274 642 $ US | 11 058 864 298 $ US |
| 1992 | 32 099 421 729 $ US | 9 287 992 866 $ US |
| 1991 | 28 232 236 293 $ US | 7 272 076 469 $ US |
| 1990 | 22 810 464 648 $ US | 6 419 018 571 $ US |
| 1989 | 19 833 636 881 $ US | 5 457 347 473 $ US |
| 1988 | 15 781 115 885 $ US | 4 647 499 032 $ US |
| 1987 | 11 594 705 714 $ US | 3 070 038 465 $ US |
| 1986 | 8 803 161 006 $ US | 2 302 189 784 $ US |
| 1985 | 7 059 010 823 $ US | 2 041 290 960 $ US |
| 1984 | 7 337 984 166 $ US | 1 963 945 245 $ US |
| 1983 | 6 307 620 350 $ US | 1 845 729 818 $ US |
| 1982 | 6 834 878 559 $ US | 1 716 773 947 $ US |
| 1981 | 6 901 509 148 $ US | 1 611 892 565 $ US |
| 1980 | 6 449 078 392 $ US | 1 489 628 082 $ US |
| 1979 | 5 234 398 886 $ US | 1 034 471 869 $ US |
| 1978 | 4 045 181 046 $ US | 818 677 271 $ US |
| 1977 | 3 454 051 201 $ US | 530 585 558 $ US |
| 1976 | 2 958 857 621 $ US | 507 938 614 $ US |
| 1975 | 2 176 967 140 $ US | 603 063 815 $ US |
En 2025, les exportations de biens de la Thaïlande s'élevaient à 335 milliards de dollars et celles de services à 76,3 milliards de dollars ; les services représentaient 18,5 % du total, contre 21,7 % en 1975.
La Thaïlande dans le classement mondial des exportations, 2025
| Rang | Pays | Exportations | Part mondiale | |
|---|---|---|---|---|
| 21 |
Vietnam
|
506 Md $US | 1,45 % | vs Vietnam |
| 22 |
 Russie |
466 Md $US | 1,34 % | |
| 23 |
Australie
|
418 Md $US | 1,2 % | |
| 24 |
 Thaïlande |
411 Md $US | 1,18 % | |
| 25 |
 Brésil |
406 Md $US | 1,16 % | vs Brésil |
| 26 |
 Turquie |
397 Md $US | 1,14 % | vs Turquie |
| 27 |
 Arabie saoudite |
380 Md $US | 1,09 % |
Exportations de biens et services de la Thaïlande, % du PIB, 1960–2025
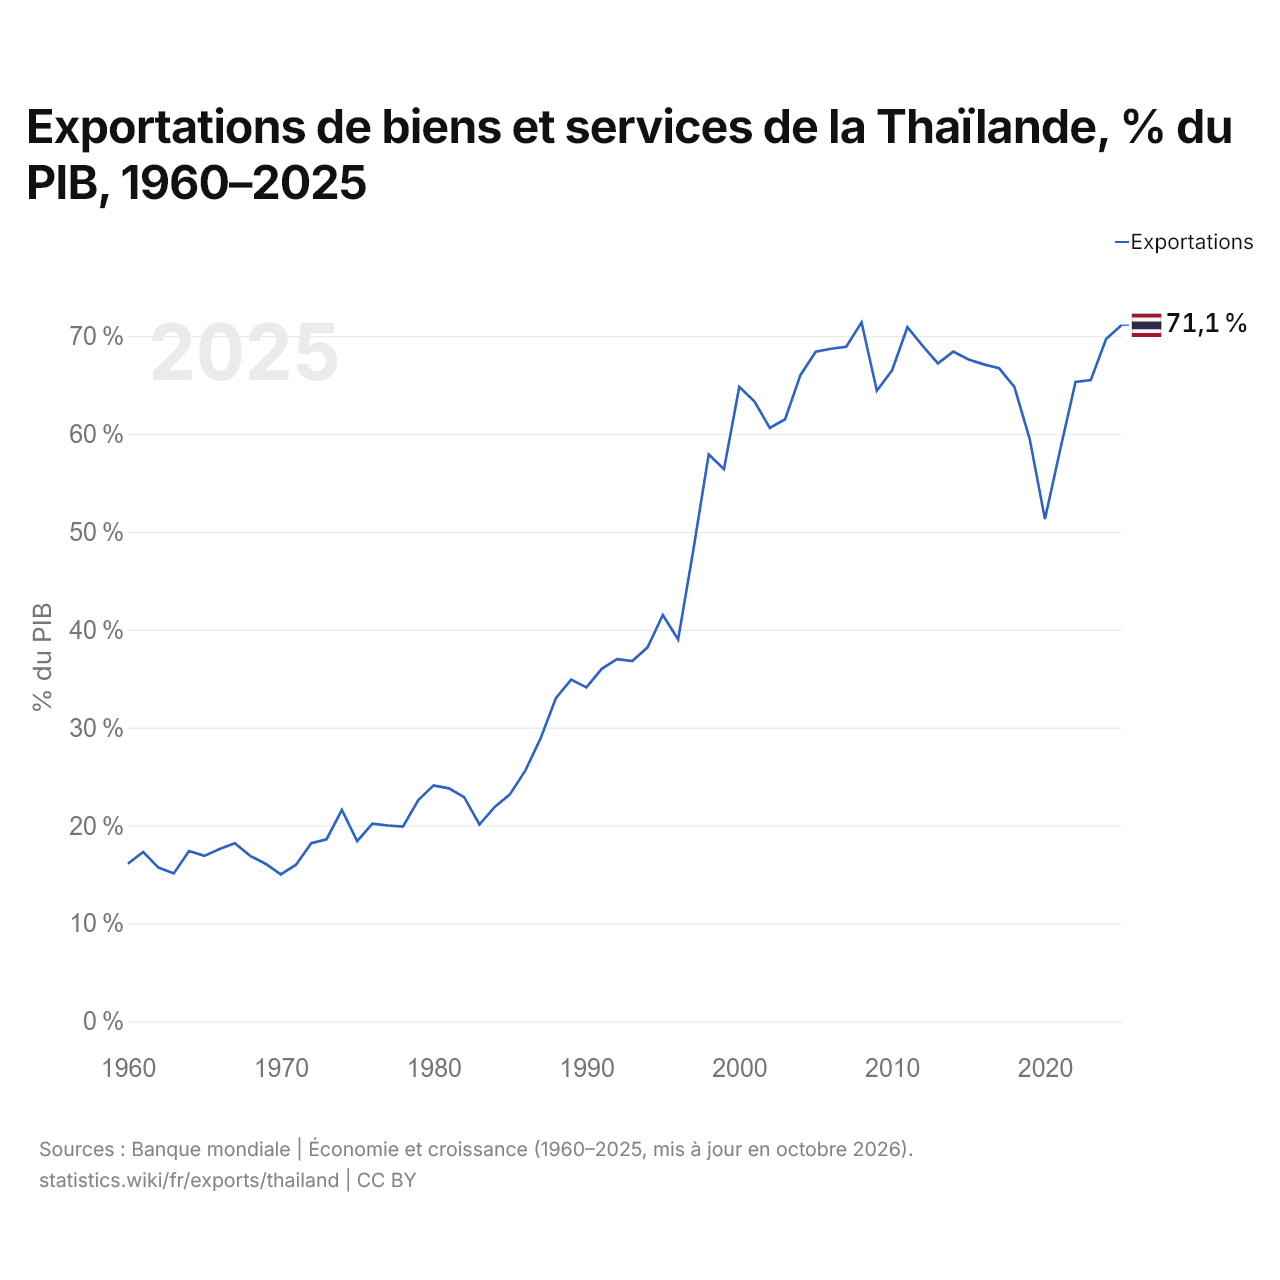
En 2025, les exportations de biens et services de la Thaïlande équivalaient à 71,1 % de son PIB, contre 16,1 % en 1960. La part la plus élevée a été de 71,4 %, en 2008.
Comparer les exportations de la Thaïlande avec celles d'autres pays
Sources :
- TradeMap (2001–2025, mis à jour en octobre 2026)
- Banque mondiale | Économie et croissance (1960–2025, mis à jour en octobre 2026)
Creative Commons Attribution (CC BY) : vous pouvez copier, partager, adapter et réutiliser ce contenu, y compris à des fins commerciales, à condition de citer statistics.wiki et d’indiquer les modifications apportées. Les sources citées ci-dessus peuvent avoir leurs propres conditions de licence.