
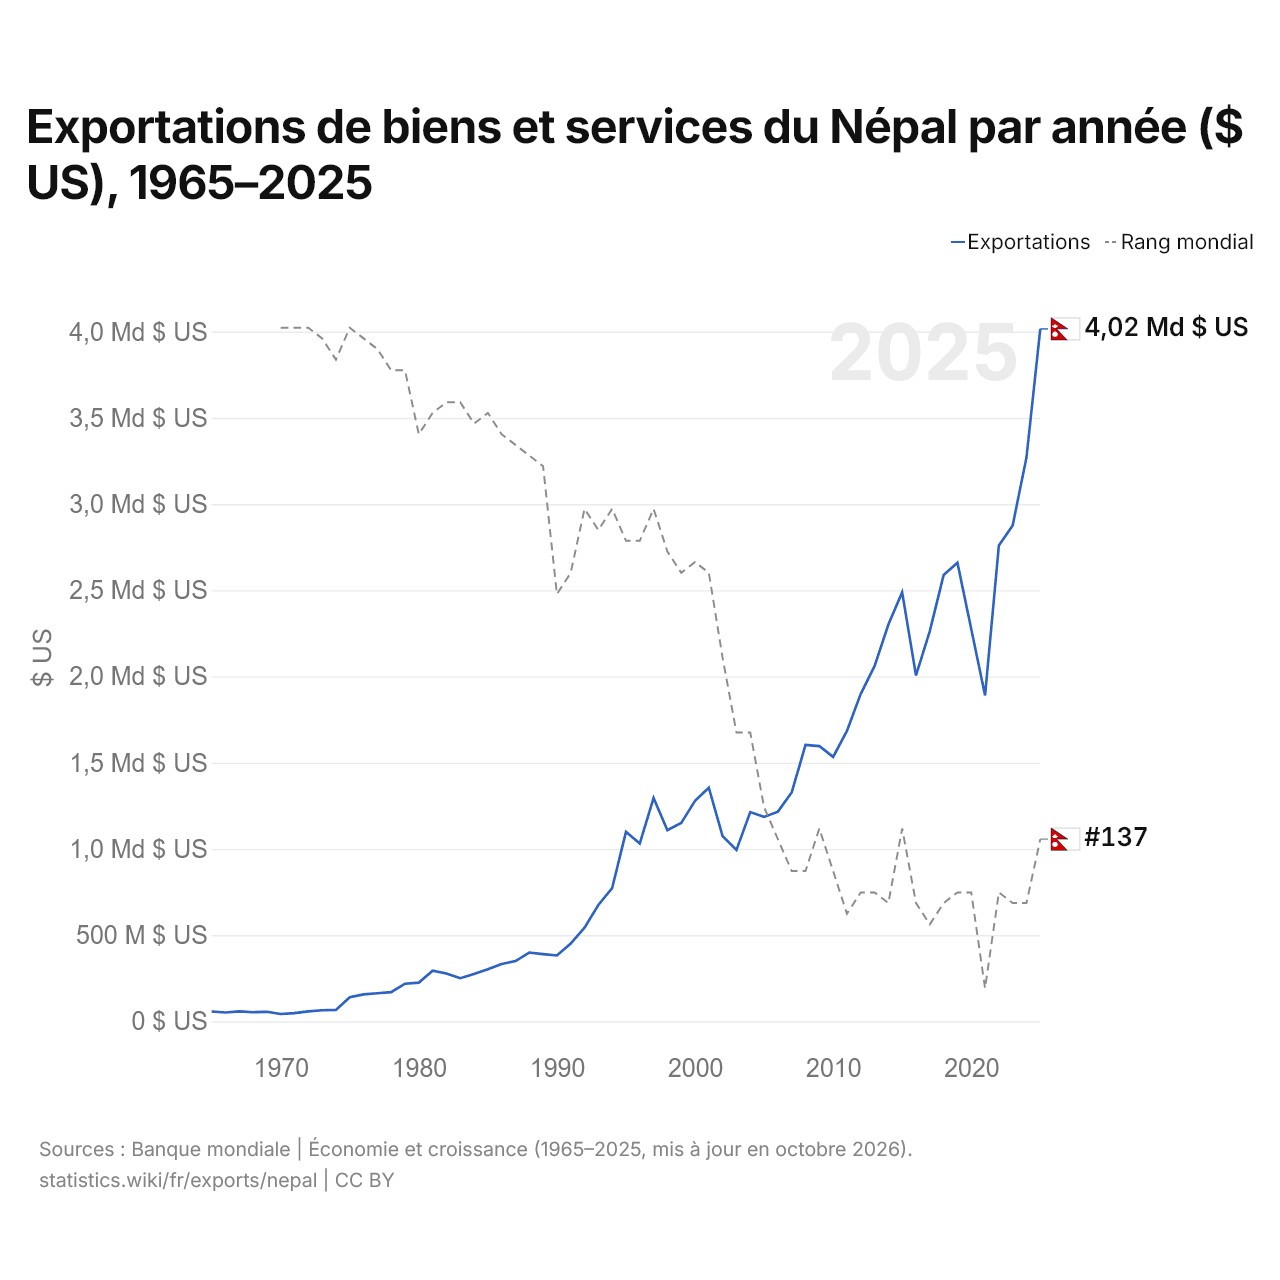
Exportations de biens et services du Népal par année ($ US), 1965–2025
| Année | $ US | Rang mondial |
|---|---|---|
| Exportations | Rang mondial | |
| 2025 | 4 015 673 777 $ US | #137 |
| 2024 | 3 270 900 881 $ US | #143 |
| 2023 | 2 875 902 618 $ US | #143 |
| 2022 | 2 760 241 576 $ US | #142 |
| 2021 | 1 890 245 951 $ US | #151 |
| 2020 | 2 275 260 267 $ US | #142 |
| 2019 | 2 659 663 141 $ US | #142 |
| 2018 | 2 587 877 950 $ US | #143 |
| 2017 | 2 263 315 185 $ US | #145 |
| 2016 | 2 005 968 674 $ US | #143 |
| 2015 | 2 488 355 629 $ US | #136 |
| 2014 | 2 301 358 066 $ US | #143 |
| 2013 | 2 059 901 303 $ US | #142 |
| 2012 | 1 899 084 545 $ US | #142 |
| 2011 | 1 684 085 753 $ US | #144 |
| 2010 | 1 533 460 341 $ US | #140 |
| 2009 | 1 596 506 175 $ US | #136 |
| 2008 | 1 602 782 687 $ US | #140 |
| 2007 | 1 327 426 849 $ US | #140 |
| 2006 | 1 216 071 411 $ US | #137 |
| 2005 | 1 185 691 417 $ US | #134 |
| 2004 | 1 213 488 963 $ US | #127 |
| 2003 | 993 875 698 $ US | #127 |
| 2002 | 1 073 251 679 $ US | #120 |
| 2001 | 1 355 238 095 $ US | #112 |
| 2000 | 1 279 281 888 $ US | #111 |
| 1999 | 1 150 110 375 $ US | #112 |
| 1998 | 1 108 297 014 $ US | #110 |
| 1997 | 1 294 985 096 $ US | #106 |
| 1996 | 1 031 715 001 $ US | #109 |
| 1995 | 1 099 094 803 $ US | #109 |
| 1994 | 772 440 816 $ US | #106 |
| 1993 | 674 654 167 $ US | #108 |
| 1992 | 542 824 053 $ US | #106 |
| 1991 | 450 607 064 $ US | #112 |
| 1990 | 381 884 480 $ US | #114 |
| 1989 | 390 158 053 $ US | #102 |
| 1988 | 399 163 908 $ US | #101 |
| 1987 | 349 348 713 $ US | #100 |
| 1986 | 332 466 752 $ US | #99 |
| 1985 | 302 055 496 $ US | #97 |
| 1984 | 274 961 829 $ US | #98 |
| 1983 | 250 371 505 $ US | #96 |
| 1982 | 277 667 558 $ US | #96 |
| 1981 | 293 583 342 $ US | #97 |
| 1980 | 224 583 342 $ US | #99 |
| 1979 | 218 166 658 $ US | #93 |
| 1978 | 169 586 602 $ US | #93 |
| 1977 | 162 959 992 $ US | #91 |
| 1976 | 156 521 017 $ US | #90 |
| 1975 | 140 262 467 $ US | #89 |
| 1974 | 66 375 048 $ US | #92 |
| 1973 | 64 260 709 $ US | #90 |
| 1972 | 57 975 286 $ US | #89 |
| 1971 | 47 703 704 $ US | #89 |
| 1970 | 42 469 136 $ US | #89 |
| 1969 | 55 308 642 $ US | - |
| 1968 | 52 860 114 $ US | - |
| 1967 | 57 881 612 $ US | - |
| 1966 | 51 187 820 $ US | - |
| 1965 | 57 094 107 $ US | - |
En 2025, les exportations de biens et services du Népal s'élevaient à 4,02 milliards de dollars, contre 57,1 millions de dollars en 1965. Le minimum a été de 42,5 millions de dollars, en 1970. Elles se classaient au 137e rang mondial, en hausse par rapport au 143e rang en 2024. Leur meilleur rang a été le 89e, occupé pour la dernière fois en 1975.
En 2025, les exportations de biens et services du Népal étaient les 38es plus élevées de 44 pays situés en Asie. Les importations de biens et services du Népal s'élevaient à 15,3 milliards de dollars en 2025, au 102e rang mondial. En 2025, les importations du Népal dépassaient ses exportations de 11,3 milliards de dollars, soit un déficit commercial.
Exportations de biens du Népal par catégorie
Exportations de biens, 2022: 1,30 Md $US
La première catégorie des exportations de biens du Népal est « aliments transformés, huiles, aliments pour animaux, boissons et tabac », avec 39,9 %, suivie de « textiles, vêtements, chaussures, meubles et jouets », avec 33,6 %.
Destinations des exportations de biens du Népal : les 10 premières
| Rang | Pays | Exportations de biens | Part | |
|---|---|---|---|---|
| 1 |
 Inde |
935 M $US | 71,9 % | vs Inde |
| 2 |
 États-Unis |
147 M $US | 11,3 % | |
| 3 |
 Allemagne |
32,6 M $US | 2,51 % | |
| 4 |
 Turquie |
26,1 M $US | 2,01 % | |
| 5 |
 Royaume-Uni |
23,8 M $US | 1,83 % | |
| 6 |
 France |
13,2 M $US | 1,02 % | vs France |
| 7 |
 Australie |
10,8 M $US | 0,83 % | |
| 8 |
 Japon |
10,4 M $US | 0,8 % | vs Japon |
| 9 |
 Canada |
10,2 M $US | 0,78 % | vs Canada |
| 10 |
 Italie |
9,89 M $US | 0,76 % | |
| Autres partenaires et non précisés | 80,7 M $US | 6,21 % |
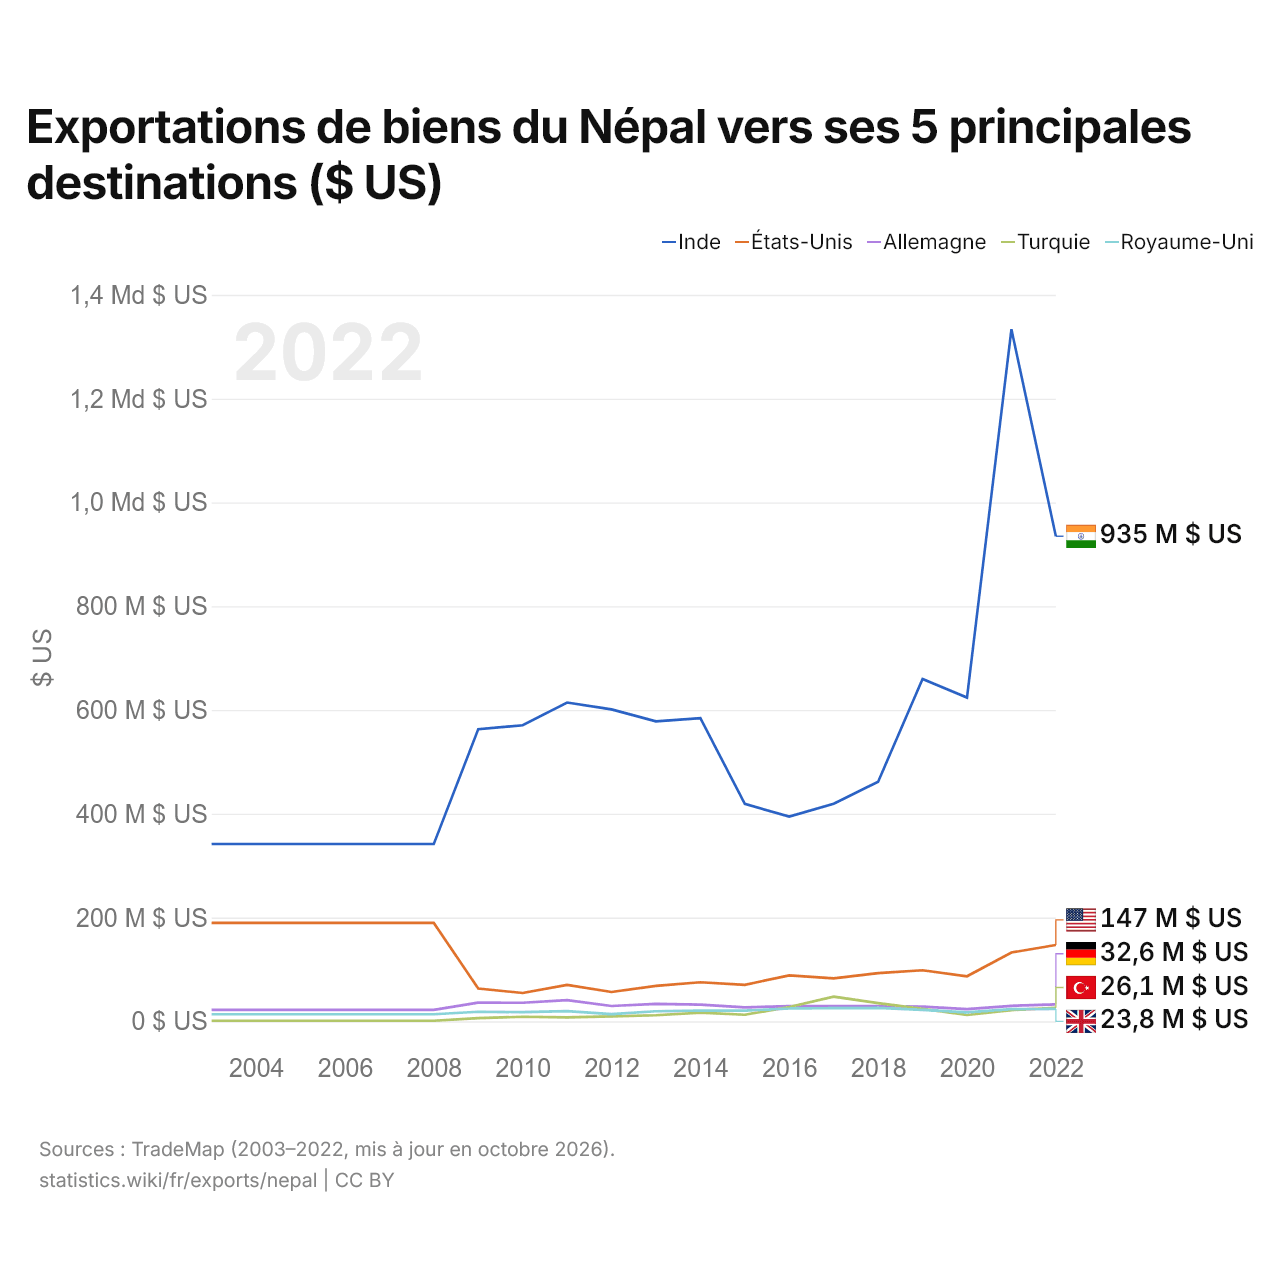
Exportations de biens du Népal vers ses 5 principales destinations ($ US)
| Année | $ US | ||||
|---|---|---|---|---|---|
| Inde | États-Unis | Allemagne | Turquie | Royaume-Uni | |
| 2022 | 934 781 000 $ US | 147 097 000 $ US | 32 626 000 $ US | 26 124 000 $ US | 23 779 000 $ US |
| 2021 | 1 333 726 000 $ US | 132 610 000 $ US | 29 858 000 $ US | 21 678 000 $ US | 23 542 000 $ US |
| 2020 | 623 925 000 $ US | 86 848 000 $ US | 23 640 000 $ US | 12 295 000 $ US | 17 147 000 $ US |
| 2019 | 659 575 000 $ US | 98 372 000 $ US | 28 316 000 $ US | 24 116 000 $ US | 22 146 000 $ US |
| 2018 | 461 816 000 $ US | 92 803 000 $ US | 29 459 000 $ US | 35 173 000 $ US | 26 081 000 $ US |
| 2017 | 419 169 000 $ US | 82 841 000 $ US | 29 161 000 $ US | 47 635 000 $ US | 25 418 000 $ US |
| 2016 | 394 596 000 $ US | 88 480 000 $ US | 29 439 000 $ US | 27 499 000 $ US | 24 655 000 $ US |
| 2015 | 419 094 000 $ US | 70 399 000 $ US | 26 756 000 $ US | 12 642 000 $ US | 20 658 000 $ US |
| 2014 | 584 107 000 $ US | 75 372 000 $ US | 32 341 000 $ US | 16 870 000 $ US | 20 583 000 $ US |
| 2013 | 578 091 000 $ US | 68 236 000 $ US | 33 534 000 $ US | 11 642 000 $ US | 19 472 000 $ US |
| 2012 | 601 181 000 $ US | 56 489 000 $ US | 29 514 000 $ US | 9 611 000 $ US | 13 746 000 $ US |
| 2011 | 614 379 000 $ US | 70 282 000 $ US | 40 902 000 $ US | 7 493 000 $ US | 19 816 000 $ US |
| 2010 | 570 594 000 $ US | 54 654 000 $ US | 35 733 000 $ US | 8 818 000 $ US | 17 673 000 $ US |
| 2009 | 562 810 000 $ US | 63 085 000 $ US | 35 972 000 $ US | 6 102 000 $ US | 18 466 000 $ US |
| 2008 | 341 799 000 $ US | 189 734 000 $ US | 22 118 000 $ US | 1 063 000 $ US | 13 606 000 $ US |
| 2007 | 341 799 000 $ US | 189 734 000 $ US | 22 118 000 $ US | 1 063 000 $ US | 13 606 000 $ US |
| 2006 | 341 799 000 $ US | 189 734 000 $ US | 22 118 000 $ US | 1 063 000 $ US | 13 606 000 $ US |
| 2005 | 341 799 000 $ US | 189 734 000 $ US | 22 118 000 $ US | 1 063 000 $ US | 13 606 000 $ US |
| 2004 | 341 799 000 $ US | 189 734 000 $ US | 22 118 000 $ US | 1 063 000 $ US | 13 606 000 $ US |
| 2003 | 341 799 000 $ US | 189 734 000 $ US | 22 118 000 $ US | 1 063 000 $ US | 13 606 000 $ US |
Les exportations de biens s'élèvent à 935 millions de dollars vers l'Inde (2022), 147 millions de dollars vers les États-Unis (2022), 32,6 millions de dollars vers l'Allemagne (2022), 26,1 millions de dollars vers la Turquie (2022) et 23,8 millions de dollars vers le Royaume-Uni (2022). Le premier rang des cinq destinations du Népal est occupé par l'Inde chaque année depuis 2003. Le changement le plus récent dans leur ordre remonte à 2022, quand les exportations du Népal vers la Turquie ont dépassé celles vers le Royaume-Uni.
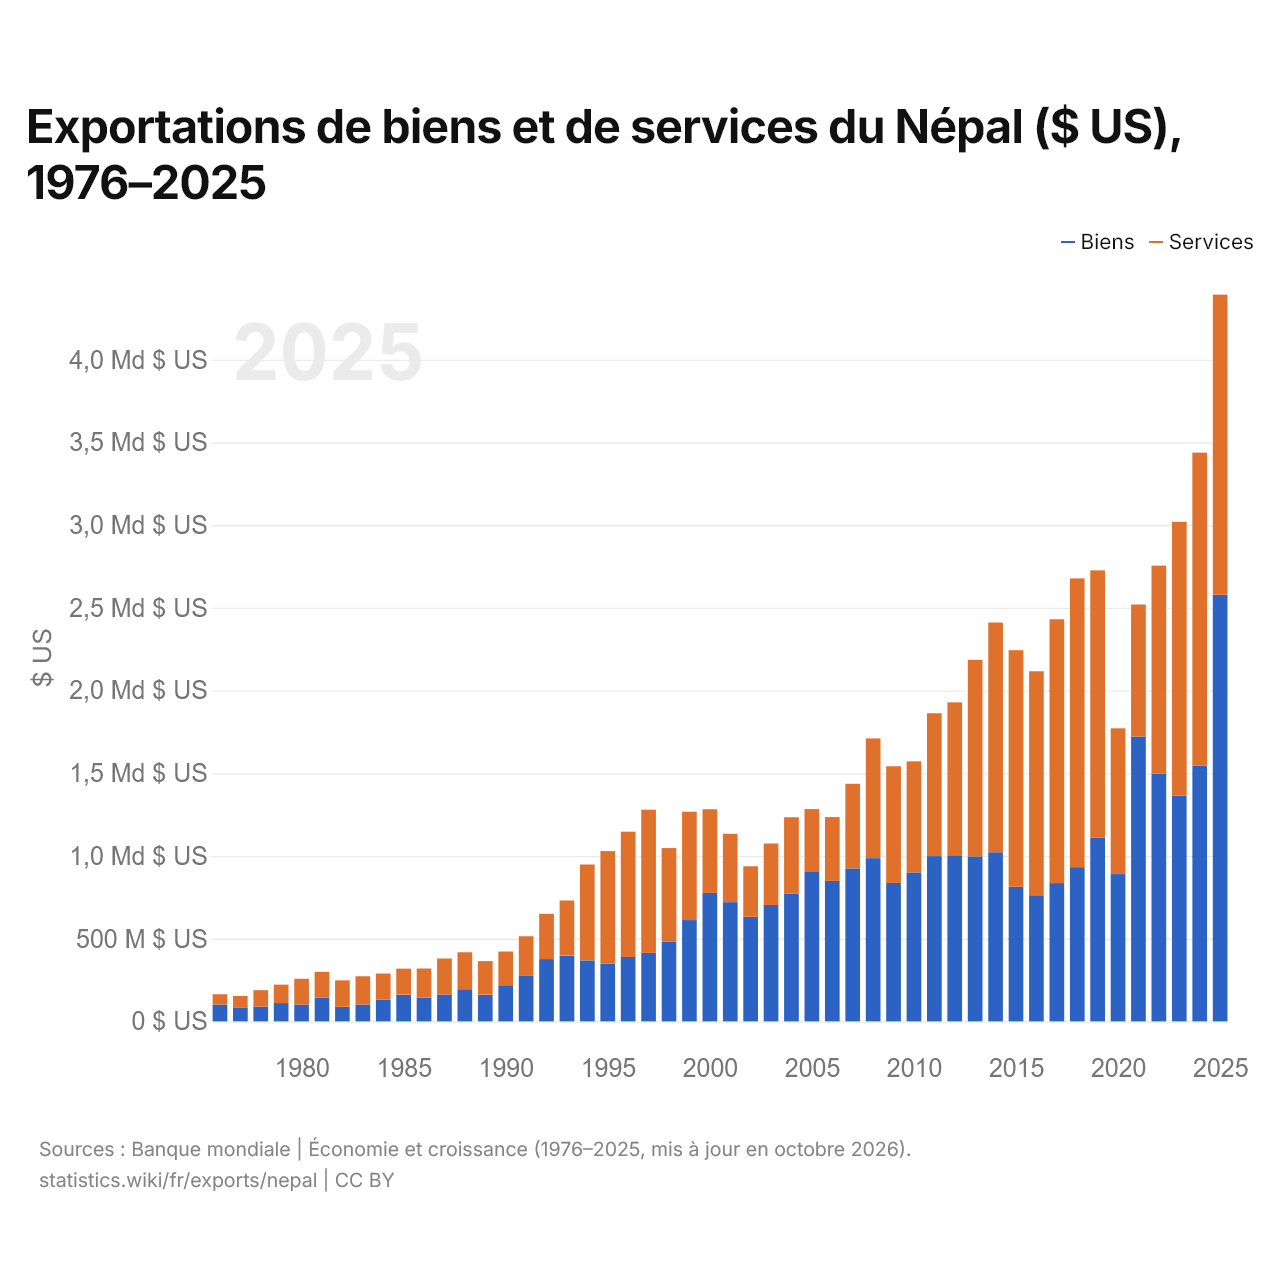
Exportations de biens et de services du Népal ($ US), 1976–2025
| Année | $ US | |
|---|---|---|
| Biens | Services | |
| 2025 | 2 578 246 197 $ US | 1 814 692 284 $ US |
| 2024 | 1 544 677 005 $ US | 1 893 672 275 $ US |
| 2023 | 1 363 519 248 $ US | 1 656 605 240 $ US |
| 2022 | 1 497 816 269 $ US | 1 257 206 438 $ US |
| 2021 | 1 721 683 725 $ US | 797 890 850 $ US |
| 2020 | 890 100 721 $ US | 881 232 951 $ US |
| 2019 | 1 110 916 913 $ US | 1 615 309 509 $ US |
| 2018 | 932 254 409 $ US | 1 745 349 895 $ US |
| 2017 | 835 688 143 $ US | 1 594 768 869 $ US |
| 2016 | 762 283 423 $ US | 1 354 298 955 $ US |
| 2015 | 813 179 964 $ US | 1 430 479 193 $ US |
| 2014 | 1 022 286 756 $ US | 1 388 507 965 $ US |
| 2013 | 997 068 581 $ US | 1 188 369 270 $ US |
| 2012 | 1 003 958 965 $ US | 924 625 218 $ US |
| 2011 | 998 964 291 $ US | 863 470 844 $ US |
| 2010 | 900 586 741 $ US | 670 944 896 $ US |
| 2009 | 837 065 299 $ US | 704 781 420 $ US |
| 2008 | 986 573 076 $ US | 723 663 311 $ US |
| 2007 | 924 931 909 $ US | 511 333 255 $ US |
| 2006 | 848 777 043 $ US | 385 697 634 $ US |
| 2005 | 902 880 579 $ US | 380 346 967 $ US |
| 2004 | 773 061 293 $ US | 460 865 662 $ US |
| 2003 | 703 211 811 $ US | 372 095 085 $ US |
| 2002 | 632 023 022 $ US | 305 218 852 $ US |
| 2001 | 720 510 374 $ US | 413 292 994 $ US |
| 2000 | 776 142 672 $ US | 505 933 912 $ US |
| 1999 | 612 304 439 $ US | 655 090 780 $ US |
| 1998 | 482 041 860 $ US | 565 142 919 $ US |
| 1997 | 413 766 813 $ US | 865 699 997 $ US |
| 1996 | 388 747 760 $ US | 757 459 465 $ US |
| 1995 | 349 861 550 $ US | 679 043 213 $ US |
| 1994 | 368 670 724 $ US | 579 248 577 $ US |
| 1993 | 397 001 460 $ US | 333 236 144 $ US |
| 1992 | 376 261 839 $ US | 273 800 074 $ US |
| 1991 | 274 521 869 $ US | 239 849 991 $ US |
| 1990 | 217 878 004 $ US | 204 359 985 $ US |
| 1989 | 161 153 117 $ US | 203 107 836 $ US |
| 1988 | 193 780 955 $ US | 223 799 702 $ US |
| 1987 | 162 185 407 $ US | 217 689 002 $ US |
| 1986 | 142 570 574 $ US | 176 613 408 $ US |
| 1985 | 161 260 085 $ US | 157 389 119 $ US |
| 1984 | 130 066 720 $ US | 159 174 884 $ US |
| 1983 | 101 459 975 $ US | 171 029 448 $ US |
| 1982 | 87 635 894 $ US | 160 182 779 $ US |
| 1981 | 144 203 177 $ US | 155 489 774 $ US |
| 1980 | 102 058 333 $ US | 155 016 667 $ US |
| 1979 | 110 316 667 $ US | 111 491 667 $ US |
| 1978 | 89 379 686 $ US | 99 129 492 $ US |
| 1977 | 81 176 000 $ US | 72 224 000 $ US |
| 1976 | 102 096 000 $ US | 61 352 000 $ US |
En 2025, les exportations de biens du Népal s'élevaient à 2,58 milliards de dollars et celles de services à 1,81 milliard de dollars ; les services représentaient 41,3 % du total, contre 37,5 % en 1976.
Le Népal dans le classement mondial des exportations, 2025
| Rang | Pays | Exportations | Part mondiale | |
|---|---|---|---|---|
| 134 |
 Mauritanie |
4,65 Md $US | 0,01 % | |
| 135 |
 Bénin |
4,19 Md $US | 0,01 % | |
| 136 |
 Madagascar |
4,19 Md $US | 0,01 % | |
| 137 |
 Népal |
4,02 Md $US | 0,01 % | |
| 138 |
 Somalie |
3,80 Md $US | 0,01 % | |
| 139 |
 Saint-Marin |
3,76 Md $US (2024) | 0,01 % | |
| 140 |
 Monténégro |
3,70 Md $US | 0,01 % |
Exportations de biens et services du Népal, % du PIB, 1965–2025
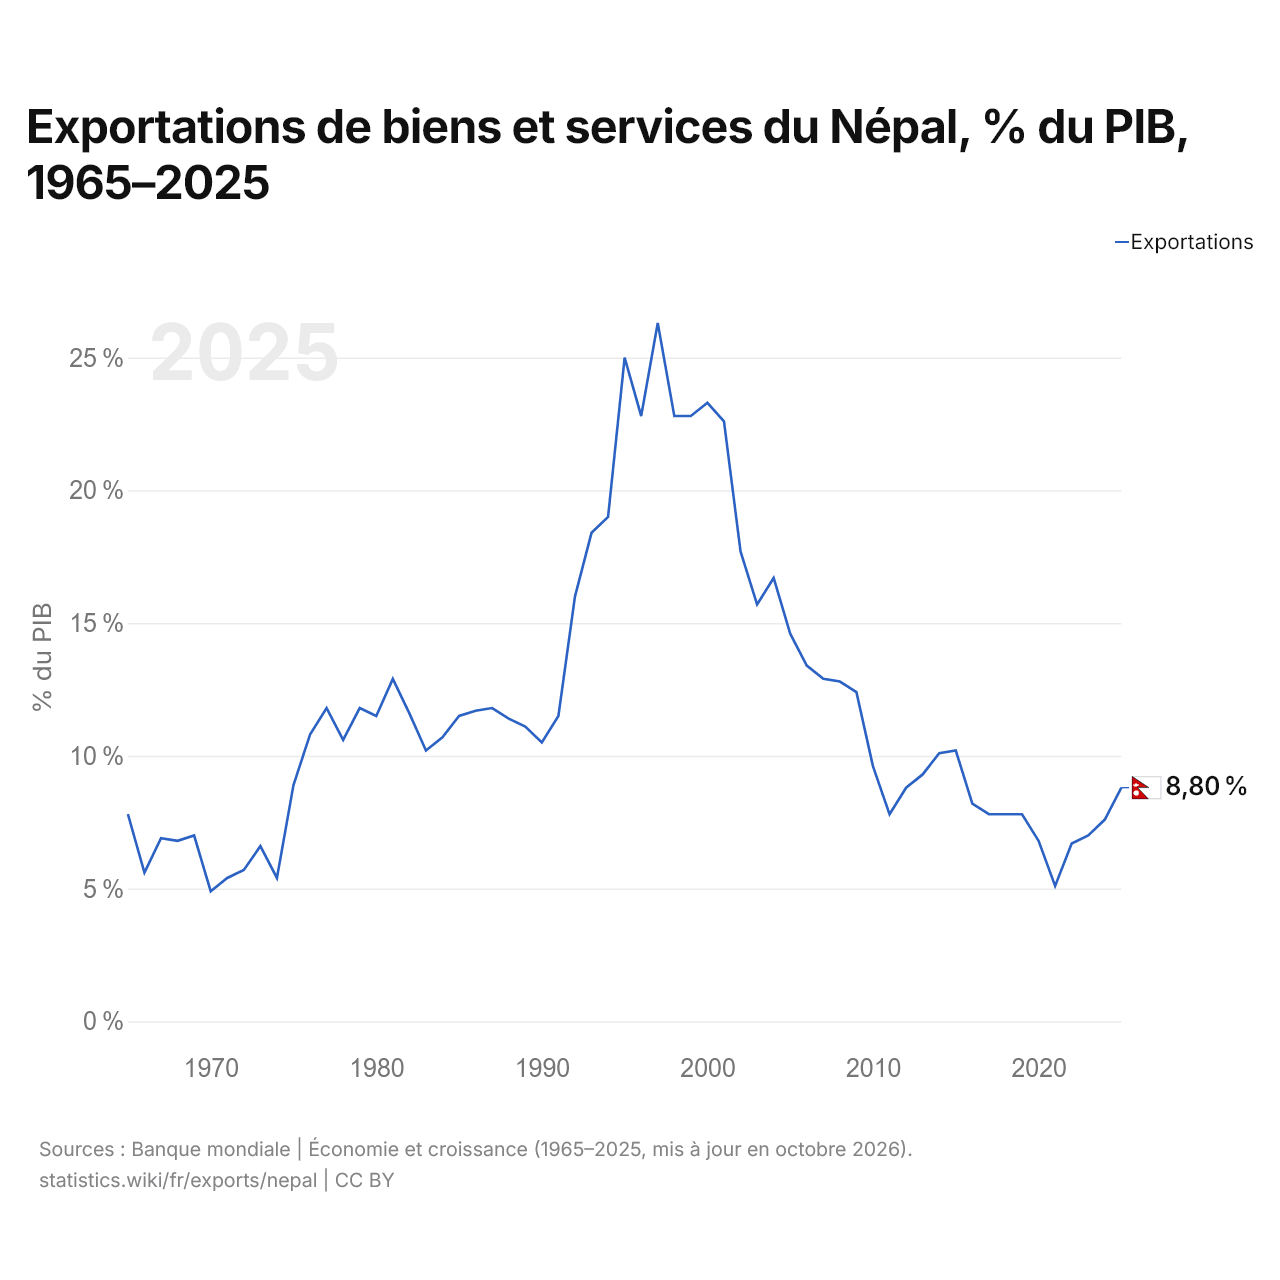
En 2025, les exportations de biens et services du Népal équivalaient à 8,8 % de son PIB, contre 7,8 % en 1965. La part la plus élevée a été de 26,3 %, en 1997.
Comparer les exportations du Népal avec celles d'autres pays
Sources :
- Banque mondiale | Économie et croissance (1965–2025, mis à jour en octobre 2026)
- TradeMap (2003–2022, mis à jour en octobre 2026)
Creative Commons Attribution (CC BY) : vous pouvez copier, partager, adapter et réutiliser ce contenu, y compris à des fins commerciales, à condition de citer statistics.wiki et d’indiquer les modifications apportées. Les sources citées ci-dessus peuvent avoir leurs propres conditions de licence.