
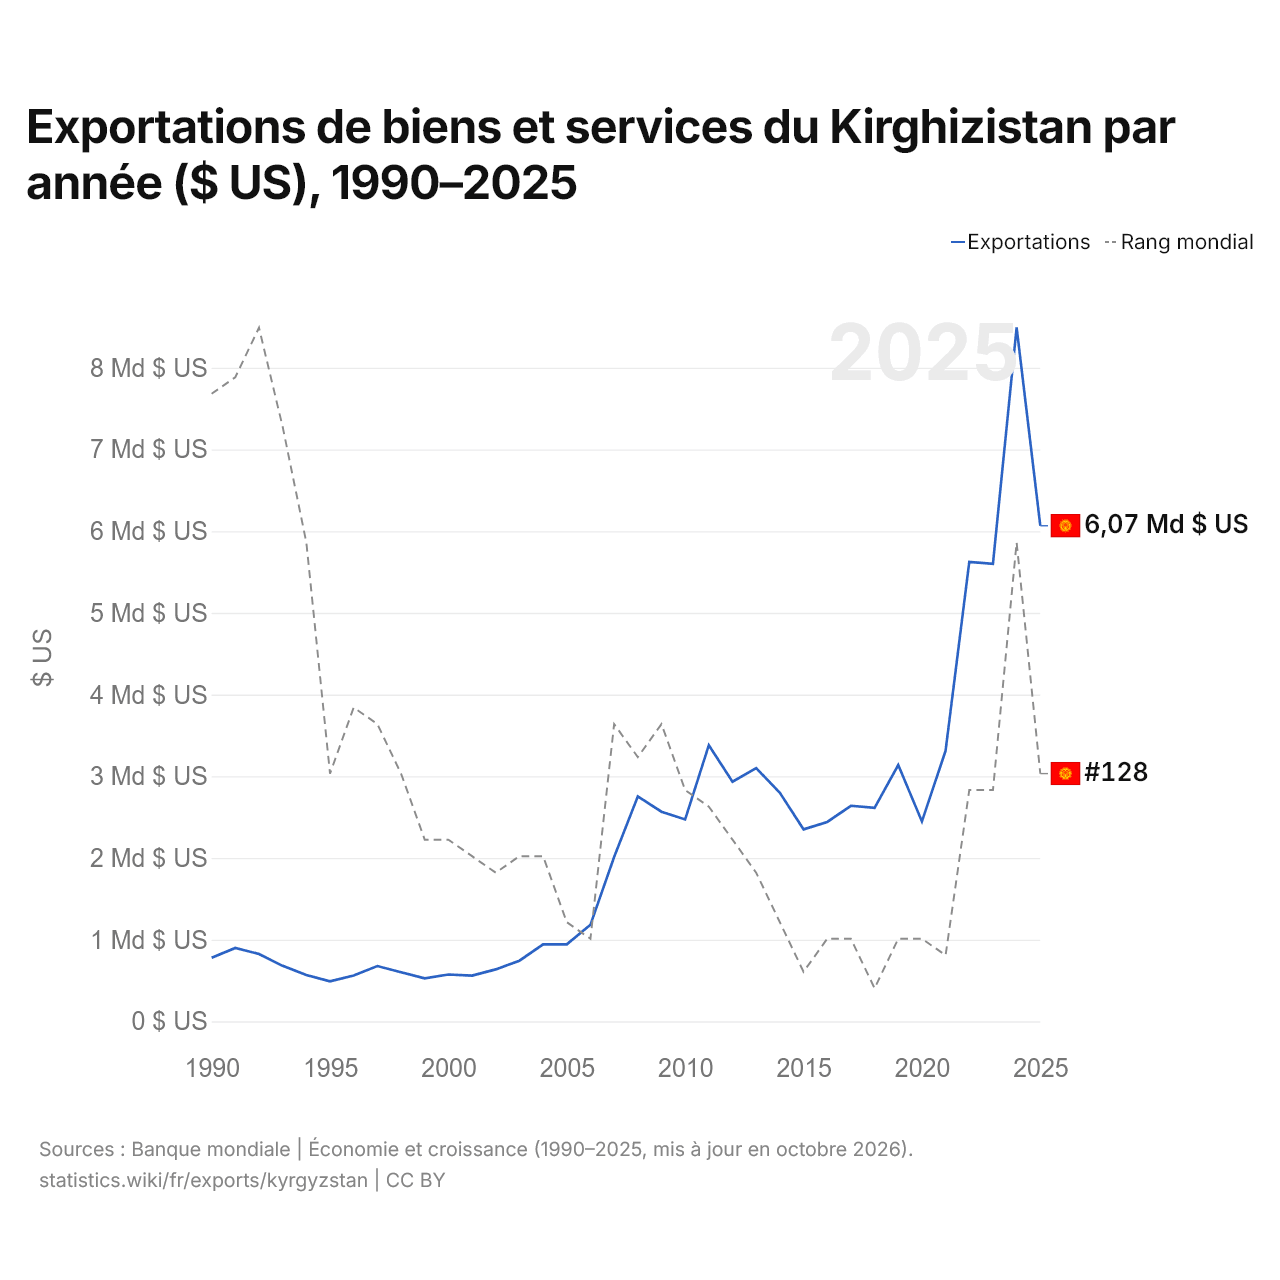
Exportations de biens et services du Kirghizistan par année ($ US), 1990–2025
| Année | $ US | Rang mondial |
|---|---|---|
| Exportations | Rang mondial | |
| 2025 | 6 065 757 632 $ US | #128 |
| 2024 | 8 494 384 868 $ US | #114 |
| 2023 | 5 599 943 025 $ US | #129 |
| 2022 | 5 622 995 972 $ US | #129 |
| 2021 | 3 311 706 968 $ US | #139 |
| 2020 | 2 446 559 920 $ US | #138 |
| 2019 | 3 137 172 121 $ US | #138 |
| 2018 | 2 613 812 661 $ US | #141 |
| 2017 | 2 638 475 264 $ US | #138 |
| 2016 | 2 440 819 277 $ US | #138 |
| 2015 | 2 350 023 986 $ US | #140 |
| 2014 | 2 796 703 653 $ US | #137 |
| 2013 | 3 099 063 074 $ US | #134 |
| 2012 | 2 932 960 921 $ US | #132 |
| 2011 | 3 380 167 186 $ US | #130 |
| 2010 | 2 471 700 785 $ US | #129 |
| 2009 | 2 565 386 046 $ US | #125 |
| 2008 | 2 752 394 340 $ US | #127 |
| 2007 | 2 012 053 353 $ US | #125 |
| 2006 | 1 182 432 651 $ US | #138 |
| 2005 | 942 411 214 $ US | #137 |
| 2004 | 941 138 692 $ US | #133 |
| 2003 | 742 293 894 $ US | #133 |
| 2002 | 635 535 283 $ US | #134 |
| 2001 | 560 092 477 $ US | #133 |
| 2000 | 573 185 350 $ US | #132 |
| 1999 | 527 140 642 $ US | #132 |
| 1998 | 600 501 762 $ US | #128 |
| 1997 | 676 860 147 $ US | #125 |
| 1996 | 561 760 456 $ US | #124 |
| 1995 | 489 492 603 $ US | #128 |
| 1994 | 567 799 729 $ US | #114 |
| 1993 | 679 350 396 $ US | #107 |
| 1992 | 823 942 430 $ US | #101 |
| 1991 | 898 722 001 $ US | #104 |
| 1990 | 776 928 336 $ US | #105 |
En 2025, les exportations de biens et services du Kirghizistan s'élevaient à 6,07 milliards de dollars, contre 777 millions de dollars en 1990. Le maximum a été de 8,49 milliards de dollars, en 2024. Elles se classaient au 128e rang mondial, en baisse par rapport au 114e rang en 2024. Leur meilleur rang a été le 101e, occupé pour la dernière fois en 1992.
En 2025, les exportations de biens et services du Kirghizistan étaient les 36es plus élevées de 44 pays situés en Asie. Les importations de biens et services du Kirghizistan s'élevaient à 14,8 milliards de dollars en 2025, au 104e rang mondial. En 2025, les importations du Kirghizistan dépassaient ses exportations de 8,77 milliards de dollars, soit un déficit commercial.
Exportations de biens du Kirghizistan par catégorie, 2025
Exportations de biens, 2025: 2,64 Md $US
En 2025, la première catégorie des exportations de biens du Kirghizistan était « pétrole, gaz, minerais et autres matières premières », avec 26,9 %, suivie de « métaux précieux, pierres précieuses, bijoux, montres, instruments de musique et art », avec 26,2 %.
Destinations des exportations de biens du Kirghizistan : les 10 premières, 2025
| Rang | Pays | Exportations de biens | Part | |
|---|---|---|---|---|
| 1 |
 Russie |
493 M $US | 18,7 % | |
| 2 |
 Suisse |
438 M $US | 16,6 % | |
| 3 |
 Kazakhstan |
417 M $US | 15,8 % | vs Kazakhstan |
| 4 |
 Ouzbékistan |
405 M $US | 15,4 % | |
| 5 |
 Royaume-Uni |
234 M $US | 8,85 % | |
| 6 |
 Chine |
152 M $US | 5,76 % | |
| 7 |
 EAU |
115 M $US | 4,36 % | |
| 8 |
 Turquie |
74,3 M $US | 2,82 % | |
| 9 |
 Iran |
36,3 M $US | 1,38 % | |
| 10 |
 Afghanistan |
29,2 M $US | 1,11 % | |
| Autres partenaires et non précisés | 244 M $US | 9,24 % |
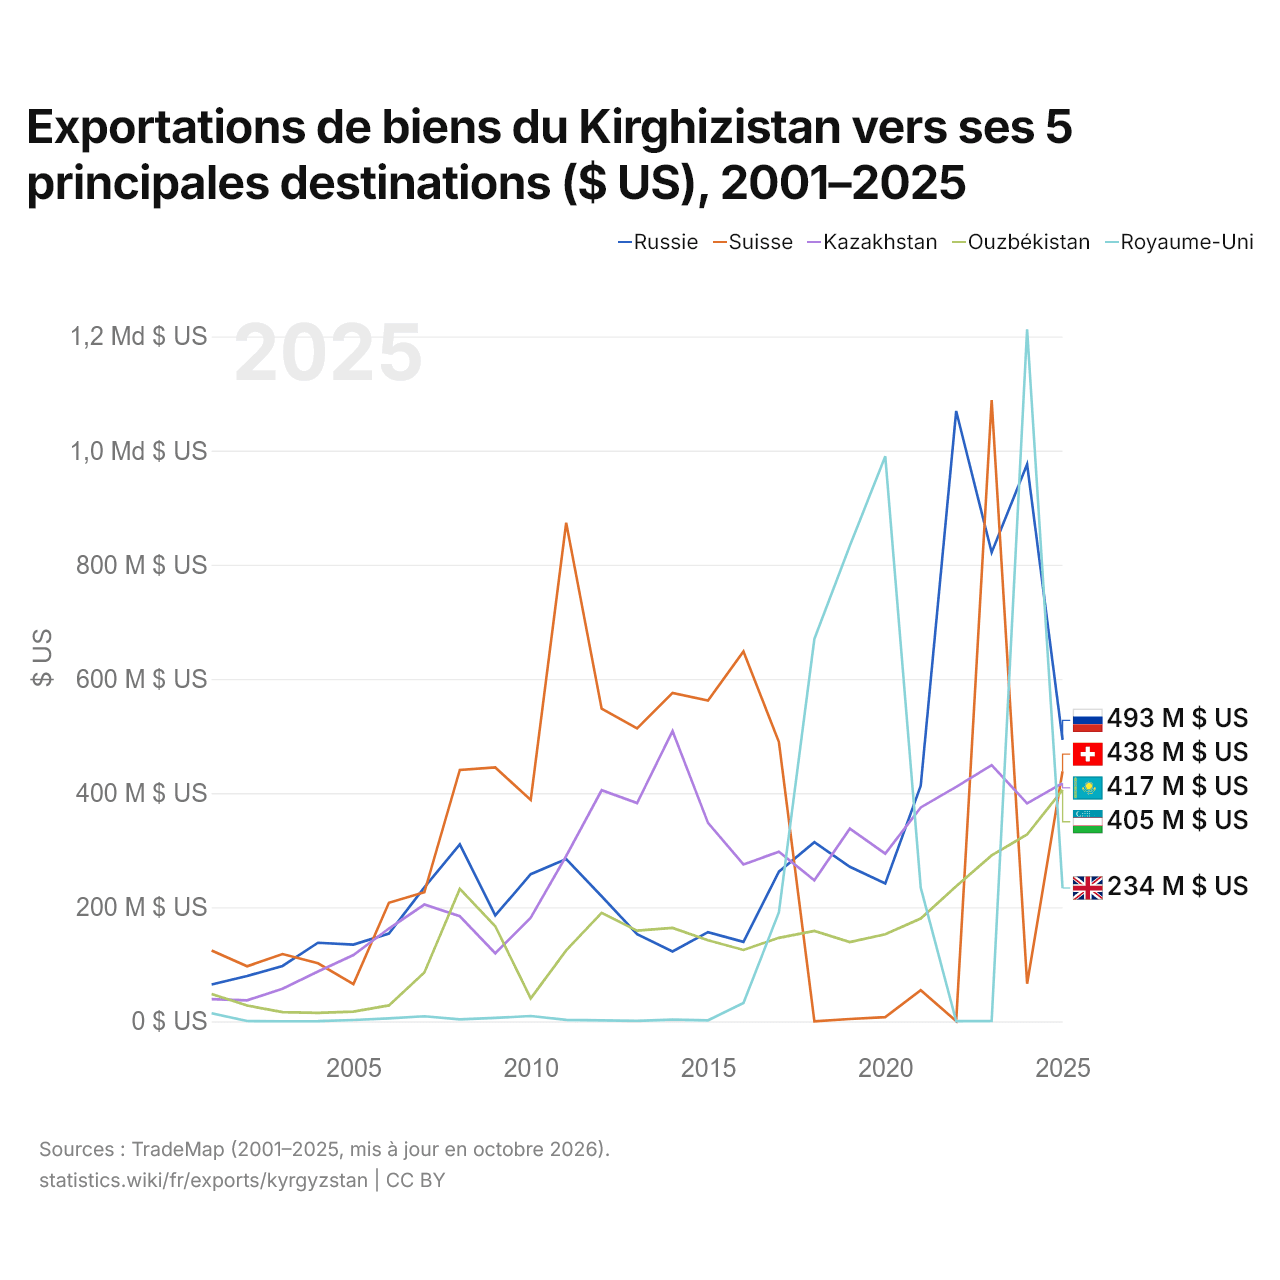
Exportations de biens du Kirghizistan vers ses 5 principales destinations ($ US), 2001–2025
| Année | $ US | ||||
|---|---|---|---|---|---|
| Russie | Suisse | Kazakhstan | Ouzbékistan | Royaume-Uni | |
| 2025 | 493 335 000 $ US | 438 241 000 $ US | 417 306 000 $ US | 405 413 000 $ US | 233 548 000 $ US |
| 2024 | 976 059 000 $ US | 65 883 000 $ US | 381 955 000 $ US | 327 315 000 $ US | 1 212 632 000 $ US |
| 2023 | 821 560 000 $ US | 1 088 560 000 $ US | 448 895 000 $ US | 290 679 000 $ US | 777 000 $ US |
| 2022 | 1 069 411 000 $ US | 447 000 $ US | 410 873 000 $ US | 236 627 000 $ US | 432 000 $ US |
| 2021 | 412 926 000 $ US | 54 567 000 $ US | 374 747 000 $ US | 180 143 000 $ US | 234 233 000 $ US |
| 2020 | 241 577 000 $ US | 7 402 000 $ US | 293 863 000 $ US | 152 549 000 $ US | 989 957 000 $ US |
| 2019 | 270 770 000 $ US | 4 097 000 $ US | 337 532 000 $ US | 138 880 000 $ US | 833 230 000 $ US |
| 2018 | 314 078 000 $ US | 164 000 $ US | 247 225 000 $ US | 158 500 000 $ US | 669 985 000 $ US |
| 2017 | 262 214 000 $ US | 489 263 000 $ US | 297 194 000 $ US | 146 285 000 $ US | 191 218 000 $ US |
| 2016 | 139 211 000 $ US | 648 020 000 $ US | 274 997 000 $ US | 125 074 000 $ US | 32 009 000 $ US |
| 2015 | 156 316 000 $ US | 562 114 000 $ US | 347 722 000 $ US | 142 011 000 $ US | 1 802 000 $ US |
| 2014 | 122 293 000 $ US | 575 608 000 $ US | 508 658 000 $ US | 163 698 000 $ US | 3 076 000 $ US |
| 2013 | 152 701 000 $ US | 513 197 000 $ US | 382 453 000 $ US | 159 011 000 $ US | 790 000 $ US |
| 2012 | 219 116 000 $ US | 547 900 000 $ US | 404 931 000 $ US | 190 128 000 $ US | 1 732 000 $ US |
| 2011 | 284 419 000 $ US | 873 636 000 $ US | 289 705 000 $ US | 124 437 000 $ US | 2 455 000 $ US |
| 2010 | 257 758 000 $ US | 387 890 000 $ US | 181 685 000 $ US | 40 174 000 $ US | 9 349 000 $ US |
| 2009 | 185 590 000 $ US | 444 827 000 $ US | 119 246 000 $ US | 166 610 000 $ US | 5 936 000 $ US |
| 2008 | 310 172 000 $ US | 440 477 000 $ US | 184 074 000 $ US | 232 107 000 $ US | 3 487 000 $ US |
| 2007 | 234 627 000 $ US | 226 129 000 $ US | 204 582 000 $ US | 85 672 000 $ US | 8 951 000 $ US |
| 2006 | 153 781 000 $ US | 207 699 000 $ US | 162 638 000 $ US | 27 856 000 $ US | 5 187 000 $ US |
| 2005 | 134 398 000 $ US | 65 273 000 $ US | 116 135 000 $ US | 17 095 000 $ US | 2 298 000 $ US |
| 2004 | 137 729 000 $ US | 101 761 000 $ US | 87 311 000 $ US | 14 691 000 $ US | 282 000 $ US |
| 2003 | 97 017 000 $ US | 117 869 000 $ US | 57 133 000 $ US | 16 259 000 $ US | 81 000 $ US |
| 2002 | 79 389 000 $ US | 96 373 000 $ US | 36 750 000 $ US | 27 741 000 $ US | 551 000 $ US |
| 2001 | 64 510 000 $ US | 124 189 000 $ US | 39 032 000 $ US | 47 998 000 $ US | 14 064 000 $ US |
En 2025, les exportations de biens s'élevaient à 493 millions de dollars vers la Russie, 438 millions de dollars vers la Suisse, 417 millions de dollars vers le Kazakhstan, 405 millions de dollars vers l'Ouzbékistan et 234 millions de dollars vers le Royaume-Uni. Le changement le plus récent dans leur ordre remonte à 2025, quand les exportations du Kirghizistan vers la Suisse ont dépassé celles vers le Kazakhstan.
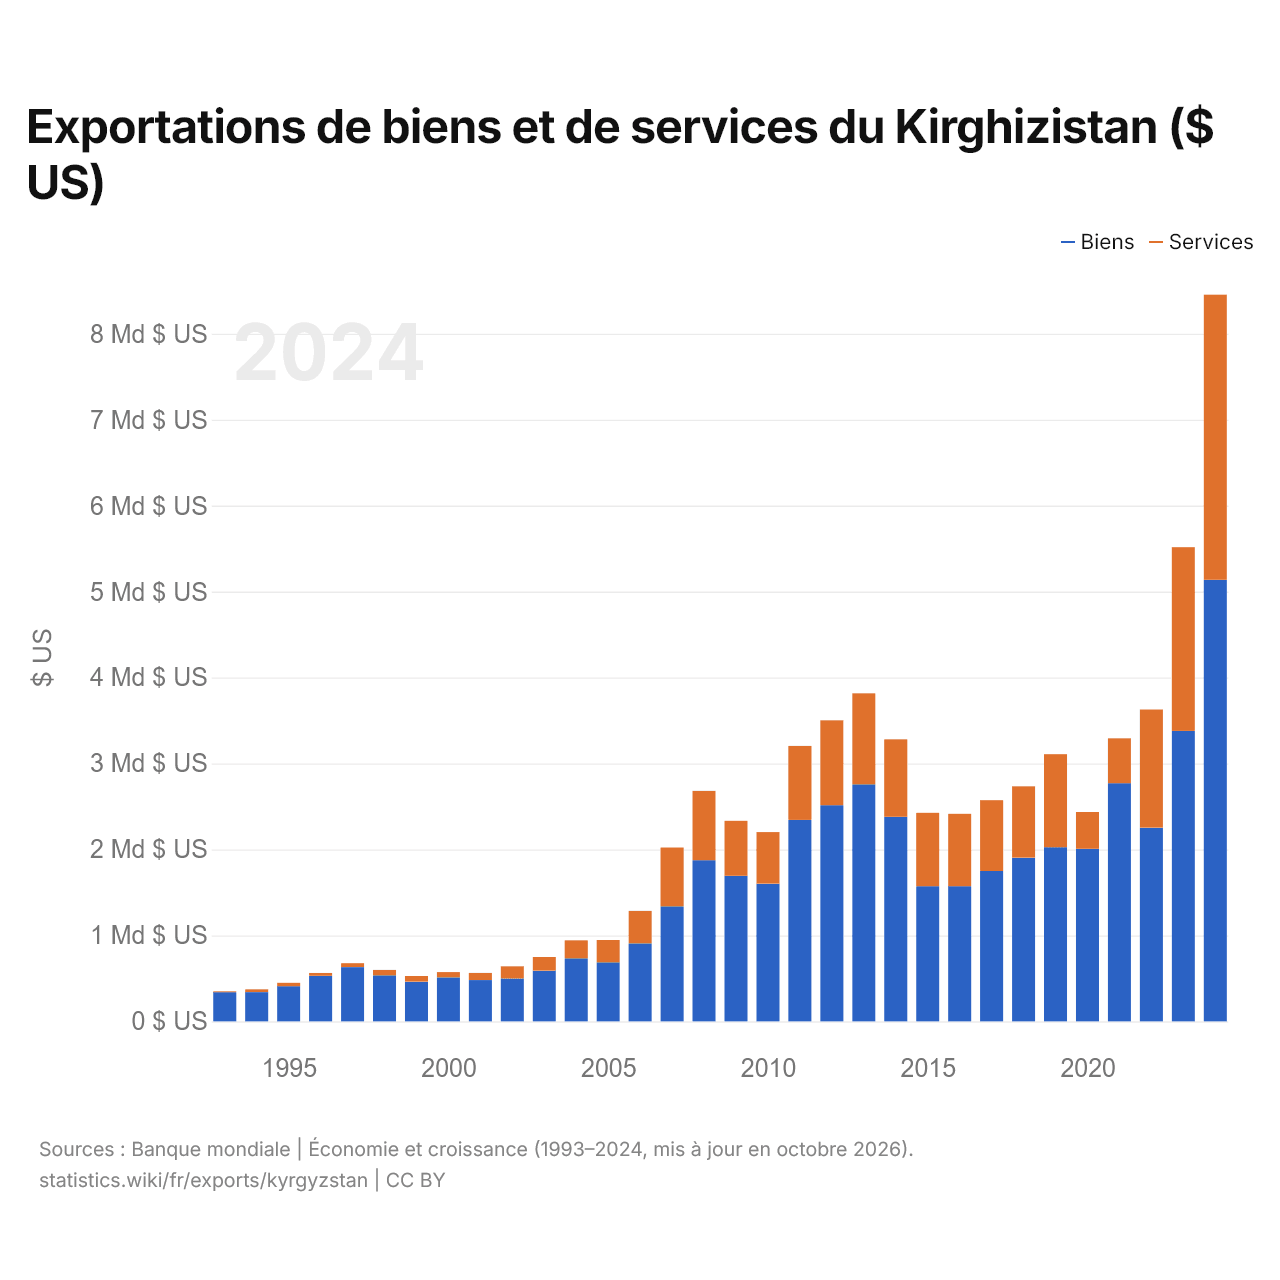
Exportations de biens et de services du Kirghizistan ($ US)
| Année | $ US | |
|---|---|---|
| Biens | Services | |
| 2024 | 5 136 188 405 $ US | 3 317 614 486 $ US |
| 2023 | 3 379 464 808 $ US | 2 137 028 286 $ US |
| 2022 | 2 253 345 533 $ US | 1 374 790 909 $ US |
| 2021 | 2 770 064 333 $ US | 521 809 863 $ US |
| 2020 | 2 007 177 693 $ US | 428 240 090 $ US |
| 2019 | 2 025 040 704 $ US | 1 082 659 258 $ US |
| 2018 | 1 904 511 151 $ US | 829 911 207 $ US |
| 2017 | 1 749 280 010 $ US | 823 760 000 $ US |
| 2016 | 1 572 558 203 $ US | 841 030 690 $ US |
| 2015 | 1 571 439 692 $ US | 853 583 903 $ US |
| 2014 | 2 380 088 035 $ US | 900 751 138 $ US |
| 2013 | 2 757 121 227 $ US | 1 058 553 560 $ US |
| 2012 | 2 514 741 195 $ US | 987 366 031 $ US |
| 2011 | 2 343 650 875 $ US | 860 249 971 $ US |
| 2010 | 1 601 821 438 $ US | 600 128 306 $ US |
| 2009 | 1 693 835 675 $ US | 638 178 686 $ US |
| 2008 | 1 874 366 598 $ US | 806 478 812 $ US |
| 2007 | 1 337 838 495 $ US | 684 767 486 $ US |
| 2006 | 905 995 142 $ US | 378 724 973 $ US |
| 2005 | 686 837 030 $ US | 259 416 411 $ US |
| 2004 | 733 182 155 $ US | 209 802 161 $ US |
| 2003 | 590 334 128 $ US | 158 188 111 $ US |
| 2002 | 498 087 037 $ US | 142 009 808 $ US |
| 2001 | 480 256 934 $ US | 82 779 426 $ US |
| 2000 | 510 921 779 $ US | 62 038 339 $ US |
| 1999 | 462 553 248 $ US | 64 949 122 $ US |
| 1998 | 535 066 205 $ US | 62 807 445 $ US |
| 1997 | 630 810 000 $ US | 45 000 000 $ US |
| 1996 | 531 180 000 $ US | 31 490 000 $ US |
| 1995 | 408 930 000 $ US | 39 152 000 $ US |
| 1994 | 339 961 000 $ US | 32 667 000 $ US |
| 1993 | 339 613 000 $ US | 8 685 000 $ US |
Les exportations de biens du Kirghizistan s'élèvent à 5,14 milliards de dollars (2024) et celles de services à 3,32 milliards de dollars ; les services représentent 39,2 % du total, contre 2,5 % en 1993.
Le Kirghizistan dans le classement mondial des exportations, 2025







Exportations de biens et services du Kirghizistan, % du PIB, 1990–2025
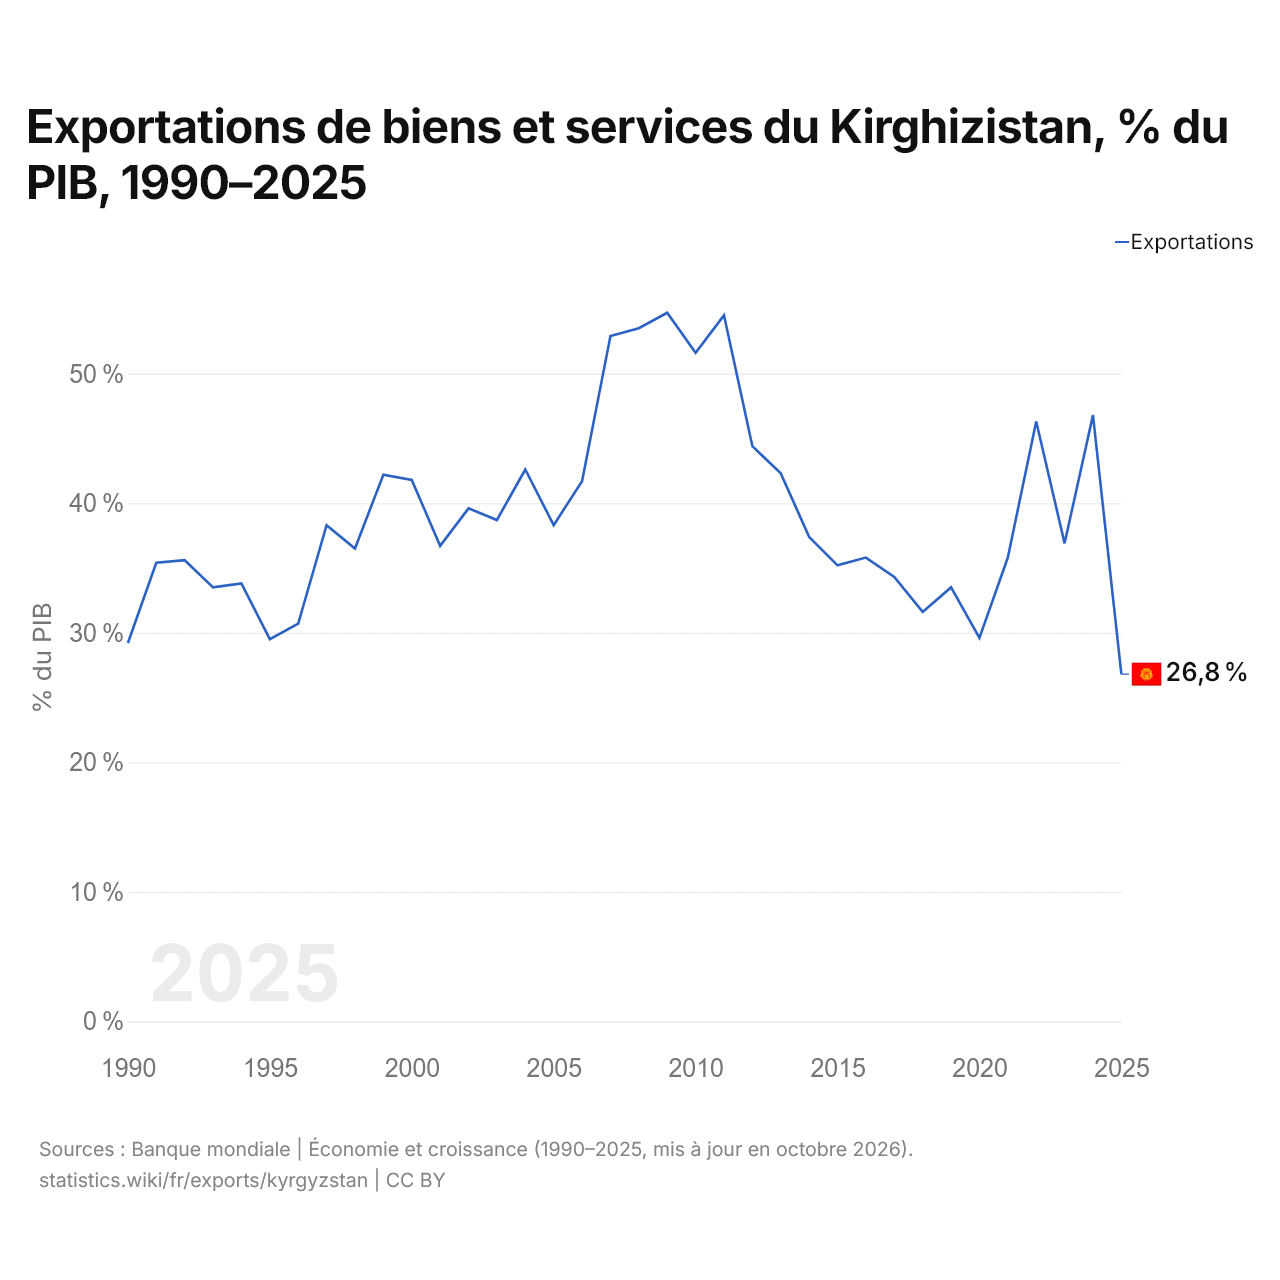
En 2025, les exportations de biens et services du Kirghizistan équivalaient à 26,8 % de son PIB, contre 29,2 % en 1990. La part la plus élevée a été de 54,7 %, en 2009.
Comparer les exportations du Kirghizistan avec celles d'autres pays
Sources :
- TradeMap (2001–2025, mis à jour en octobre 2026)
- Banque mondiale | Économie et croissance (1990–2025, mis à jour en octobre 2026)
Creative Commons Attribution (CC BY) : vous pouvez copier, partager, adapter et réutiliser ce contenu, y compris à des fins commerciales, à condition de citer statistics.wiki et d’indiquer les modifications apportées. Les sources citées ci-dessus peuvent avoir leurs propres conditions de licence.