
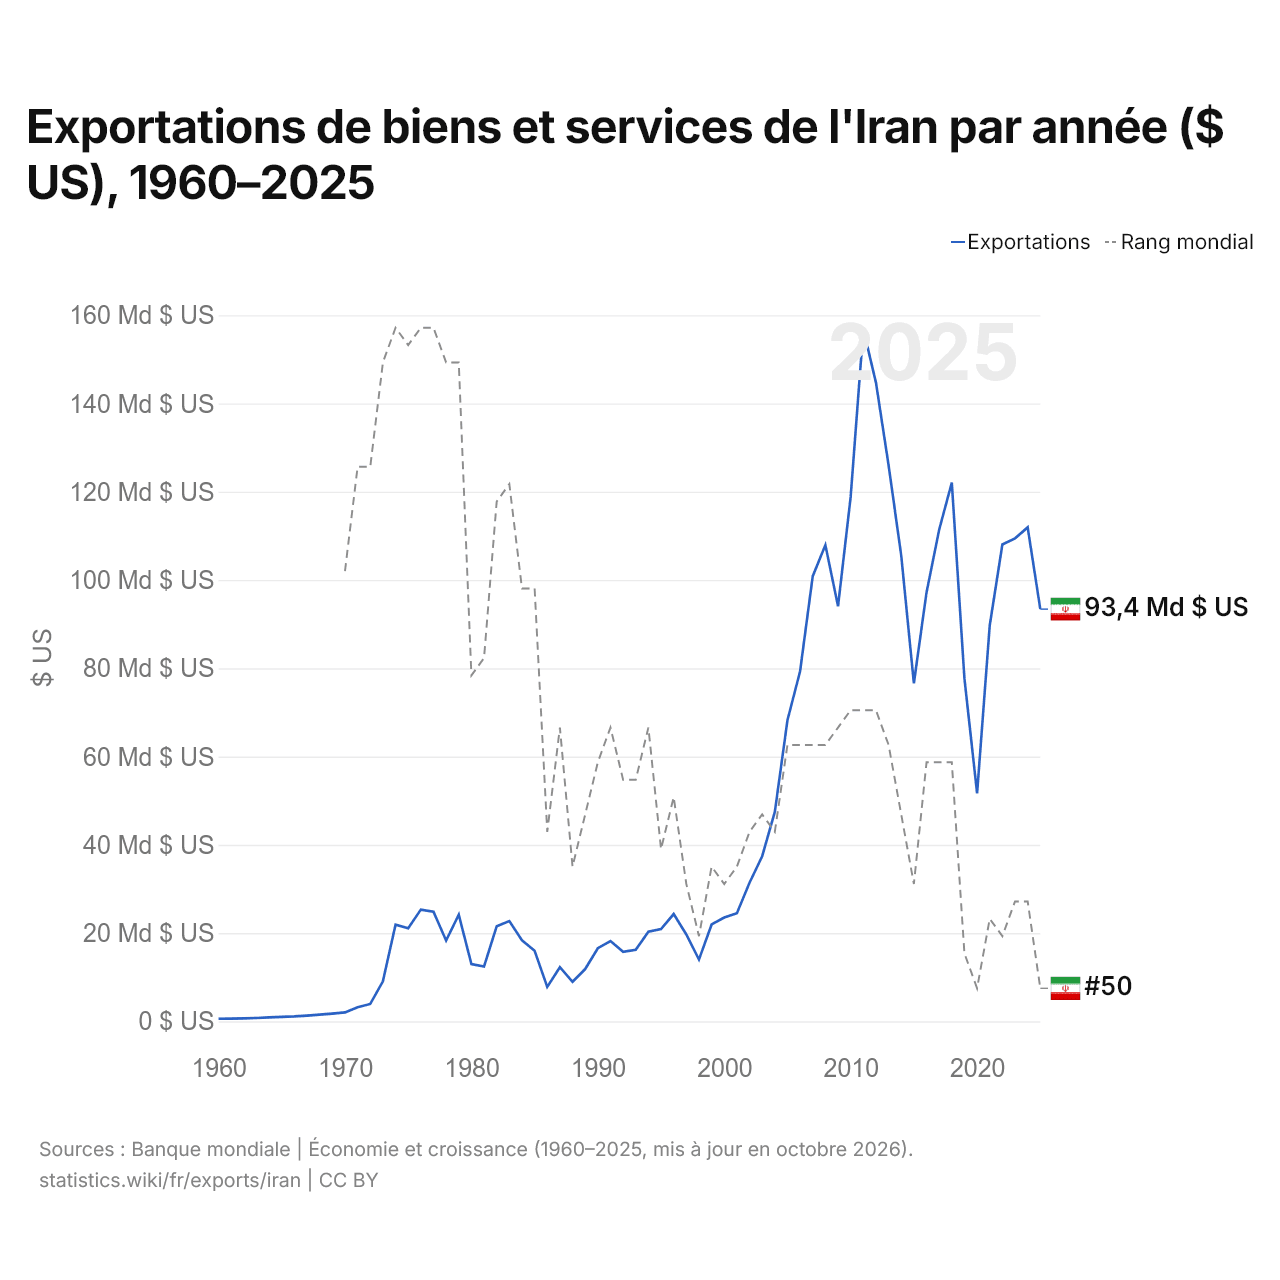
Exportations de biens et services de l'Iran par année ($ US), 1960–2025
| Année | $ US | Rang mondial |
|---|---|---|
| Exportations | Rang mondial | |
| 2025 | 93 406 513 015 $ US | #50 |
| 2024 | 111 928 863 188 $ US | #45 |
| 2023 | 109 444 045 104 $ US | #45 |
| 2022 | 108 060 448 022 $ US | #47 |
| 2021 | 89 695 394 080 $ US | #46 |
| 2020 | 51 664 876 276 $ US | #50 |
| 2019 | 77 652 596 277 $ US | #48 |
| 2018 | 122 086 879 298 $ US | #37 |
| 2017 | 111 400 323 837 $ US | #37 |
| 2016 | 97 206 283 743 $ US | #37 |
| 2015 | 76 604 098 445 $ US | #44 |
| 2014 | 105 542 726 659 $ US | #40 |
| 2013 | 126 015 225 004 $ US | #36 |
| 2012 | 144 745 274 388 $ US | #34 |
| 2011 | 156 851 049 079 $ US | #34 |
| 2010 | 118 843 286 440 $ US | #34 |
| 2009 | 94 038 986 374 $ US | #35 |
| 2008 | 107 921 993 809 $ US | #36 |
| 2007 | 100 876 666 988 $ US | #36 |
| 2006 | 79 332 810 982 $ US | #36 |
| 2005 | 68 235 356 550 $ US | #36 |
| 2004 | 47 439 812 814 $ US | #41 |
| 2003 | 37 411 894 955 $ US | #40 |
| 2002 | 31 402 849 783 $ US | #41 |
| 2001 | 24 491 811 634 $ US | #43 |
| 2000 | 23 526 115 003 $ US | #44 |
| 1999 | 21 963 669 399 $ US | #43 |
| 1998 | 13 986 840 980 $ US | #47 |
| 1997 | 19 682 874 298 $ US | #44 |
| 1996 | 24 315 730 858 $ US | #39 |
| 1995 | 20 900 063 457 $ US | #42 |
| 1994 | 20 321 213 941 $ US | #35 |
| 1993 | 16 197 325 831 $ US | #38 |
| 1992 | 15 767 057 949 $ US | #38 |
| 1991 | 18 198 012 421 $ US | #35 |
| 1990 | 16 573 631 050 $ US | #37 |
| 1989 | 11 841 502 482 $ US | #40 |
| 1988 | 8 964 962 592 $ US | #43 |
| 1987 | 12 271 835 670 $ US | #35 |
| 1986 | 7 802 605 539 $ US | #41 |
| 1985 | 16 006 784 597 $ US | #27 |
| 1984 | 18 359 078 550 $ US | #27 |
| 1983 | 22 725 836 920 $ US | #21 |
| 1982 | 21 524 982 663 $ US | #22 |
| 1981 | 12 431 487 009 $ US | #31 |
| 1980 | 12 961 626 484 $ US | #32 |
| 1979 | 24 176 515 151 $ US | #14 |
| 1978 | 18 308 804 923 $ US | #14 |
| 1977 | 24 821 052 417 $ US | #12 |
| 1976 | 25 319 975 896 $ US | #12 |
| 1975 | 21 091 425 211 $ US | #13 |
| 1974 | 21 889 677 077 $ US | #12 |
| 1973 | 9 056 140 484 $ US | #14 |
| 1972 | 3 936 283 736 $ US | #20 |
| 1971 | 3 172 763 667 $ US | #20 |
| 1970 | 2 026 823 485 $ US | #26 |
| 1969 | 1 756 492 441 $ US | - |
| 1968 | 1 507 260 406 $ US | - |
| 1967 | 1 306 819 827 $ US | - |
| 1966 | 1 106 379 248 $ US | - |
| 1965 | 1 000 884 206 $ US | - |
| 1964 | 882 202 285 $ US | - |
| 1963 | 755 608 235 $ US | - |
| 1962 | 680 443 018 $ US | - |
| 1961 | 607 915 177 $ US | - |
| 1960 | 581 541 416 $ US | - |
En 2025, les exportations de biens et services de l'Iran s'élevaient à 93,4 milliards de dollars, contre 582 millions de dollars en 1960. Le maximum a été de 157 milliards de dollars, en 2011. Elles se classaient au 50e rang mondial, en baisse par rapport au 45e rang en 2024. Leur meilleur rang a été le 12e, occupé pour la dernière fois en 1977.
En 2025, les exportations de biens et services de l'Iran étaient les 18es plus élevées de 44 pays situés en Asie. Les importations de biens et services de l'Iran s'élevaient à 125 milliards de dollars en 2025, au 44e rang mondial. En 2025, les importations de l'Iran dépassaient ses exportations de 31,7 milliards de dollars, soit un déficit commercial.
Exportations de biens de l'Iran par catégorie
Exportations de biens, 2023: 104 Md $US
La première catégorie des exportations de biens de l'Iran est « pétrole, gaz, minerais et autres matières premières », avec 72,9 %, suivie de « métaux communs (fer, acier, cuivre, aluminium) », avec 9,4 %.
Destinations des exportations de biens de l'Iran : les 10 premières
| Rang | Pays | Exportations de biens | Part | |
|---|---|---|---|---|
| 1 |
 Chine |
28,3 Md $US | 27,1 % | vs Chine |
| 2 |
 Irak |
12,0 Md $US | 11,5 % | vs Irak |
| 3 |
 Turquie |
7,07 Md $US | 6,76 % | vs Turquie |
| 4 |
 EAU |
6,09 Md $US | 5,83 % | vs EAU |
| 5 |
 Inde |
2,38 Md $US | 2,28 % | vs Inde |
| 6 |
 Pakistan |
1,97 Md $US | 1,89 % | vs Pakistan |
| 7 |
 Afghanistan |
1,76 Md $US | 1,69 % | vs Afghanistan |
| 8 |
 Oman |
1,23 Md $US | 1,18 % | vs Oman |
| 9 |
 Russie |
910 M $US | 0,87 % | vs Russie |
| 10 |
 Indonésie |
706 M $US | 0,68 % | vs Indonésie |
| Autres partenaires et non précisés | 42,0 Md $US | 40,2 % |
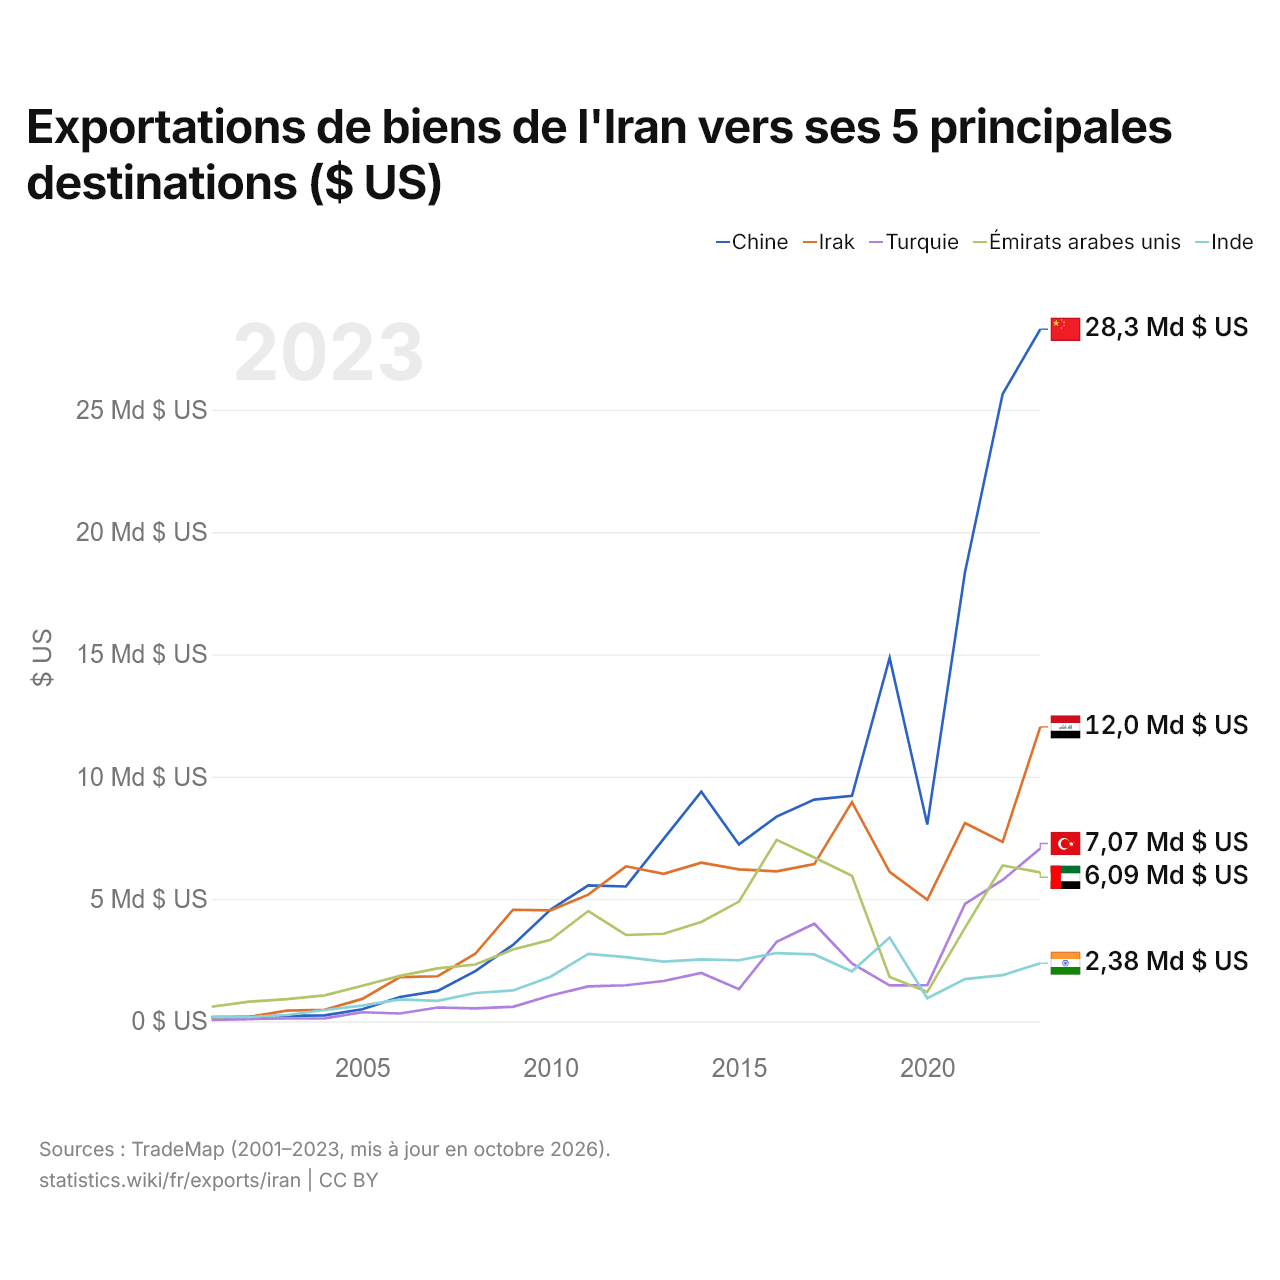
Exportations de biens de l'Iran vers ses 5 principales destinations ($ US)
| Année | $ US | ||||
|---|---|---|---|---|---|
| Chine | Irak | Turquie | Émirats arabes unis | Inde | |
| 2023 | 28 292 975 000 $ US | 12 035 368 000 $ US | 7 066 765 000 $ US | 6 091 343 000 $ US | 2 377 454 000 $ US |
| 2022 | 25 641 560 000 $ US | 7 335 136 000 $ US | 5 777 223 000 $ US | 6 372 760 000 $ US | 1 887 791 000 $ US |
| 2021 | 18 360 747 000 $ US | 8 108 151 000 $ US | 4 802 460 000 $ US | 3 821 388 000 $ US | 1 726 008 000 $ US |
| 2020 | 8 045 322 000 $ US | 4 967 722 000 $ US | 1 481 705 000 $ US | 1 201 088 000 $ US | 942 456 000 $ US |
| 2019 | 14 857 859 000 $ US | 6 107 353 000 $ US | 1 470 640 000 $ US | 1 809 086 000 $ US | 3 430 475 000 $ US |
| 2018 | 9 217 702 000 $ US | 8 960 694 000 $ US | 2 367 251 000 $ US | 5 949 220 000 $ US | 2 042 922 000 $ US |
| 2017 | 9 064 670 000 $ US | 6 425 016 000 $ US | 3 990 399 000 $ US | 6 696 657 000 $ US | 2 734 893 000 $ US |
| 2016 | 8 369 572 000 $ US | 6 131 482 000 $ US | 3 247 488 000 $ US | 7 417 422 000 $ US | 2 791 192 000 $ US |
| 2015 | 7 230 385 000 $ US | 6 214 059 000 $ US | 1 314 723 000 $ US | 4 894 456 000 $ US | 2 497 185 000 $ US |
| 2014 | 9 388 907 000 $ US | 6 484 527 000 $ US | 1 975 587 000 $ US | 4 063 537 000 $ US | 2 533 281 000 $ US |
| 2013 | 7 458 166 000 $ US | 6 027 845 000 $ US | 1 648 692 000 $ US | 3 581 871 000 $ US | 2 443 136 000 $ US |
| 2012 | 5 513 183 000 $ US | 6 336 997 000 $ US | 1 475 566 000 $ US | 3 529 801 000 $ US | 2 623 820 000 $ US |
| 2011 | 5 557 420 000 $ US | 5 179 199 000 $ US | 1 430 490 000 $ US | 4 508 955 000 $ US | 2 753 872 000 $ US |
| 2010 | 4 570 966 000 $ US | 4 538 605 000 $ US | 1 055 817 000 $ US | 3 335 558 000 $ US | 1 821 698 000 $ US |
| 2009 | 3 125 763 000 $ US | 4 559 908 000 $ US | 592 988 000 $ US | 2 934 016 000 $ US | 1 264 488 000 $ US |
| 2008 | 2 051 321 000 $ US | 2 761 873 000 $ US | 530 051 000 $ US | 2 322 137 000 $ US | 1 159 445 000 $ US |
| 2007 | 1 243 524 000 $ US | 1 841 948 000 $ US | 565 558 000 $ US | 2 165 983 000 $ US | 837 475 000 $ US |
| 2006 | 992 552 000 $ US | 1 809 385 000 $ US | 320 079 000 $ US | 1 858 834 000 $ US | 895 410 000 $ US |
| 2005 | 494 788 000 $ US | 917 630 000 $ US | 369 660 000 $ US | 1 453 424 000 $ US | 640 127 000 $ US |
| 2004 | 246 666 000 $ US | 474 030 000 $ US | 120 320 000 $ US | 1 061 398 000 $ US | 463 333 000 $ US |
| 2003 | 220 882 000 $ US | 437 594 000 $ US | 116 099 000 $ US | 910 178 000 $ US | 258 277 000 $ US |
| 2002 | 187 898 000 $ US | 184 115 000 $ US | 91 741 000 $ US | 805 523 000 $ US | 177 465 000 $ US |
| 2001 | 173 975 000 $ US | 143 023 000 $ US | 61 805 000 $ US | 597 221 000 $ US | 180 158 000 $ US |
Les exportations de biens s'élèvent à 28,3 milliards de dollars vers la Chine (2023), 12 milliards de dollars vers l'Irak (2023), 7,07 milliards de dollars vers la Turquie (2023), 6,09 milliards de dollars vers les Émirats arabes unis (2023) et 2,38 milliards de dollars vers l'Inde (2023). Le premier rang des cinq destinations de l'Iran est occupé par la Chine depuis 2013. Le changement le plus récent dans leur ordre remonte à 2023, quand les exportations de l'Iran vers la Turquie ont dépassé celles vers les Émirats arabes unis.
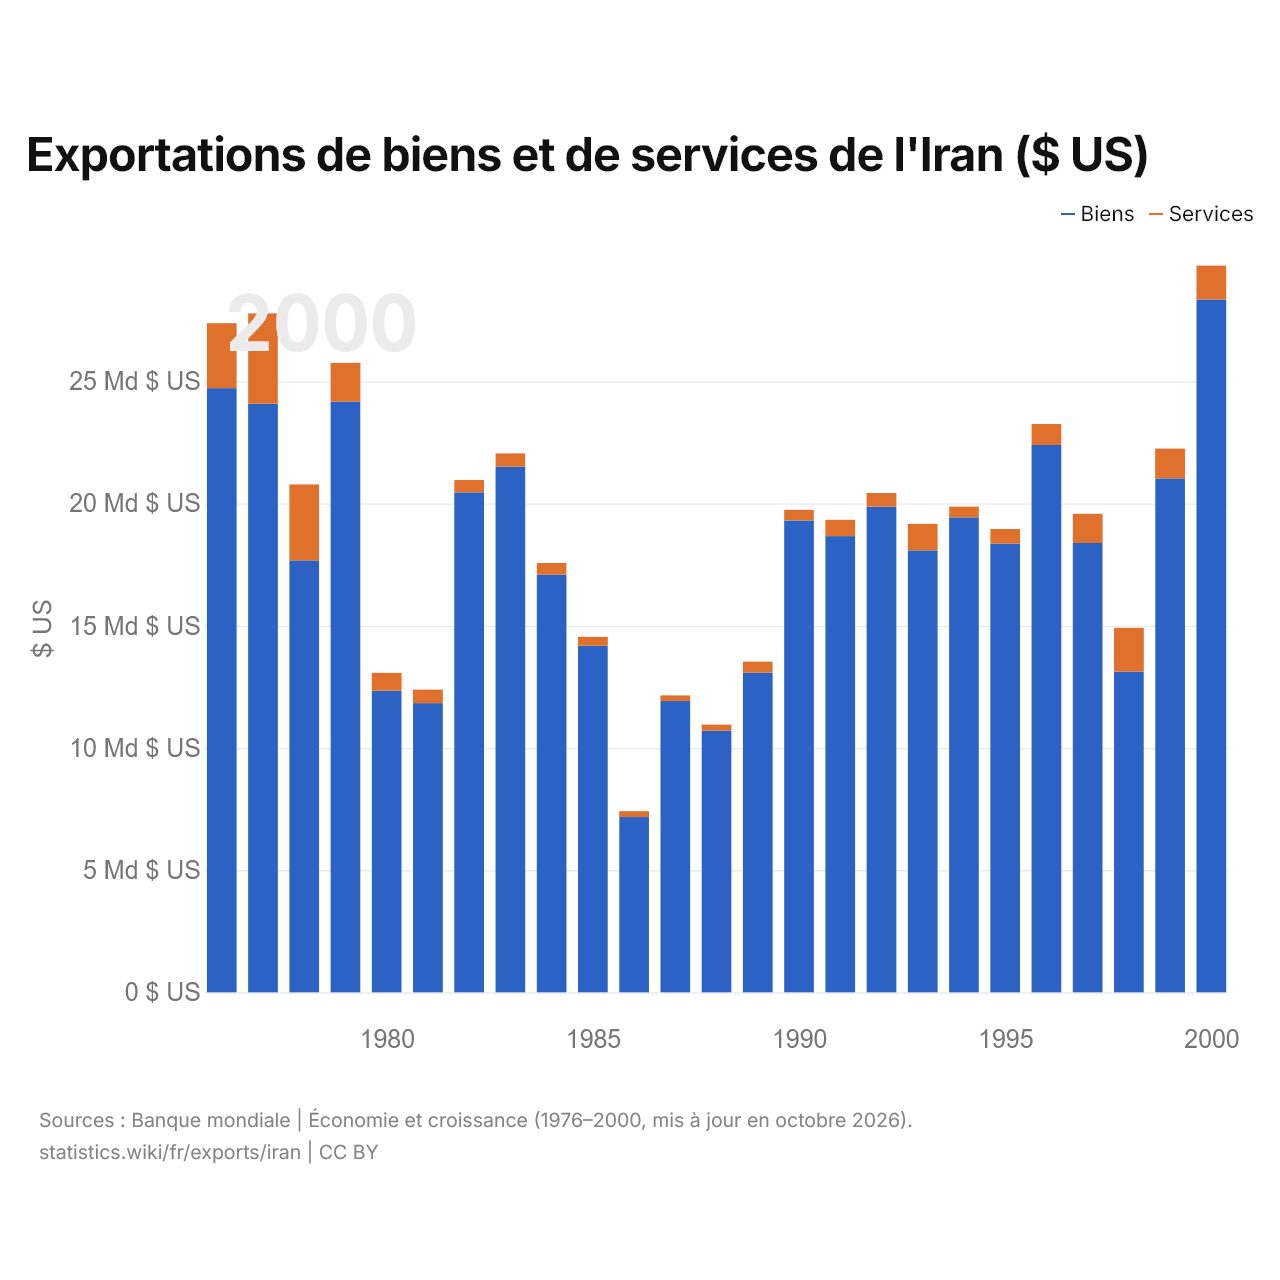
Exportations de biens et de services de l'Iran ($ US)
| Année | $ US | |
|---|---|---|
| Biens | Services | |
| 2000 | 28 345 000 000 $ US | 1 382 000 000 $ US |
| 1999 | 21 030 000 000 $ US | 1 216 000 000 $ US |
| 1998 | 13 118 000 000 $ US | 1 793 000 000 $ US |
| 1997 | 18 381 000 000 $ US | 1 192 000 000 $ US |
| 1996 | 22 391 000 000 $ US | 860 000 000 $ US |
| 1995 | 18 360 000 000 $ US | 593 000 000 $ US |
| 1994 | 19 434 000 000 $ US | 438 000 000 $ US |
| 1993 | 18 080 000 000 $ US | 1 084 000 000 $ US |
| 1992 | 19 868 000 000 $ US | 559 000 000 $ US |
| 1991 | 18 661 000 000 $ US | 668 000 000 $ US |
| 1990 | 19 305 000 000 $ US | 436 000 000 $ US |
| 1989 | 13 081 000 000 $ US | 446 000 000 $ US |
| 1988 | 10 709 000 000 $ US | 244 000 000 $ US |
| 1987 | 11 916 000 000 $ US | 231 000 000 $ US |
| 1986 | 7 171 000 000 $ US | 242 000 000 $ US |
| 1985 | 14 175 000 000 $ US | 370 000 000 $ US |
| 1984 | 17 087 000 000 $ US | 475 000 000 $ US |
| 1983 | 21 507 000 000 $ US | 540 000 000 $ US |
| 1982 | 20 452 000 000 $ US | 509 000 000 $ US |
| 1981 | 11 831 000 000 $ US | 556 000 000 $ US |
| 1980 | 12 338 000 000 $ US | 731 000 000 $ US |
| 1979 | 24 171 000 000 $ US | 1 580 000 000 $ US |
| 1978 | 17 675 000 000 $ US | 3 104 000 000 $ US |
| 1977 | 24 076 000 000 $ US | 3 699 000 000 $ US |
| 1976 | 24 719 000 000 $ US | 2 651 000 000 $ US |
Les exportations de biens de l'Iran s'élèvent à 28,3 milliards de dollars (2000) et celles de services à 1,38 milliard de dollars ; les services représentent 4,6 % du total, contre 9,7 % en 1976.
L'Iran dans le classement mondial des exportations, 2025
| Rang | Pays | Exportations | Part mondiale | |
|---|---|---|---|---|
| 47 |
 Argentine |
106 Md $US | 0,3 % | vs Argentine |
| 48 |
Irak
|
103 Md $US | 0,29 % | vs Irak |
| 49 |
 Pérou |
100 Md $US | 0,29 % | |
| 50 |
 Iran |
93,4 Md $US | 0,27 % | |
| 51 |
 Kazakhstan |
92,1 Md $US (2024) | 0,28 % | vs Kazakhstan |
| 52 |
 Koweït |
83,4 Md $US | 0,24 % | vs Koweït |
| 53 |
 Maroc |
76,5 Md $US | 0,22 % | vs Maroc |
Exportations de biens et services de l'Iran, % du PIB, 1960–2025
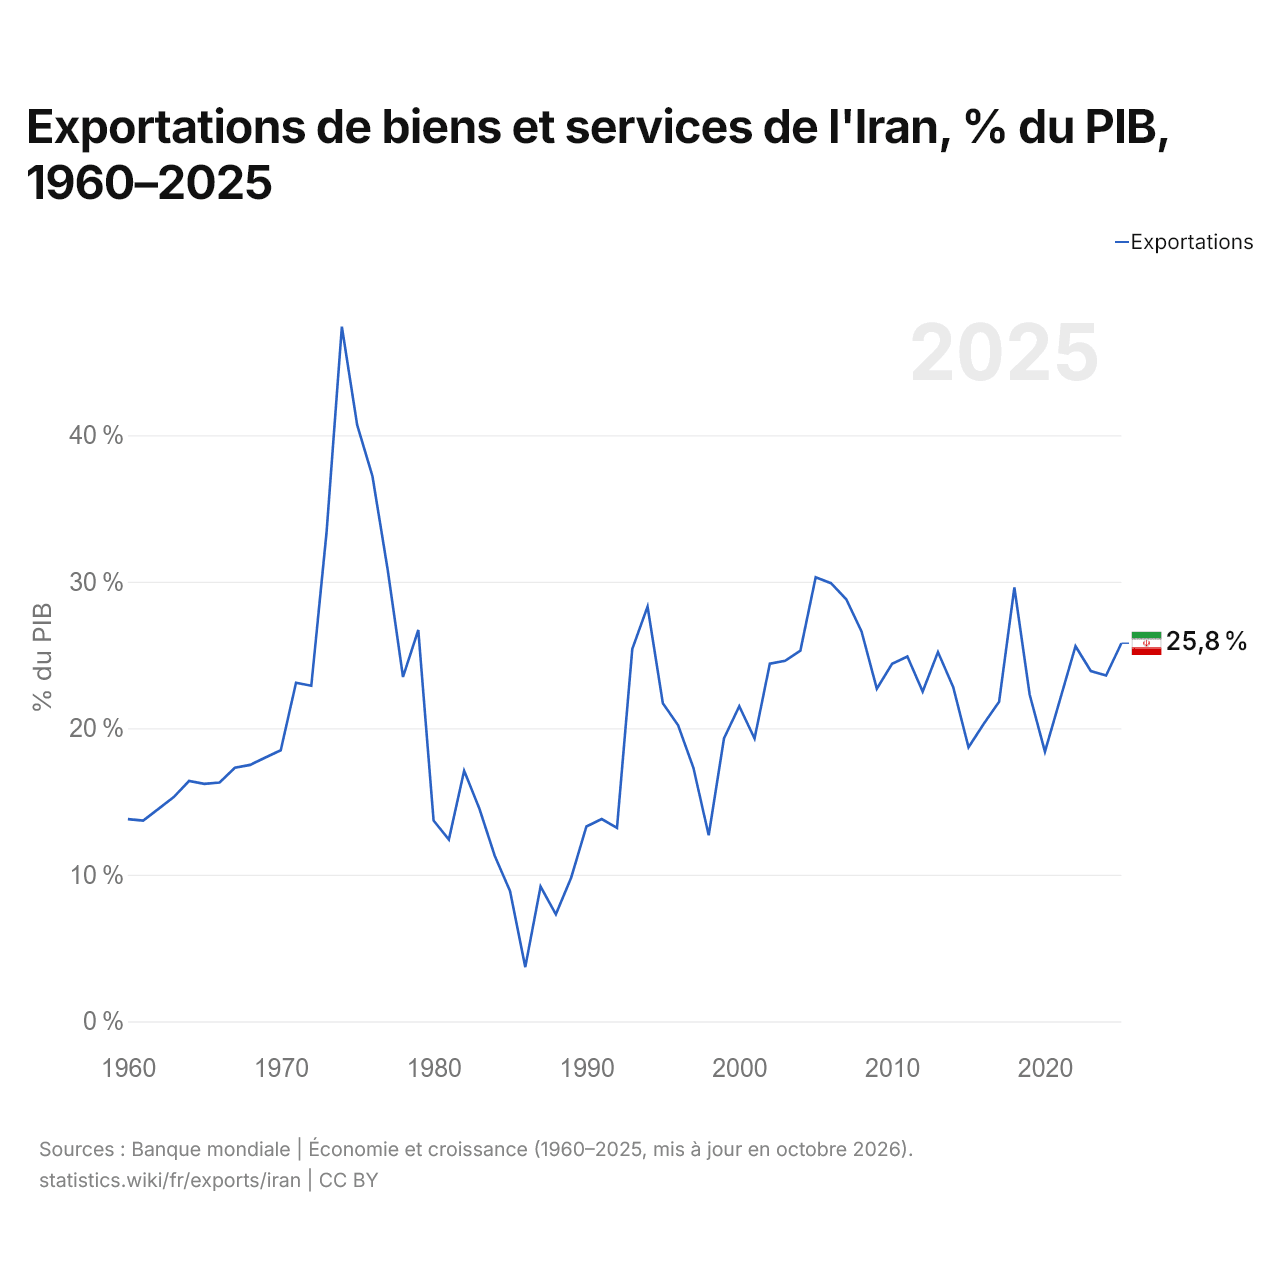
En 2025, les exportations de biens et services de l'Iran équivalaient à 25,8 % de son PIB, contre 13,8 % en 1960. La part la plus élevée a été de 47,4 %, en 1974.
Comparer les exportations de l'Iran avec celles d'autres pays
Sources :
- TradeMap (2001–2023, mis à jour en octobre 2026)
- Banque mondiale | Économie et croissance (1960–2025, mis à jour en octobre 2026)
Creative Commons Attribution (CC BY) : vous pouvez copier, partager, adapter et réutiliser ce contenu, y compris à des fins commerciales, à condition de citer statistics.wiki et d’indiquer les modifications apportées. Les sources citées ci-dessus peuvent avoir leurs propres conditions de licence.