
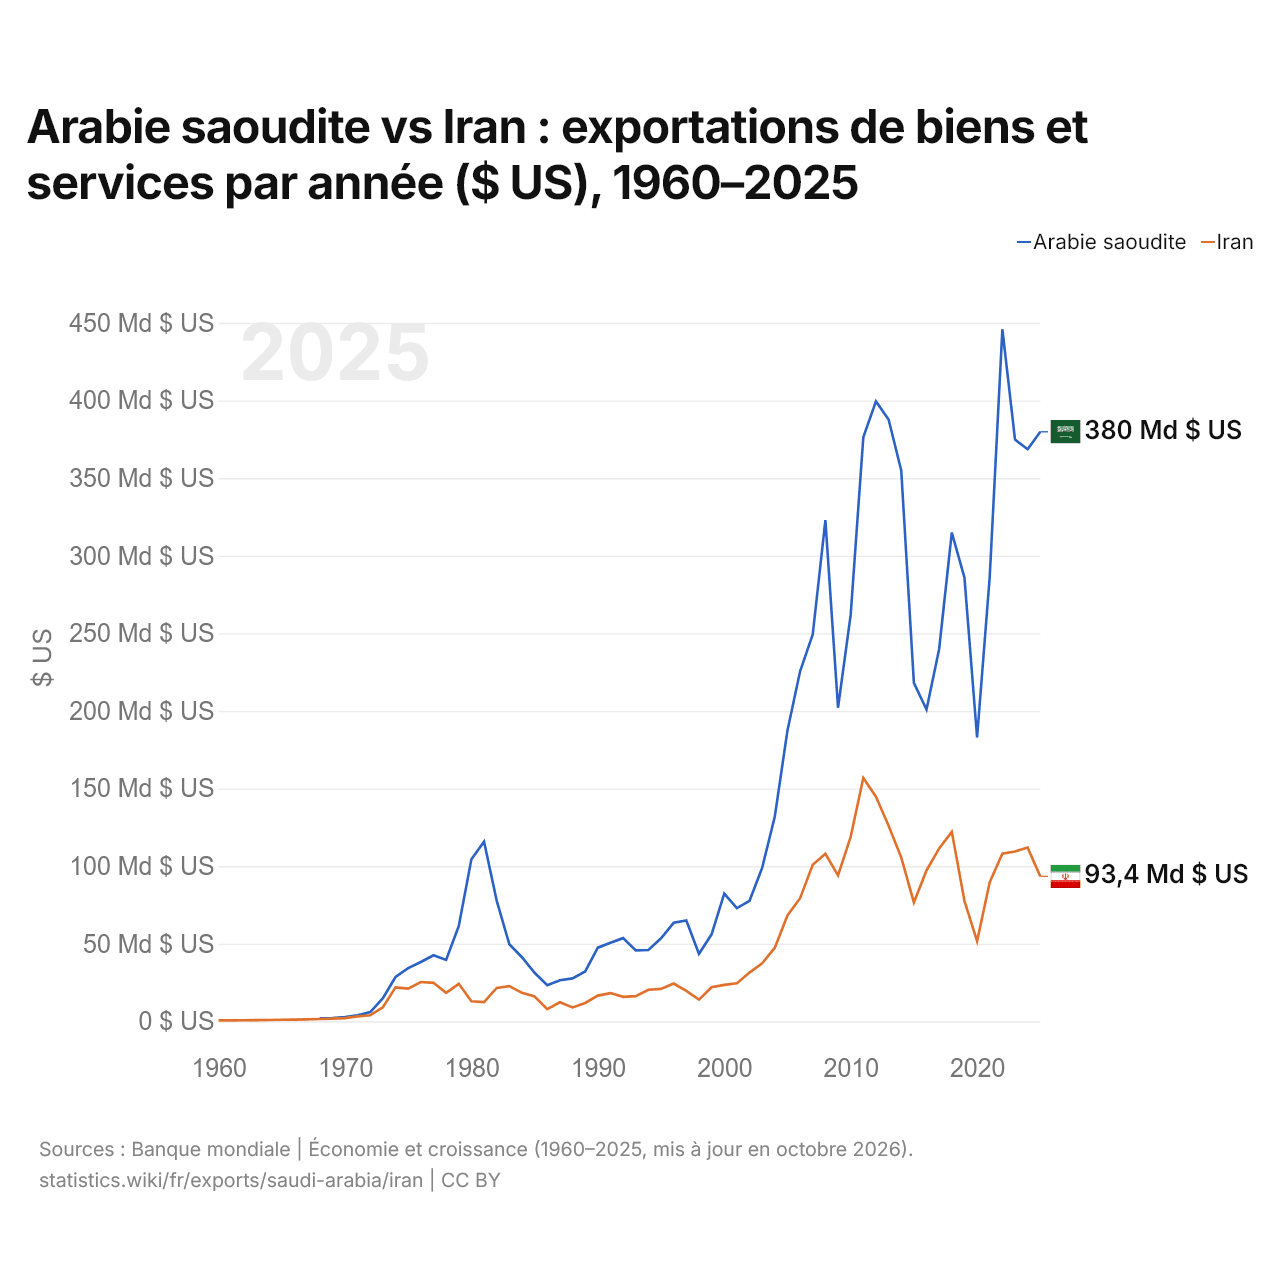
Arabie saoudite vs Iran : exportations de biens et services par année ($ US), 1960–2025
| Année | $ US | |
|---|---|---|
 Arabie saoudite |
 Iran |
|
| 2025 | 379 825 066 667 $ US | 93 406 513 015 $ US |
| 2024 | 368 566 933 333 $ US | 111 928 863 188 $ US |
| 2023 | 374 787 466 667 $ US | 109 444 045 104 $ US |
| 2022 | 445 881 333 333 $ US | 108 060 448 022 $ US |
| 2021 | 286 501 333 333 $ US | 89 695 394 080 $ US |
| 2020 | 182 847 733 333 $ US | 51 664 876 276 $ US |
| 2019 | 285 860 000 000 $ US | 77 652 596 277 $ US |
| 2018 | 314 916 533 333 $ US | 122 086 879 298 $ US |
| 2017 | 239 892 533 333 $ US | 111 400 323 837 $ US |
| 2016 | 200 877 333 333 $ US | 97 206 283 743 $ US |
| 2015 | 218 010 400 000 $ US | 76 604 098 445 $ US |
| 2014 | 354 973 333 333 $ US | 105 542 726 659 $ US |
| 2013 | 387 745 333 333 $ US | 126 015 225 004 $ US |
| 2012 | 399 419 466 667 $ US | 144 745 274 388 $ US |
| 2011 | 376 224 000 000 $ US | 156 851 049 079 $ US |
| 2010 | 261 830 933 333 $ US | 118 843 286 440 $ US |
| 2009 | 202 056 266 667 $ US | 94 038 986 374 $ US |
| 2008 | 322 853 600 000 $ US | 107 921 993 809 $ US |
| 2007 | 249 318 478 986 $ US | 100 876 666 988 $ US |
| 2006 | 225 506 542 056 $ US | 79 332 810 982 $ US |
| 2005 | 187 388 647 221 $ US | 68 235 356 550 $ US |
| 2004 | 131 920 533 333 $ US | 47 439 812 814 $ US |
| 2003 | 98 956 800 000 $ US | 37 411 894 955 $ US |
| 2002 | 77 641 333 333 $ US | 31 402 849 783 $ US |
| 2001 | 72 980 533 333 $ US | 24 491 811 634 $ US |
| 2000 | 82 259 466 667 $ US | 23 526 115 003 $ US |
| 1999 | 56 061 600 000 $ US | 21 963 669 399 $ US |
| 1998 | 43 493 066 667 $ US | 13 986 840 980 $ US |
| 1997 | 64 989 052 069 $ US | 19 682 874 298 $ US |
| 1996 | 63 501 201 602 $ US | 24 315 730 858 $ US |
| 1995 | 53 521 228 304 $ US | 20 900 063 457 $ US |
| 1994 | 45 960 747 664 $ US | 20 321 213 941 $ US |
| 1993 | 45 678 237 650 $ US | 16 197 325 831 $ US |
| 1992 | 53 610 680 908 $ US | 15 767 057 949 $ US |
| 1991 | 50 652 603 471 $ US | 18 198 012 421 $ US |
| 1990 | 47 445 927 904 $ US | 16 573 631 050 $ US |
| 1989 | 32 174 632 844 $ US | 11 841 502 482 $ US |
| 1988 | 27 645 126 836 $ US | 8 964 962 592 $ US |
| 1987 | 26 447 263 017 $ US | 12 271 835 670 $ US |
| 1986 | 23 221 442 074 $ US | 7 802 605 539 $ US |
| 1985 | 31 243 235 781 $ US | 16 006 784 597 $ US |
| 1984 | 41 296 821 793 $ US | 18 359 078 550 $ US |
| 1983 | 49 690 593 343 $ US | 22 725 836 920 $ US |
| 1982 | 77 741 454 554 $ US | 21 524 982 663 $ US |
| 1981 | 115 769 423 162 $ US | 12 431 487 009 $ US |
| 1980 | 104 409 960 255 $ US | 12 961 626 484 $ US |
| 1979 | 61 361 500 126 $ US | 24 176 515 151 $ US |
| 1978 | 39 584 805 337 $ US | 18 308 804 923 $ US |
| 1977 | 42 599 781 848 $ US | 24 821 052 417 $ US |
| 1976 | 38 230 311 615 $ US | 25 319 975 896 $ US |
| 1975 | 34 300 542 527 $ US | 21 091 425 211 $ US |
| 1974 | 28 581 126 761 $ US | 21 889 677 077 $ US |
| 1973 | 14 903 189 968 $ US | 9 056 140 484 $ US |
| 1972 | 5 951 621 243 $ US | 3 936 283 736 $ US |
| 1971 | 3 878 685 816 $ US | 3 172 763 667 $ US |
| 1970 | 2 731 777 778 $ US | 2 026 823 485 $ US |
| 1969 | 2 161 704 511 $ US | 1 756 492 441 $ US |
| 1968 | 1 998 980 667 $ US | 1 507 260 406 $ US |
| 1967 | - | 1 306 819 827 $ US |
| 1966 | - | 1 106 379 248 $ US |
| 1965 | - | 1 000 884 206 $ US |
| 1964 | - | 882 202 285 $ US |
| 1963 | - | 755 608 235 $ US |
| 1962 | - | 680 443 018 $ US |
| 1961 | - | 607 915 177 $ US |
| 1960 | - | 581 541 416 $ US |
En 2025, les exportations de biens et services de l'Arabie saoudite s'élevaient à 380 milliards de dollars et celles de l'Iran à 93,4 milliards de dollars : celles de l'Arabie saoudite étaient 4,1 fois plus élevées. En 1968, les exportations de l'Arabie saoudite étaient supérieures de 33 % : 2 milliards de dollars pour l'Arabie saoudite et 1,51 milliard de dollars pour l'Iran.
Les exportations de biens et services de l'Arabie saoudite sont supérieures à celles de l'Iran chaque année depuis 1968.
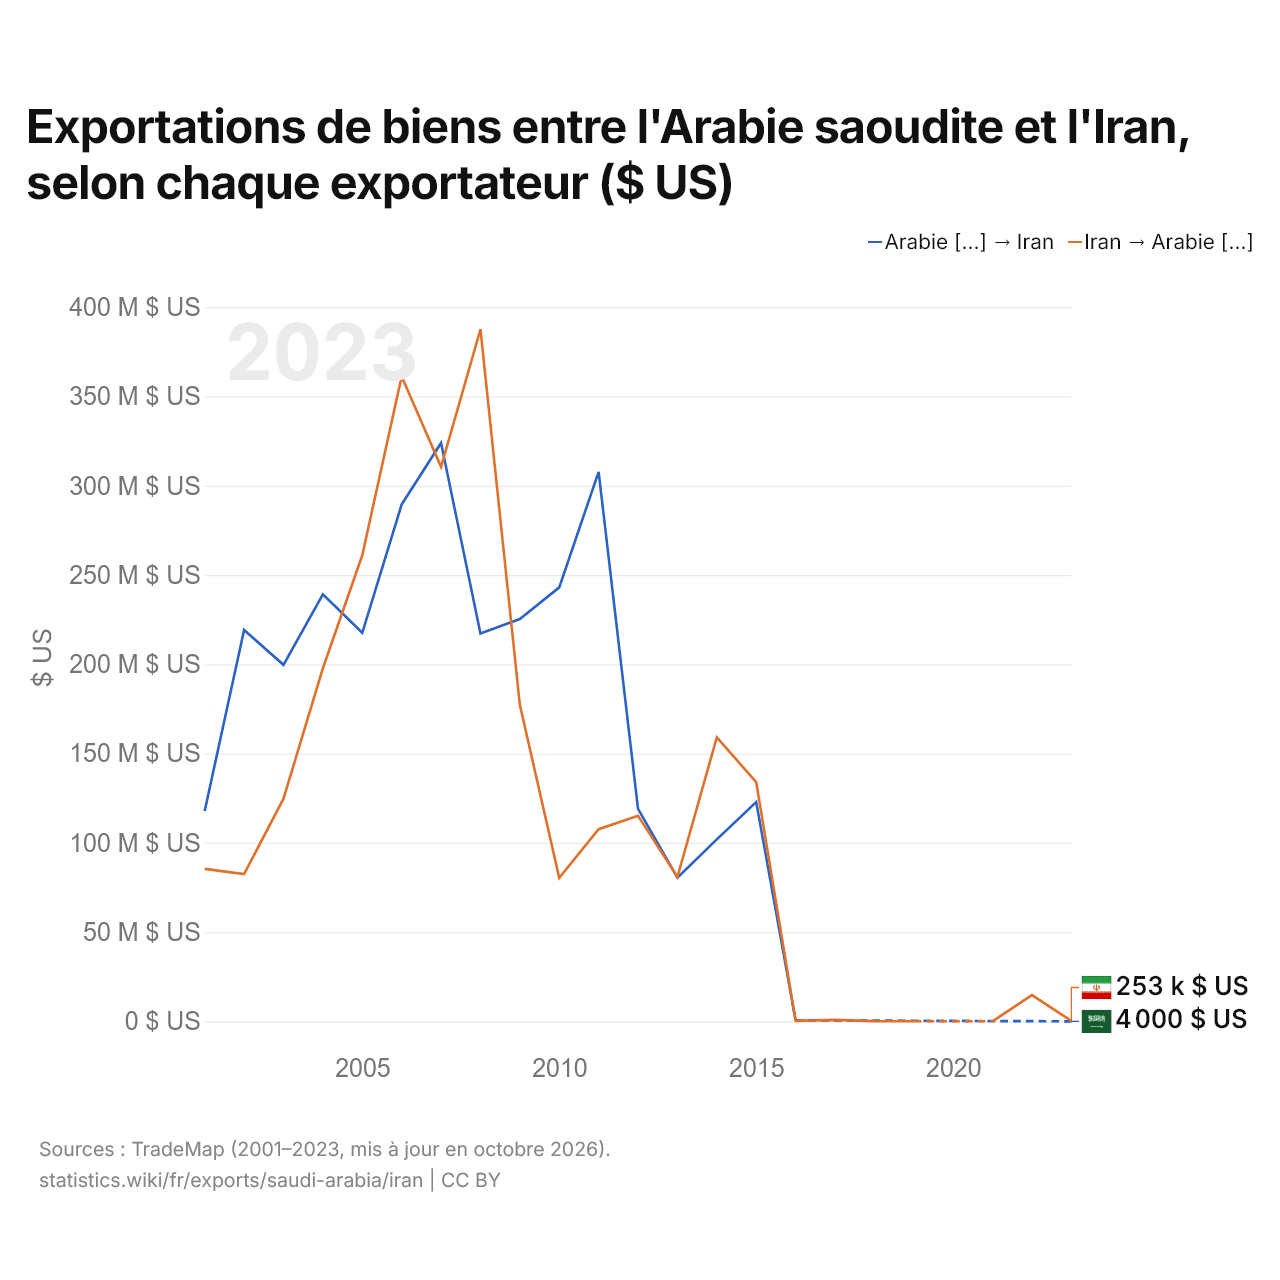
Exportations de biens entre l'Arabie saoudite et l'Iran, selon chaque exportateur ($ US)
| Année | $ US | |
|---|---|---|
| Arabie [...] → Iran | Iran → Arabie [...] | |
| 2023 | 4 000 $ US | 253 000 $ US |
| 2022 | - | 14 708 000 $ US |
| 2021 | - | 41 000 $ US |
| 2020 | - | - |
| 2019 | - | 35 000 $ US |
| 2018 | - | 109 000 $ US |
| 2017 | - | 810 000 $ US |
| 2016 | 576 000 $ US | 235 000 $ US |
| 2015 | 122 814 000 $ US | 133 947 000 $ US |
| 2014 | 101 895 000 $ US | 159 072 000 $ US |
| 2013 | 80 408 000 $ US | 80 827 000 $ US |
| 2012 | 118 978 000 $ US | 115 131 000 $ US |
| 2011 | 307 746 000 $ US | 107 592 000 $ US |
| 2010 | 243 007 000 $ US | 80 354 000 $ US |
| 2009 | 225 329 000 $ US | 177 261 000 $ US |
| 2008 | 217 205 000 $ US | 387 584 000 $ US |
| 2007 | 323 909 000 $ US | 310 500 000 $ US |
| 2006 | 289 474 000 $ US | 361 127 000 $ US |
| 2005 | 217 593 000 $ US | 261 009 000 $ US |
| 2004 | 239 147 000 $ US | 197 734 000 $ US |
| 2003 | 199 644 000 $ US | 124 654 000 $ US |
| 2002 | 219 194 000 $ US | 82 481 000 $ US |
| 2001 | 117 781 000 $ US | 85 409 000 $ US |
Les exportations de biens de l'Arabie saoudite vers l'Iran, selon l'Arabie saoudite, s'élèvent à 4 000 dollars, et celles de l'Iran vers l'Arabie saoudite, selon l'Iran, à 253 000 dollars : 63 fois plus pour celles de l'Iran. En 2001, elles s'élevaient à 118 millions de dollars pour l'Arabie saoudite et à 85,4 millions de dollars pour l'Iran.
Arabie saoudite vs Iran : chiffres des exportations
|
Arabie saoudite
|
Iran
|
|
|---|---|---|
| Exportations | 380 Md $US (2025) | 93,4 Md $US (2025) |
| Rang mondial | 27/176 | 50/176 |
| Part mondiale | 1,09 % | 0,27 % |
| % du PIB | 29,7 % | 25,8 % |
| Première catégorie de biens | Pétrole, gaz, minerais et autres matières premières (72,3 %, 2025) | Pétrole, gaz, minerais et autres matières premières (72,9 %, 2023) |
| Première destination des biens | Émirats arabes unis (9,19 %, 2025) | Chine (27,1 %, 2023) |
Comparer les exportations de 2 pays au choix
Sources :
- Banque mondiale | Économie et croissance (1960–2025, mis à jour en octobre 2026)
- TradeMap (2001–2025, mis à jour en octobre 2026)
Creative Commons Attribution (CC BY) : vous pouvez copier, partager, adapter et réutiliser ce contenu, y compris à des fins commerciales, à condition de citer statistics.wiki et d’indiquer les modifications apportées. Les sources citées ci-dessus peuvent avoir leurs propres conditions de licence.