
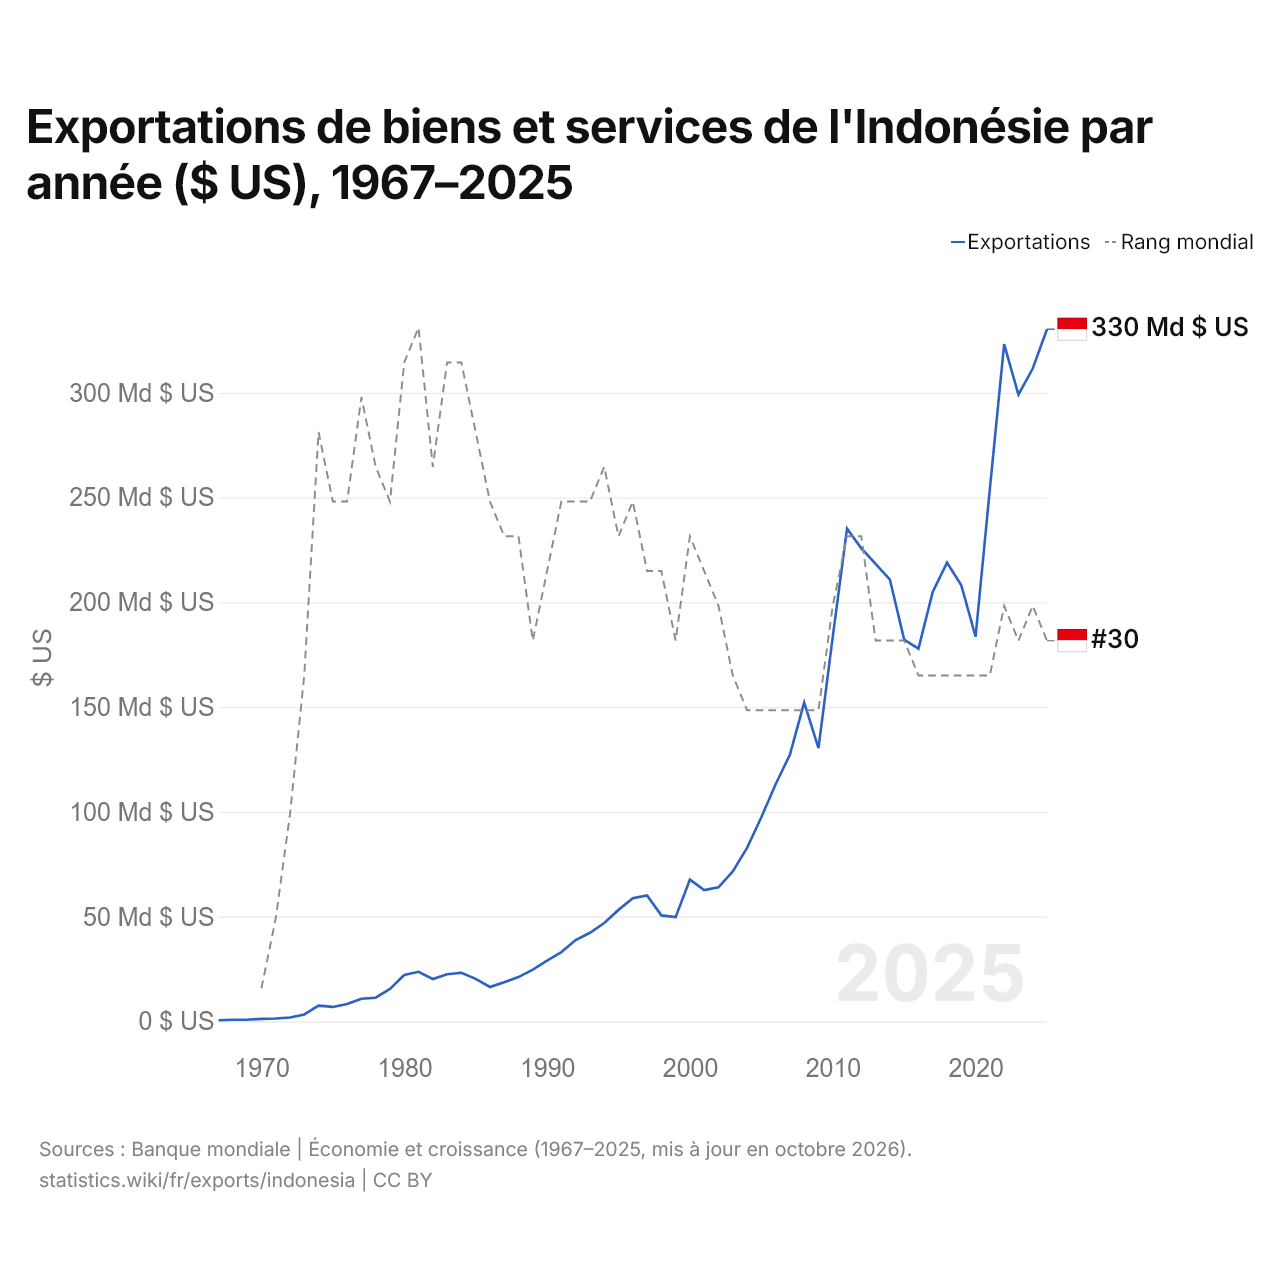
Exportations de biens et services de l'Indonésie par année ($ US), 1967–2025
| Année | $ US | Rang mondial |
|---|---|---|
| Exportations | Rang mondial | |
| 2025 | 330 279 431 219 $ US | #30 |
| 2024 | 311 510 024 779 $ US | #29 |
| 2023 | 299 031 805 851 $ US | #30 |
| 2022 | 323 218 198 016 $ US | #29 |
| 2021 | 254 109 508 154 $ US | #31 |
| 2020 | 183 546 577 017 $ US | #31 |
| 2019 | 208 057 763 659 $ US | #31 |
| 2018 | 218 905 647 887 $ US | #31 |
| 2017 | 204 924 485 909 $ US | #31 |
| 2016 | 177 886 012 745 $ US | #31 |
| 2015 | 182 158 298 802 $ US | #30 |
| 2014 | 210 820 082 832 $ US | #30 |
| 2013 | 218 308 408 828 $ US | #30 |
| 2012 | 225 744 403 268 $ US | #27 |
| 2011 | 235 095 129 133 $ US | #27 |
| 2010 | 183 480 562 961 $ US | #29 |
| 2009 | 130 357 798 591 $ US | #32 |
| 2008 | 152 090 401 422 $ US | #32 |
| 2007 | 127 226 102 177 $ US | #32 |
| 2006 | 113 143 425 288 $ US | #32 |
| 2005 | 97 387 627 566 $ US | #32 |
| 2004 | 82 744 351 781 $ US | #32 |
| 2003 | 71 553 141 045 $ US | #31 |
| 2002 | 63 956 798 805 $ US | #29 |
| 2001 | 62 625 875 834 $ US | #28 |
| 2000 | 67 621 169 166 $ US | #27 |
| 1999 | 49 720 260 590 $ US | #30 |
| 1998 | 50 555 726 235 $ US | #28 |
| 1997 | 60 106 038 404 $ US | #28 |
| 1996 | 58 717 201 042 $ US | #26 |
| 1995 | 53 185 312 942 $ US | #27 |
| 1994 | 46 896 633 114 $ US | #25 |
| 1993 | 42 274 397 859 $ US | #26 |
| 1992 | 38 801 726 176 $ US | #26 |
| 1991 | 33 063 806 609 $ US | #26 |
| 1990 | 28 982 531 183 $ US | #28 |
| 1989 | 24 640 067 877 $ US | #30 |
| 1988 | 21 110 162 564 $ US | #27 |
| 1987 | 18 661 070 321 $ US | #27 |
| 1986 | 16 387 068 857 $ US | #26 |
| 1985 | 20 279 853 770 $ US | #24 |
| 1984 | 23 177 770 013 $ US | #22 |
| 1983 | 22 488 286 931 $ US | #22 |
| 1982 | 20 176 590 280 $ US | #25 |
| 1981 | 23 629 067 626 $ US | #21 |
| 1980 | 22 088 390 917 $ US | #22 |
| 1979 | 15 453 888 921 $ US | #26 |
| 1978 | 11 251 894 888 $ US | #25 |
| 1977 | 10 760 963 855 $ US | #23 |
| 1976 | 8 264 096 386 $ US | #26 |
| 1975 | 6 868 915 663 $ US | #26 |
| 1974 | 7 482 168 675 $ US | #24 |
| 1973 | 3 263 373 494 $ US | #31 |
| 1972 | 1 816 385 542 $ US | #35 |
| 1971 | 1 345 889 844 $ US | #38 |
| 1970 | 1 175 342 466 $ US | #40 |
| 1969 | 751 533 742 $ US | - |
| 1968 | 769 173 674 $ US | - |
| 1967 | 497 382 747 $ US | - |
En 2025, les exportations de biens et services de l'Indonésie s'élevaient à 330 milliards de dollars, contre 497 millions de dollars en 1967. Elles se classaient au 30e rang mondial, en baisse par rapport au 29e rang en 2024. Leur meilleur rang a été le 21e, occupé pour la dernière fois en 1981.
En 2025, les exportations de biens et services de l'Indonésie étaient les 13es plus élevées de 44 pays situés en Asie. Les importations de biens et services de l'Indonésie s'élevaient à 297 milliards de dollars en 2025, au 31e rang mondial. En 2025, les exportations de l'Indonésie dépassaient ses importations de 33,3 milliards de dollars, soit un excédent commercial.
Exportations de biens de l'Indonésie par catégorie, 2025
Exportations de biens, 2025: 283 Md $US
En 2025, la première catégorie des exportations de biens de l'Indonésie était « pétrole, gaz, minerais et autres matières premières », avec 22,0 %, suivie de « métaux communs (fer, acier, cuivre, aluminium) », avec 17,0 %.
Destinations des exportations de biens de l'Indonésie : les 10 premières, 2025
| Rang | Pays | Exportations de biens | Part | |
|---|---|---|---|---|
| 1 |
 Chine |
67,0 Md $US | 23,7 % | vs Chine |
| 2 |
 États-Unis |
31,0 Md $US | 11 % | |
| 3 |
 Inde |
18,3 Md $US | 6,48 % | vs Inde |
| 4 |
 Japon |
17,6 Md $US | 6,22 % | vs Japon |
| 5 |
 Singapour |
13,7 Md $US | 4,84 % | vs Singapour |
| 6 |
 Malaisie |
13,1 Md $US | 4,63 % | vs Malaisie |
| 7 |
 Vietnam |
10,6 Md $US | 3,75 % | vs Vietnam |
| 8 |
 Philippines |
10,2 Md $US | 3,61 % | vs Philippines |
| 9 |
 Corée du Sud |
10,1 Md $US | 3,59 % | vs Corée du Sud |
| 10 |
 Thaïlande |
8,77 Md $US | 3,1 % | vs Thaïlande |
| Autres partenaires et non précisés | 82,4 Md $US | 29,1 % |
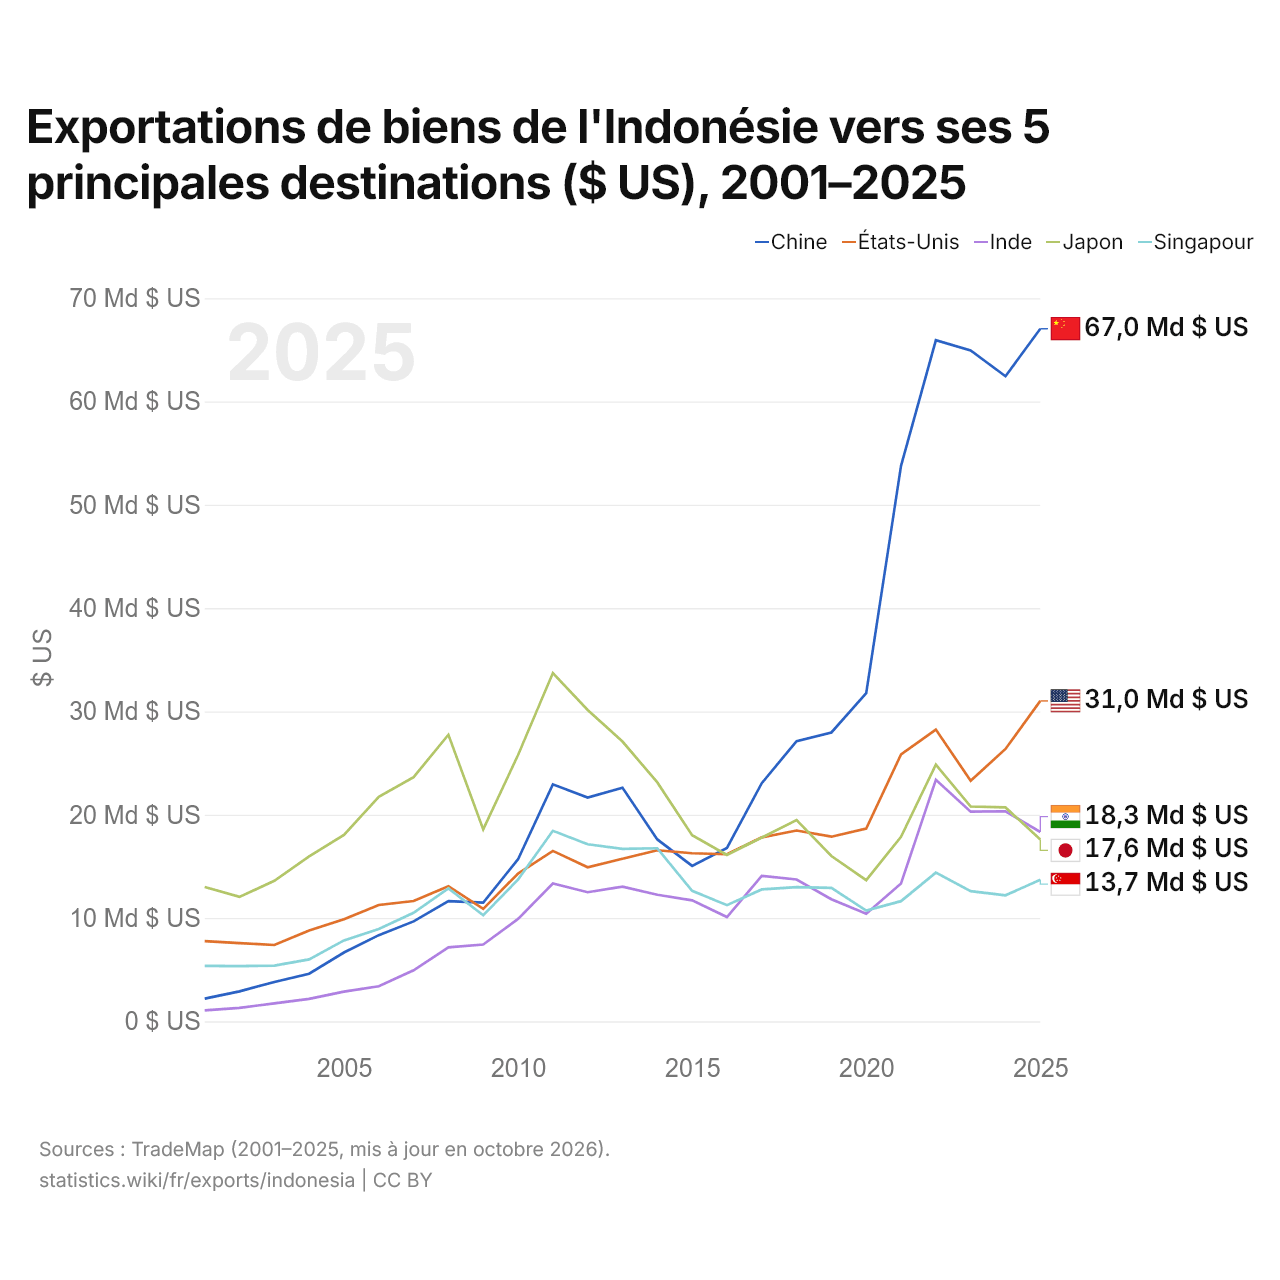
Exportations de biens de l'Indonésie vers ses 5 principales destinations ($ US), 2001–2025
| Année | $ US | ||||
|---|---|---|---|---|---|
| Chine | États-Unis | Inde | Japon | Singapour | |
| 2025 | 67 037 769 000 $ US | 31 013 703 000 $ US | 18 324 705 000 $ US | 17 610 502 000 $ US | 13 699 085 000 $ US |
| 2024 | 62 439 028 000 $ US | 26 364 782 000 $ US | 20 335 686 000 $ US | 20 705 780 000 $ US | 12 198 381 000 $ US |
| 2023 | 64 938 703 000 $ US | 23 287 665 000 $ US | 20 290 562 000 $ US | 20 789 559 000 $ US | 12 607 218 000 $ US |
| 2022 | 65 924 117 000 $ US | 28 239 114 000 $ US | 23 378 836 000 $ US | 24 845 365 000 $ US | 14 395 732 000 $ US |
| 2021 | 53 764 668 000 $ US | 25 834 929 000 $ US | 13 341 986 000 $ US | 17 868 287 000 $ US | 11 631 895 000 $ US |
| 2020 | 31 775 692 000 $ US | 18 666 768 000 $ US | 10 413 999 000 $ US | 13 662 871 000 $ US | 10 712 315 000 $ US |
| 2019 | 27 961 887 000 $ US | 17 873 447 000 $ US | 11 823 491 000 $ US | 16 003 261 000 $ US | 12 916 730 000 $ US |
| 2018 | 27 126 932 000 $ US | 18 471 422 000 $ US | 13 725 676 000 $ US | 19 479 892 000 $ US | 12 991 593 000 $ US |
| 2017 | 23 049 296 000 $ US | 17 810 363 000 $ US | 14 083 573 000 $ US | 17 790 812 000 $ US | 12 767 193 000 $ US |
| 2016 | 16 785 586 000 $ US | 16 171 116 000 $ US | 10 093 805 000 $ US | 16 101 547 000 $ US | 11 247 529 000 $ US |
| 2015 | 15 045 332 000 $ US | 16 266 948 000 $ US | 11 713 021 000 $ US | 18 014 347 000 $ US | 12 632 335 000 $ US |
| 2014 | 17 605 944 000 $ US | 16 560 076 000 $ US | 12 248 960 000 $ US | 23 127 089 000 $ US | 16 752 340 000 $ US |
| 2013 | 22 601 487 000 $ US | 15 741 132 000 $ US | 13 031 303 000 $ US | 27 086 259 000 $ US | 16 686 239 000 $ US |
| 2012 | 21 659 503 000 $ US | 14 910 181 000 $ US | 12 496 314 000 $ US | 30 135 107 000 $ US | 17 135 025 000 $ US |
| 2011 | 22 941 005 000 $ US | 16 497 616 000 $ US | 13 335 706 000 $ US | 33 714 696 000 $ US | 18 443 890 000 $ US |
| 2010 | 15 692 611 000 $ US | 14 301 876 000 $ US | 9 915 039 000 $ US | 25 781 814 000 $ US | 13 723 266 000 $ US |
| 2009 | 11 499 327 000 $ US | 10 889 079 000 $ US | 7 432 893 000 $ US | 18 574 730 000 $ US | 10 262 665 000 $ US |
| 2008 | 11 636 504 000 $ US | 13 079 934 000 $ US | 7 163 336 000 $ US | 27 743 856 000 $ US | 12 862 045 000 $ US |
| 2007 | 9 675 513 000 $ US | 11 644 198 000 $ US | 4 943 906 000 $ US | 23 632 790 000 $ US | 10 501 617 000 $ US |
| 2006 | 8 343 571 000 $ US | 11 259 136 000 $ US | 3 390 790 000 $ US | 21 732 123 000 $ US | 8 929 849 000 $ US |
| 2005 | 6 662 354 000 $ US | 9 889 196 000 $ US | 2 878 348 000 $ US | 18 049 140 000 $ US | 7 836 585 000 $ US |
| 2004 | 4 604 733 000 $ US | 8 787 070 000 $ US | 2 170 507 000 $ US | 15 962 109 000 $ US | 5 999 058 000 $ US |
| 2003 | 3 802 530 000 $ US | 7 386 381 000 $ US | 1 742 488 000 $ US | 13 603 494 000 $ US | 5 399 658 000 $ US |
| 2002 | 2 902 948 000 $ US | 7 570 467 000 $ US | 1 301 960 000 $ US | 12 045 115 000 $ US | 5 349 084 000 $ US |
| 2001 | 2 200 670 000 $ US | 7 761 328 000 $ US | 1 053 940 000 $ US | 13 010 175 000 $ US | 5 363 831 000 $ US |
En 2025, les exportations de biens s'élevaient à 67 milliards de dollars vers la Chine, 31 milliards de dollars vers les États-Unis, 18,3 milliards de dollars vers l'Inde, 17,6 milliards de dollars vers le Japon et 13,7 milliards de dollars vers Singapour. Le premier rang des cinq destinations de l'Indonésie est occupé par la Chine depuis 2016. Le changement le plus récent dans leur ordre remonte à 2025, quand les exportations de l'Indonésie vers l'Inde ont dépassé celles vers le Japon.
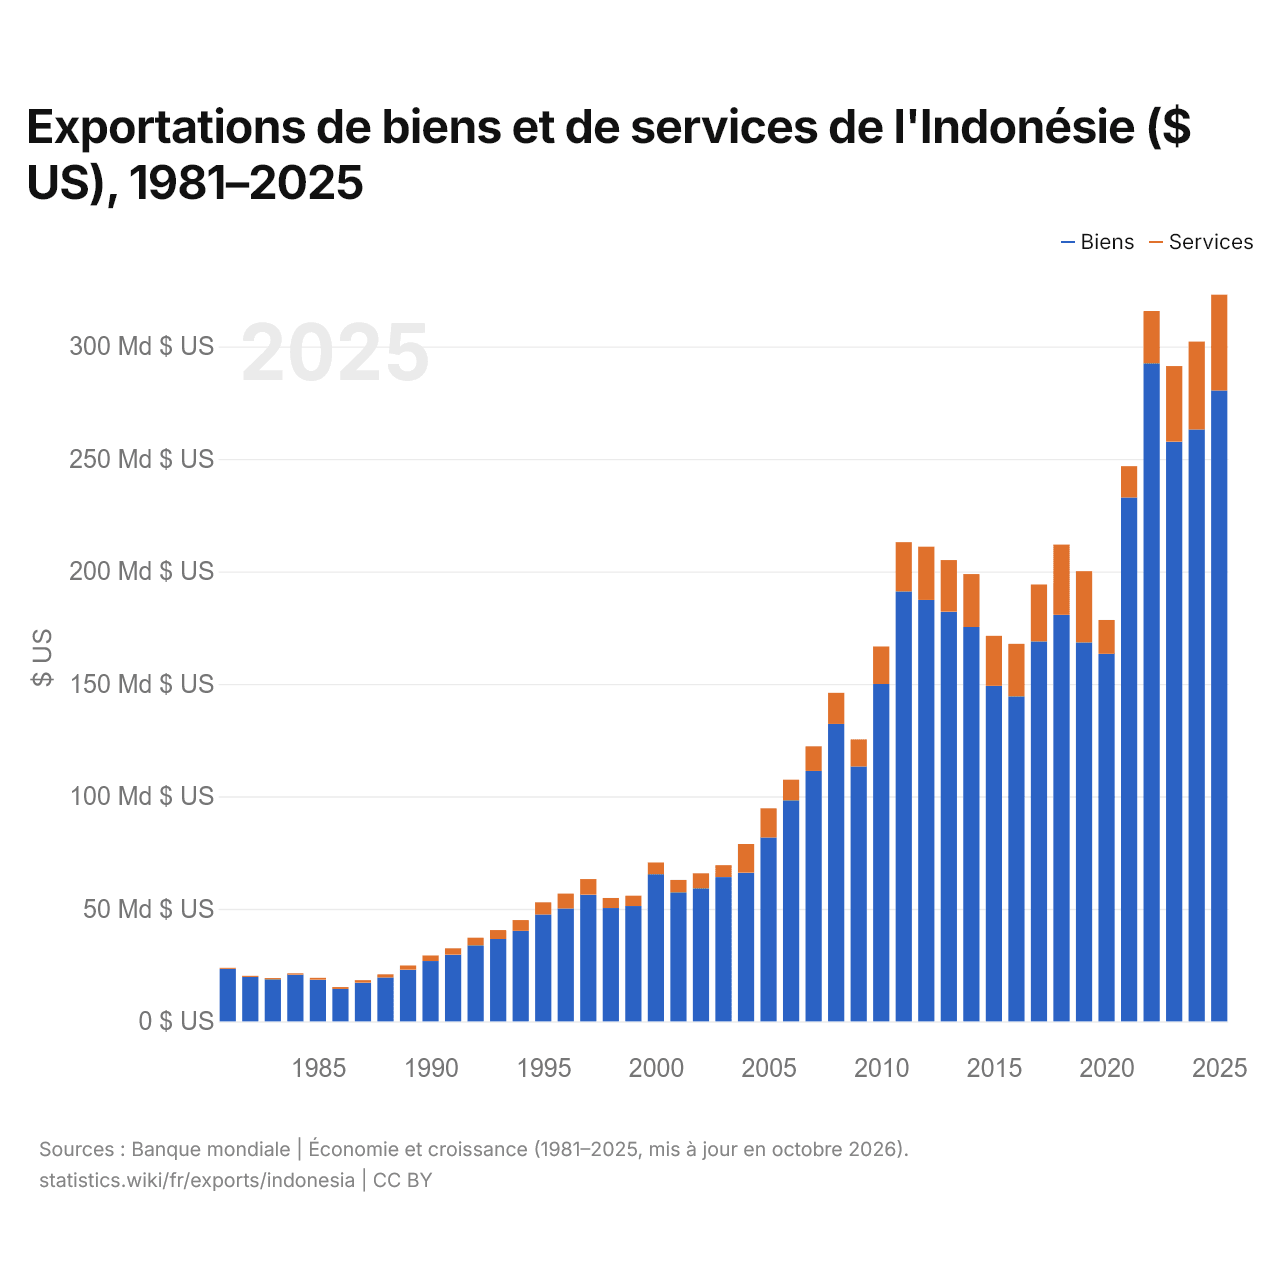
Exportations de biens et de services de l'Indonésie ($ US), 1981–2025
| Année | $ US | |
|---|---|---|
| Biens | Services | |
| 2025 | 280 434 818 973 $ US | 42 580 721 047 $ US |
| 2024 | 263 090 723 013 $ US | 39 089 575 048 $ US |
| 2023 | 257 680 632 055 $ US | 33 606 816 998 $ US |
| 2022 | 292 538 140 412 $ US | 23 207 563 052 $ US |
| 2021 | 232 835 281 717 $ US | 13 951 271 376 $ US |
| 2020 | 163 401 805 728 $ US | 15 015 985 674 $ US |
| 2019 | 168 455 366 019 $ US | 31 641 319 125 $ US |
| 2018 | 180 724 984 049 $ US | 31 206 848 719 $ US |
| 2017 | 168 882 513 335 $ US | 25 327 655 425 $ US |
| 2016 | 144 469 786 220 $ US | 23 323 541 061 $ US |
| 2015 | 149 124 481 791 $ US | 22 220 881 445 $ US |
| 2014 | 175 292 794 721 $ US | 23 530 927 575 $ US |
| 2013 | 182 089 226 648 $ US | 22 943 904 590 $ US |
| 2012 | 187 346 549 960 $ US | 23 660 062 833 $ US |
| 2011 | 191 108 701 478 $ US | 21 888 154 371 $ US |
| 2010 | 149 965 835 842 $ US | 16 670 487 601 $ US |
| 2009 | 113 266 436 146 $ US | 12 055 619 120 $ US |
| 2008 | 132 209 690 385 $ US | 13 845 460 474 $ US |
| 2007 | 111 301 169 992 $ US | 10 964 374 108 $ US |
| 2006 | 98 250 970 000 $ US | 9 149 086 942 $ US |
| 2005 | 81 682 380 000 $ US | 12 997 157 823 $ US |
| 2004 | 66 084 130 000 $ US | 12 729 428 769 $ US |
| 2003 | 64 109 240 000 $ US | 5 292 886 374 $ US |
| 2002 | 59 165 120 000 $ US | 6 662 903 965 $ US |
| 2001 | 57 364 570 000 $ US | 5 500 453 700 $ US |
| 2000 | 65 407 380 000 $ US | 5 214 141 117 $ US |
| 1999 | 51 241 887 522 $ US | 4 598 583 513 $ US |
| 1998 | 50 370 971 800 $ US | 4 479 000 000 $ US |
| 1997 | 56 298 000 000 $ US | 6 941 000 000 $ US |
| 1996 | 50 188 000 000 $ US | 6 599 000 000 $ US |
| 1995 | 47 454 000 000 $ US | 5 469 000 000 $ US |
| 1994 | 40 223 000 000 $ US | 4 797 000 000 $ US |
| 1993 | 36 607 000 000 $ US | 3 959 000 000 $ US |
| 1992 | 33 796 000 000 $ US | 3 391 000 000 $ US |
| 1991 | 29 635 000 000 $ US | 2 822 000 000 $ US |
| 1990 | 26 807 000 000 $ US | 2 488 000 000 $ US |
| 1989 | 22 974 000 000 $ US | 1 875 000 000 $ US |
| 1988 | 19 509 000 000 $ US | 1 369 000 000 $ US |
| 1987 | 17 206 000 000 $ US | 1 065 000 000 $ US |
| 1986 | 14 396 000 000 $ US | 844 000 000 $ US |
| 1985 | 18 527 000 000 $ US | 844 000 000 $ US |
| 1984 | 20 754 000 000 $ US | 570 000 000 $ US |
| 1983 | 18 689 000 000 $ US | 546 000 000 $ US |
| 1982 | 19 747 000 000 $ US | 504 000 000 $ US |
| 1981 | 23 348 000 000 $ US | 449 000 000 $ US |
En 2025, les exportations de biens de l'Indonésie s'élevaient à 280 milliards de dollars et celles de services à 42,6 milliards de dollars ; les services représentaient 13,2 % du total, contre 1,9 % en 1981.
L'Indonésie dans le classement mondial des exportations, 2025
| Rang | Pays | Exportations | Part mondiale | |
|---|---|---|---|---|
| 27 |
 Arabie saoudite |
380 Md $US | 1,09 % | vs Arabie saoudite |
| 28 |
 Suède |
356 Md $US | 1,02 % | |
| 29 |
Malaisie
|
335 Md $US | 0,96 % | vs Malaisie |
| 30 |
 Indonésie |
330 Md $US | 0,95 % | |
| 31 |
 Danemark |
324 Md $US | 0,93 % | |
| 32 |
 Autriche |
317 Md $US | 0,91 % | |
| 33 |
 Tchéquie |
262 Md $US | 0,75 % |
Exportations de biens et services de l'Indonésie, % du PIB, 1960–2025
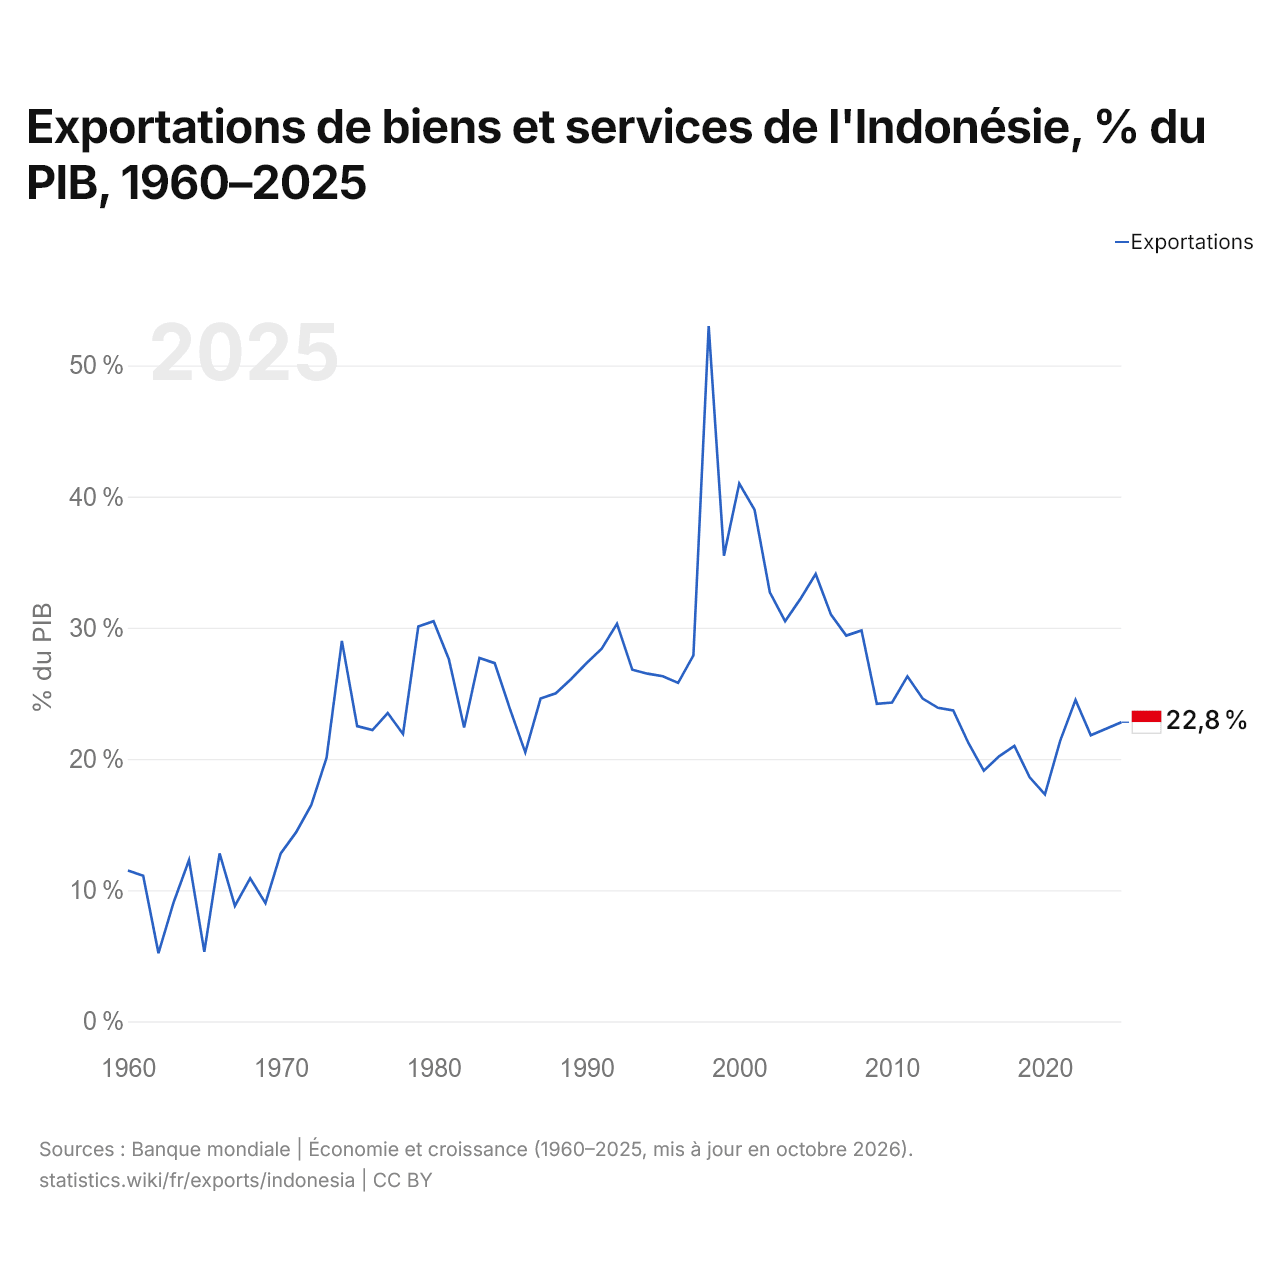
En 2025, les exportations de biens et services de l'Indonésie équivalaient à 22,8 % de son PIB, contre 11,5 % en 1960. La part la plus élevée a été de 53,0 %, en 1998.
Comparer les exportations de l'Indonésie avec celles d'autres pays
Sources :
- TradeMap (2001–2025, mis à jour en octobre 2026)
- Banque mondiale | Économie et croissance (1960–2025, mis à jour en octobre 2026)
Creative Commons Attribution (CC BY) : vous pouvez copier, partager, adapter et réutiliser ce contenu, y compris à des fins commerciales, à condition de citer statistics.wiki et d’indiquer les modifications apportées. Les sources citées ci-dessus peuvent avoir leurs propres conditions de licence.