
Balance commerciale de l'Indonésie par année ($ US) : excédent (+) ou déficit (−), 1967–2025
| Année | $ US | ||
|---|---|---|---|
| Biens et services | Biens | Services | |
| 2025 | 33 277 095 524 $ US | 49 853 296 059 $ US | −20 203 960 379 $ US |
| 2024 | 25 264 121 428 $ US | 39 838 650 570 $ US | −18 485 137 973 $ US |
| 2023 | 29 571 270 062 $ US | 46 269 364 887 $ US | −17 676 097 153 $ US |
| 2022 | 46 711 393 458 $ US | 62 672 201 692 $ US | −19 957 118 922 $ US |
| 2021 | 31 185 663 099 $ US | 43 806 016 676 $ US | −14 598 514 101 $ US |
| 2020 | 17 899 733 715 $ US | 28 301 275 850 $ US | −9 755 481 534 $ US |
| 2019 | −4 976 882 676 $ US | 3 507 733 912 $ US | −7 641 058 390 $ US |
| 2018 | −11 139 964 499 $ US | −228 302 713 $ US | −6 485 070 594 $ US |
| 2017 | 10 147 166 713 $ US | 18 813 932 316 $ US | −7 379 163 587 $ US |
| 2016 | 7 051 011 915 $ US | 15 317 989 719 $ US | −7 083 664 759 $ US |
| 2015 | 3 294 646 496 $ US | 14 048 569 144 $ US | −8 696 670 132 $ US |
| 2014 | −6 665 132 939 $ US | 6 982 569 777 $ US | −10 009 694 832 $ US |
| 2013 | −7 210 947 472 $ US | 5 833 232 479 $ US | −12 070 342 230 $ US |
| 2012 | −3 617 699 112 $ US | 8 679 594 719 $ US | −10 564 010 248 $ US |
| 2011 | 22 098 243 866 $ US | 33 824 995 304 $ US | −9 803 270 546 $ US |
| 2010 | 14 322 535 351 $ US | 31 002 654 999 $ US | −9 790 506 103 $ US |
| 2009 | 15 141 253 737 $ US | 32 287 432 063 $ US | −11 096 395 785 $ US |
| 2008 | 5 383 772 872 $ US | 24 542 404 511 $ US | −14 624 645 984 $ US |
| 2007 | 17 471 008 752 $ US | 34 525 719 992 $ US | −13 614 004 011 $ US |
| 2006 | 19 731 671 212 $ US | 32 197 860 000 $ US | −12 411 858 209 $ US |
| 2005 | 11 853 826 412 $ US | 17 610 890 000 $ US | −9 199 669 672 $ US |
| 2004 | 11 999 661 267 $ US | 19 468 280 000 $ US | −8 126 880 512 $ US |
| 2003 | 17 229 518 703 $ US | 24 563 070 000 $ US | −12 107 529 336 $ US |
| 2002 | 12 318 361 644 $ US | 23 513 250 000 $ US | −10 381 979 668 $ US |
| 2001 | 13 270 680 432 $ US | 22 696 090 000 $ US | −10 379 688 909 $ US |
| 2000 | 17 356 482 696 $ US | 25 042 000 000 $ US | −10 422 942 013 $ US |
| 1999 | 11 318 192 667 $ US | 20 643 437 522 $ US | −7 777 479 985 $ US |
| 1998 | 9 306 014 193 $ US | 18 428 826 100 $ US | −7 609 211 673 $ US |
| 1997 | −594 112 855 $ US | 10 075 000 000 $ US | −9 666 000 000 $ US |
| 1996 | −1 399 777 996 $ US | 5 948 000 000 $ US | −8 540 000 000 $ US |
| 1995 | −2 696 966 882 $ US | 6 533 000 000 $ US | −8 071 000 000 $ US |
| 1994 | 2 026 749 971 $ US | 7 901 000 000 $ US | −6 619 000 000 $ US |
| 1993 | 4 718 460 796 $ US | 8 231 000 000 $ US | −5 887 000 000 $ US |
| 1992 | 4 080 850 477 $ US | 7 022 000 000 $ US | −4 709 000 000 $ US |
| 1991 | 2 172 617 938 $ US | 4 801 000 000 $ US | −3 742 000 000 $ US |
| 1990 | 1 825 255 936 $ US | 5 352 000 000 $ US | −3 568 000 000 $ US |
| 1989 | 2 921 595 781 $ US | 6 664 000 000 $ US | −3 564 000 000 $ US |
| 1988 | 2 384 647 397 $ US | 5 678 000 000 $ US | −3 237 000 000 $ US |
| 1987 | 1 654 773 878 $ US | 4 674 000 000 $ US | −3 375 000 000 $ US |
| 1986 | −14 658 183 $ US | 2 458 000 000 $ US | −3 412 000 000 $ US |
| 1985 | 2 419 636 586 $ US | 5 822 000 000 $ US | −4 291 000 000 $ US |
| 1984 | 3 834 824 869 $ US | 5 707 000 000 $ US | −3 669 000 000 $ US |
| 1983 | −865 978 918 $ US | 963 000 000 $ US | −3 765 000 000 $ US |
| 1982 | −3 532 551 269 $ US | 1 893 000 000 $ US | −4 358 000 000 $ US |
| 1981 | 1 781 847 509 $ US | 6 806 000 000 $ US | −4 549 000 000 $ US |
| 1980 | 6 011 898 212 $ US | - | - |
| 1979 | 3 328 732 396 $ US | - | - |
| 1978 | 524 601 304 $ US | - | - |
| 1977 | 1 562 891 566 $ US | - | - |
| 1976 | 500 000 000 $ US | - | - |
| 1975 | 174 939 759 $ US | - | - |
| 1974 | 1 955 180 723 $ US | - | - |
| 1973 | 93 253 012 $ US | - | - |
| 1972 | −261 686 747 $ US | - | - |
| 1971 | −207 411 919 $ US | - | - |
| 1970 | −273 972 603 $ US | - | - |
| 1969 | −484 662 577 $ US | - | - |
| 1968 | −333 117 339 $ US | - | - |
| 1967 | −458 608 286 $ US | - | - |
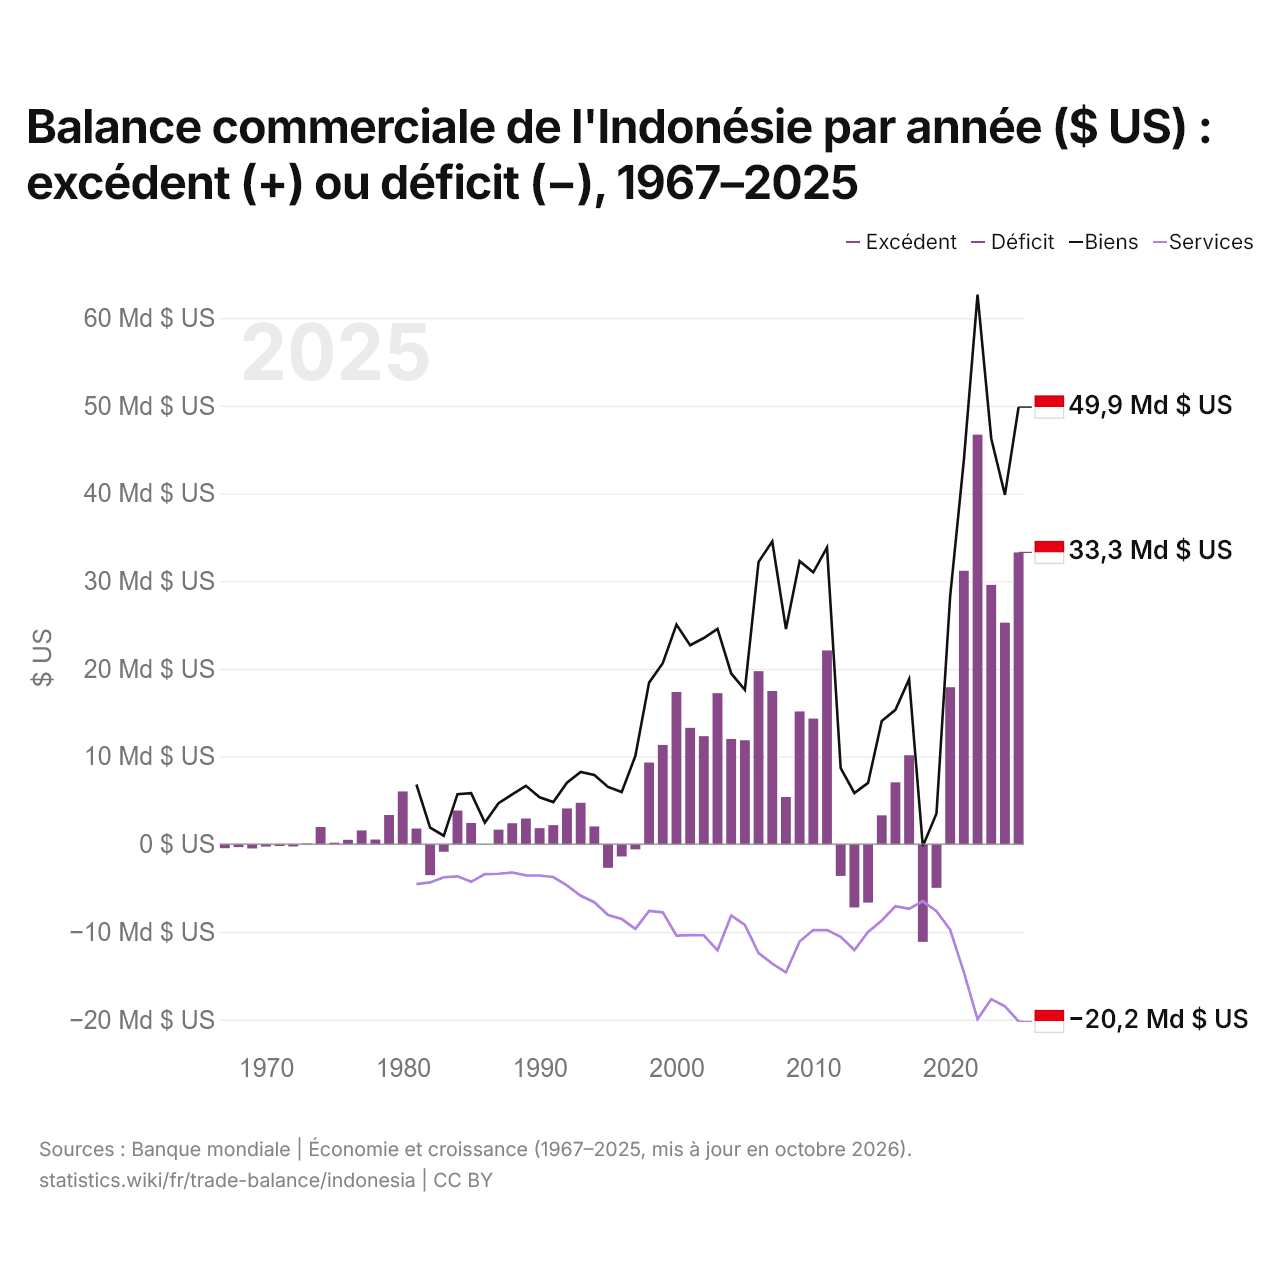
En 2025, la balance commerciale de l'Indonésie affichait un excédent de 33,3 milliards de dollars, contre un déficit de 459 millions de dollars en 1967. Le plus grand déficit a été de 11,1 milliards de dollars, en 2018, et le plus grand excédent de 46,7 milliards de dollars, en 2022. La balance commerciale de l'Indonésie est excédentaire chaque année depuis 2020.
En 2025, le solde commercial de l'Indonésie était le 7e plus élevé de 44 pays situés en Asie, où les soldes allaient d'un déficit de 68,9 milliards de dollars en Inde à un excédent de 816 milliards de dollars en Chine. De 2016 à 2025, les soldes commerciaux de l'Indonésie ont totalisé un excédent de 185 milliards de dollars, contre un excédent de 79,9 milliards de dollars de 2006 à 2015. En 2025, les transactions courantes de l'Indonésie affichaient un déficit de 0,1 % du PIB.
Commerce de biens de l'Indonésie avec ses 10 principaux partenaires commerciaux, selon l'Indonésie, 2025
| Pays | Exportations vers | Importations depuis | Solde | |
|---|---|---|---|---|
 Chine |
67,0 Md $US | 87,5 Md $US | −20,5 Md $US | vs Chine |
 États-Unis |
31,0 Md $US | 12,9 Md $US | +18,1 Md $US | |
 Singapour |
13,7 Md $US | 19,2 Md $US | −5,47 Md $US | vs Singapour |
 Japon |
17,6 Md $US | 14,5 Md $US | +3,14 Md $US | vs Japon |
 Malaisie |
13,1 Md $US | 11,1 Md $US | +1,97 Md $US | vs Malaisie |
 Inde |
18,3 Md $US | 4,84 Md $US | +13,5 Md $US | vs Inde |
 Corée du Sud |
10,1 Md $US | 7,90 Md $US | +2,25 Md $US | vs Corée du Sud |
 Thaïlande |
8,77 Md $US | 8,91 Md $US | −141 M $US | vs Thaïlande |
 Vietnam |
10,6 Md $US | 6,15 Md $US | +4,47 Md $US | vs Vietnam |
 Australie |
3,73 Md $US | 9,36 Md $US | −5,63 Md $US | vs Australie |
Balance commerciale de l'Indonésie : excédent (+) ou déficit (−)
| Biens et services, $ US, 2025 | +33,3 Md $US |
|---|---|
| % du PIB, 2025 | +2,3 % |
| Années d'excédent, 2000–2025 | 21 |
| Biens, $ US, 2025 | +49,9 Md $US |
| Services, $ US, 2025 | −20,2 Md $US |
| Premier excédent en biens, 2025 | États-Unis +18,1 Md $US |
| Premier déficit en biens, 2025 | Chine −20,5 Md $US |
Comparer la balance commerciale de l'Indonésie avec celle d'autres pays
Sources :
- TradeMap (2025, mis à jour en octobre 2026)
- Banque mondiale | Économie et croissance (1967–2025, mis à jour en octobre 2026)
Creative Commons Attribution (CC BY) : vous pouvez copier, partager, adapter et réutiliser ce contenu, y compris à des fins commerciales, à condition de citer statistics.wiki et d’indiquer les modifications apportées. Les sources citées ci-dessus peuvent avoir leurs propres conditions de licence.