
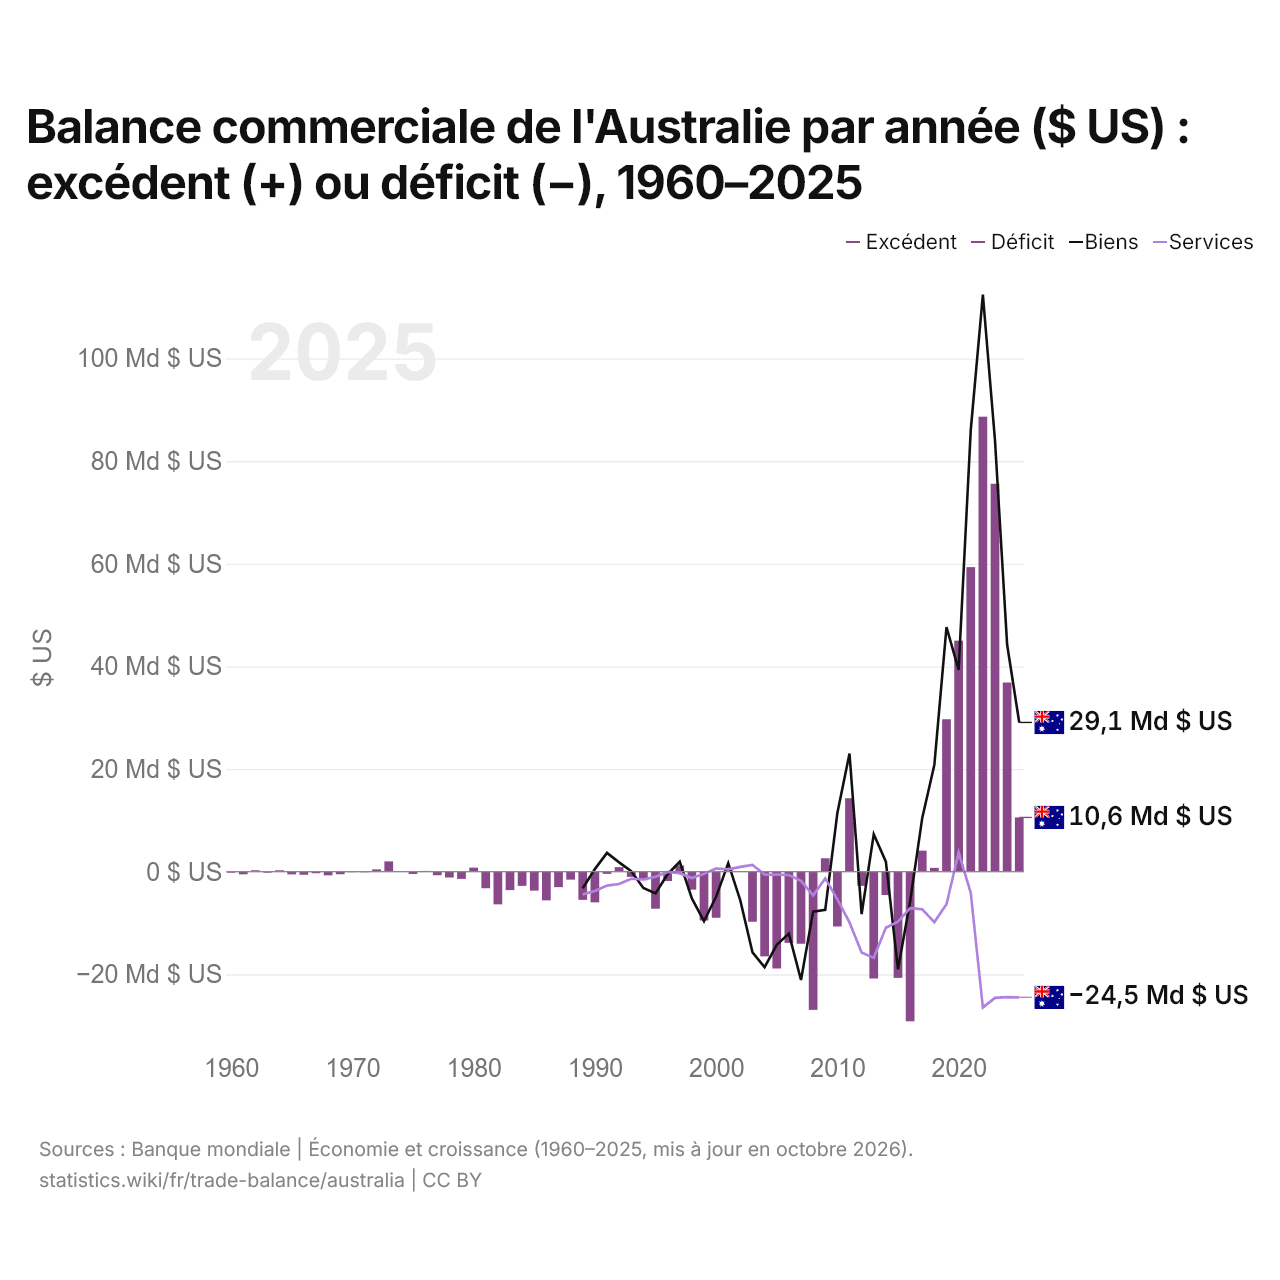
Balance commerciale de l'Australie par année ($ US) : excédent (+) ou déficit (−), 1960–2025
| Année | $ US | ||
|---|---|---|---|
| Biens et services | Biens | Services | |
| 2025 | 10 564 991 460 $ US | 29 074 544 669 $ US | −24 490 102 076 $ US |
| 2024 | 36 856 480 140 $ US | 44 248 148 168 $ US | −24 452 338 578 $ US |
| 2023 | 75 583 868 406 $ US | 84 017 532 339 $ US | −24 597 779 736 $ US |
| 2022 | 88 654 491 787 $ US | 112 431 958 614 $ US | −26 450 176 848 $ US |
| 2021 | 59 325 202 688 $ US | 86 043 060 955 $ US | −4 125 486 527 $ US |
| 2020 | 45 020 248 017 $ US | 39 313 270 594 $ US | 3 726 386 541 $ US |
| 2019 | 29 690 840 211 $ US | 47 647 881 936 $ US | −6 342 944 909 $ US |
| 2018 | 744 116 826 $ US | 20 835 551 520 $ US | −9 833 501 699 $ US |
| 2017 | 4 102 721 900 $ US | 10 472 886 579 $ US | −7 348 656 295 $ US |
| 2016 | −29 164 313 043 $ US | −5 826 340 908 $ US | −7 089 388 554 $ US |
| 2015 | −20 697 527 562 $ US | −19 012 929 788 $ US | −9 760 700 477 $ US |
| 2014 | −4 534 241 834 $ US | 1 960 310 525 $ US | −10 920 176 751 $ US |
| 2013 | −20 813 947 643 $ US | 7 284 880 281 $ US | −16 798 146 605 $ US |
| 2012 | −2 754 284 041 $ US | −8 258 791 674 $ US | −15 758 887 655 $ US |
| 2011 | 14 312 855 739 $ US | 23 007 365 237 $ US | −9 883 225 732 $ US |
| 2010 | −10 673 454 648 $ US | 11 425 118 600 $ US | −5 386 561 211 $ US |
| 2009 | 2 610 816 112 $ US | −7 440 048 160 $ US | −1 305 643 857 $ US |
| 2008 | −26 920 535 671 $ US | −7 781 608 881 $ US | −4 630 432 567 $ US |
| 2007 | −14 030 776 478 $ US | −21 092 301 565 $ US | −1 788 194 099 $ US |
| 2006 | −13 863 452 925 $ US | −12 070 944 265 $ US | −668 825 287 $ US |
| 2005 | −18 867 201 155 $ US | −14 265 351 923 $ US | −547 630 524 $ US |
| 2004 | −16 501 636 079 $ US | −18 618 983 092 $ US | −569 719 363 $ US |
| 2003 | −9 762 376 238 $ US | −15 724 989 124 $ US | 1 308 317 591 $ US |
| 2002 | 16 743 083 $ US | −5 640 965 903 $ US | 921 745 522 $ US |
| 2001 | 326 284 935 $ US | 1 660 686 792 $ US | 437 323 484 $ US |
| 2000 | −8 967 396 083 $ US | −4 888 627 645 $ US | 609 912 165 $ US |
| 1999 | −9 508 710 365 $ US | −9 656 629 702 $ US | −425 795 625 $ US |
| 1998 | −3 507 427 254 $ US | −5 226 148 565 $ US | −1 241 421 108 $ US |
| 1997 | 1 194 238 231 $ US | 1 935 952 651 $ US | −289 583 815 $ US |
| 1996 | −1 817 145 814 $ US | −490 366 203 $ US | −42 901 180 $ US |
| 1995 | −7 226 017 226 $ US | −4 236 918 909 $ US | −1 003 509 332 $ US |
| 1994 | −1 661 016 949 $ US | −3 187 823 737 $ US | −1 525 592 739 $ US |
| 1993 | −999 859 472 $ US | 74 666 150 $ US | −1 386 925 529 $ US |
| 1992 | 885 181 705 $ US | 1 814 776 747 $ US | −2 410 748 334 $ US |
| 1991 | −431 670 147 $ US | 3 664 562 939 $ US | −2 708 500 662 $ US |
| 1990 | −5 989 166 711 $ US | 496 410 803 $ US | −3 755 880 335 $ US |
| 1989 | −5 487 302 420 $ US | −3 224 652 811 $ US | −4 429 570 893 $ US |
| 1988 | −1 557 034 010 $ US | - | - |
| 1987 | −3 024 086 818 $ US | - | - |
| 1986 | −5 591 074 426 $ US | - | - |
| 1985 | −3 693 359 853 $ US | - | - |
| 1984 | −2 760 339 500 $ US | - | - |
| 1983 | −3 597 492 611 $ US | - | - |
| 1982 | −6 378 682 555 $ US | - | - |
| 1981 | −3 235 806 339 $ US | - | - |
| 1980 | 788 857 939 $ US | - | - |
| 1979 | −1 412 018 630 $ US | - | - |
| 1978 | −1 142 531 028 $ US | - | - |
| 1977 | −695 113 558 $ US | - | - |
| 1976 | 146 216 890 $ US | - | - |
| 1975 | −441 076 062 $ US | - | - |
| 1974 | −57 479 735 $ US | - | - |
| 1973 | 1 997 437 540 $ US | - | - |
| 1972 | 442 757 009 $ US | - | - |
| 1971 | −124 320 020 $ US | - | - |
| 1970 | −100 800 016 $ US | - | - |
| 1969 | −505 120 081 $ US | - | - |
| 1968 | −714 560 114 $ US | - | - |
| 1967 | −306 880 049 $ US | - | - |
| 1966 | −599 200 096 $ US | - | - |
| 1965 | −530 880 085 $ US | - | - |
| 1964 | 278 880 045 $ US | - | - |
| 1963 | −178 080 028 $ US | - | - |
| 1962 | 260 960 042 $ US | - | - |
| 1961 | −515 200 082 $ US | - | - |
| 1960 | −198 240 032 $ US | - | - |
En 2025, la balance commerciale de l'Australie affichait un excédent de 10,6 milliards de dollars, contre un déficit de 198 millions de dollars en 1960. Le plus grand déficit a été de 29,2 milliards de dollars, en 2016, et le plus grand excédent de 88,7 milliards de dollars, en 2022. La balance commerciale de l'Australie est excédentaire chaque année depuis 2017.
En 2025, l'excédent commercial de l'Australie était le plus élevé de 11 pays situés en Océanie, devant Nauru (déficit de 73,8 millions de dollars). De 2016 à 2025, les soldes commerciaux de l'Australie ont totalisé un excédent de 321 milliards de dollars, contre un déficit de 97,4 milliards de dollars de 2006 à 2015. En 2025, les transactions courantes de l'Australie affichaient un déficit de 2,8 % du PIB.
Commerce de biens de l'Australie avec ses 10 principaux partenaires commerciaux, selon l'Australie, 2025
| Pays | Exportations vers | Importations depuis | Solde | |
|---|---|---|---|---|
 Chine |
103 Md $US | 79,1 Md $US | +24,1 Md $US | vs Chine |
 États-Unis |
25,6 Md $US | 32,8 Md $US | −7,19 Md $US | vs USA |
 Japon |
26,2 Md $US | 15,8 Md $US | +10,4 Md $US | vs Japon |
 Corée du Sud |
20,1 Md $US | 14,1 Md $US | +6,04 Md $US | vs Corée du Sud |
 Inde |
13,7 Md $US | 7,45 Md $US | +6,30 Md $US | vs Inde |
 Royaume-Uni |
13,9 Md $US | 5,08 Md $US | +8,85 Md $US | vs R.-U. |
 Singapour |
5,93 Md $US | 12,6 Md $US | −6,71 Md $US | |
 Malaisie |
5,69 Md $US | 12,0 Md $US | −6,26 Md $US | |
 Thaïlande |
3,63 Md $US | 12,1 Md $US | −8,47 Md $US | |
 Vietnam |
6,65 Md $US | 8,18 Md $US | −1,53 Md $US | vs Vietnam |
Balance commerciale de l'Australie : excédent (+) ou déficit (−)
Comparer la balance commerciale de l'Australie avec celle d'autres pays
Sources :
- TradeMap (2025, mis à jour en octobre 2026)
- Banque mondiale | Économie et croissance (1960–2025, mis à jour en octobre 2026)
Creative Commons Attribution (CC BY) : vous pouvez copier, partager, adapter et réutiliser ce contenu, y compris à des fins commerciales, à condition de citer statistics.wiki et d’indiquer les modifications apportées. Les sources citées ci-dessus peuvent avoir leurs propres conditions de licence.