
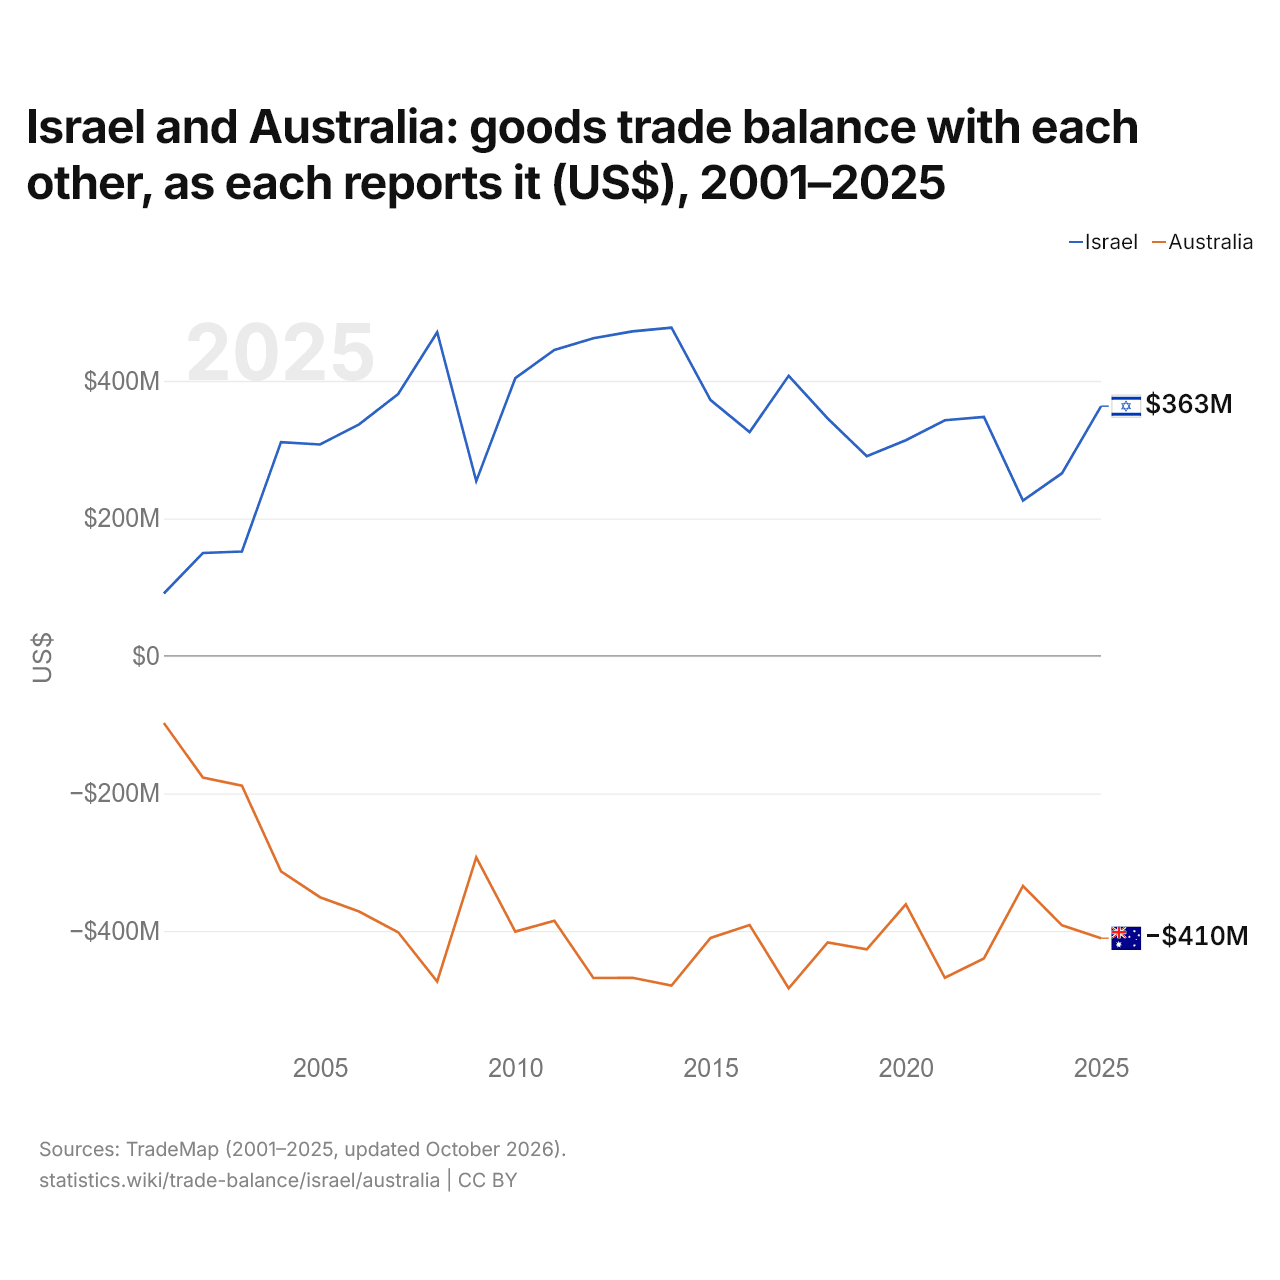
Israël et l'Australie : solde de leur commerce de biens bilatéral, selon chacun ($ US), 2001–2025
| Année | $ US | |
|---|---|---|
| Israël | Australie | |
| 2025 | 363 199 000 $ US | −410 459 000 $ US |
| 2024 | 265 742 000 $ US | −391 814 000 $ US |
| 2023 | 225 888 000 $ US | −334 500 000 $ US |
| 2022 | 347 556 000 $ US | −439 843 000 $ US |
| 2021 | 342 762 000 $ US | −468 009 000 $ US |
| 2020 | 313 662 000 $ US | −361 223 000 $ US |
| 2019 | 290 432 000 $ US | −426 717 000 $ US |
| 2018 | 345 360 000 $ US | −416 467 000 $ US |
| 2017 | 407 326 000 $ US | −483 310 000 $ US |
| 2016 | 325 533 000 $ US | −391 259 000 $ US |
| 2015 | 371 978 000 $ US | −410 089 000 $ US |
| 2014 | 477 297 000 $ US | −479 274 000 $ US |
| 2013 | 471 926 000 $ US | −467 930 000 $ US |
| 2012 | 461 983 000 $ US | −468 291 000 $ US |
| 2011 | 444 883 000 $ US | −385 186 000 $ US |
| 2010 | 403 841 000 $ US | −400 944 000 $ US |
| 2009 | 254 143 000 $ US | −293 045 000 $ US |
| 2008 | 470 715 000 $ US | −473 430 000 $ US |
| 2007 | 380 905 000 $ US | −401 801 000 $ US |
| 2006 | 336 765 000 $ US | −371 715 000 $ US |
| 2005 | 307 446 000 $ US | −350 887 000 $ US |
| 2004 | 310 972 000 $ US | −313 248 000 $ US |
| 2003 | 151 810 000 $ US | −188 745 000 $ US |
| 2002 | 149 692 000 $ US | −176 848 000 $ US |
| 2001 | 90 754 000 $ US | −97 444 000 $ US |
En 2025, selon Israël, son commerce de biens avec l'Australie affichait un excédent de 363 millions de dollars ; selon l'Australie, son commerce de biens avec Israël affichait un déficit de 410 millions de dollars. En 2001, les chiffres étaient un excédent de 90,8 millions de dollars pour Israël et un déficit de 97,4 millions de dollars pour l'Australie.
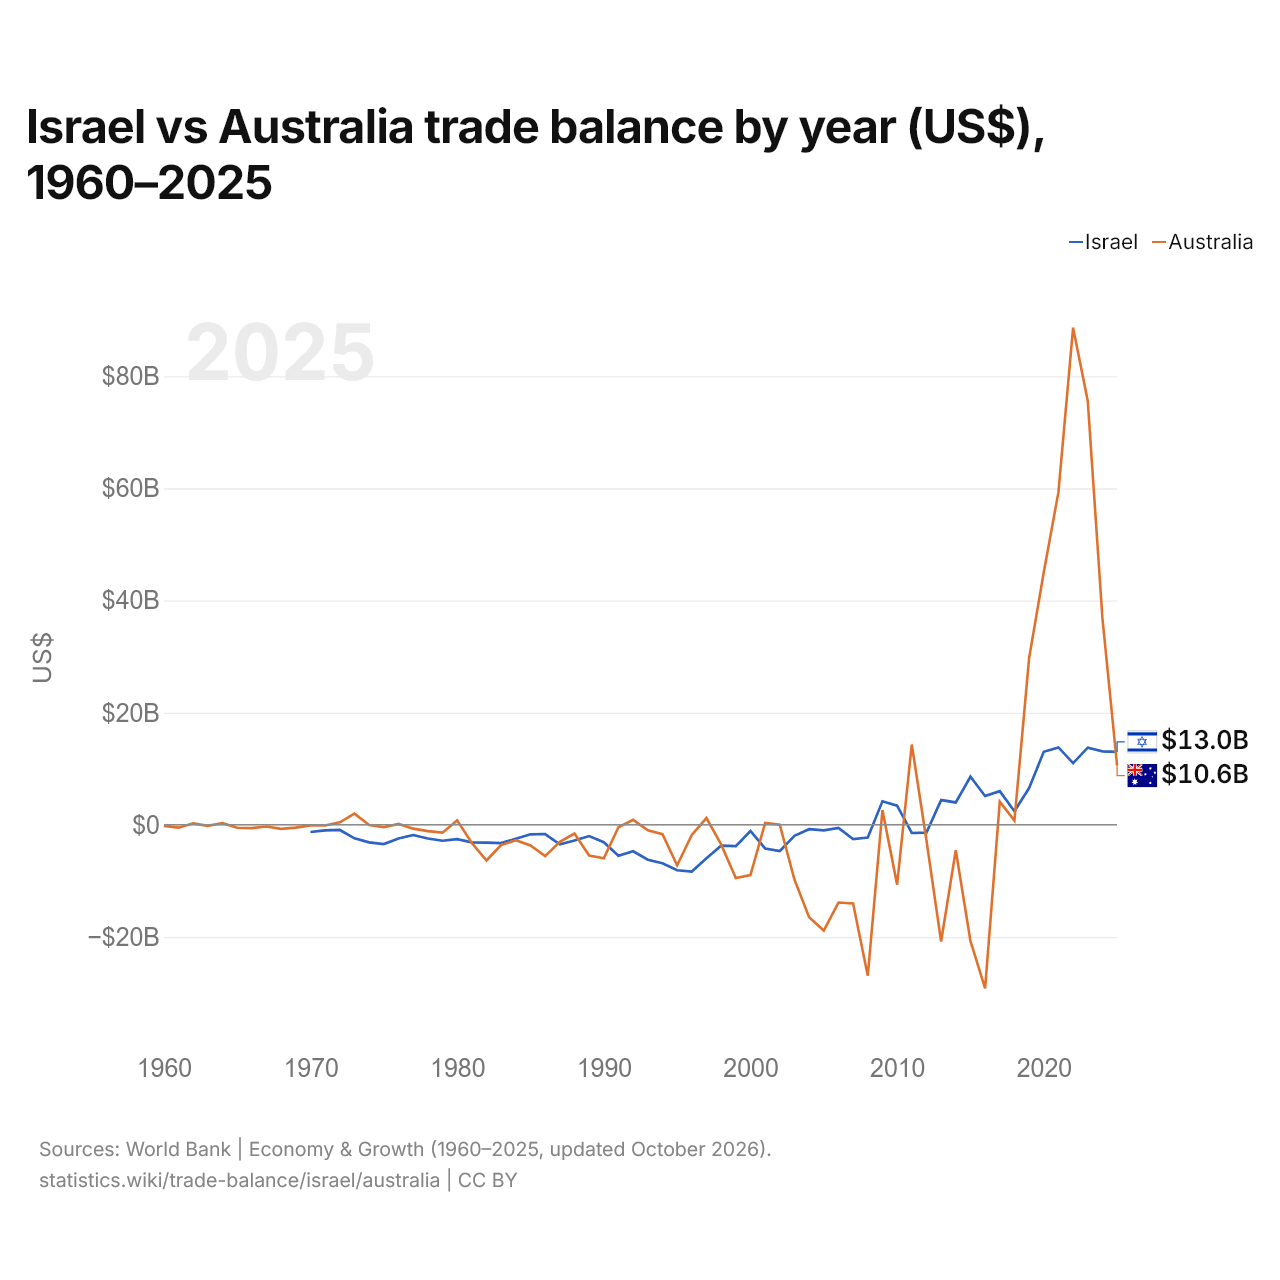
Israël vs Australie : balance commerciale par année ($ US), 1960–2025
| Année | $ US | |
|---|---|---|
 Israël |
 Australie |
|
| 2025 | 12 994 365 505 $ US | 10 564 991 460 $ US |
| 2024 | 13 100 279 099 $ US | 36 856 480 140 $ US |
| 2023 | 13 754 663 733 $ US | 75 583 868 406 $ US |
| 2022 | 11 000 808 302 $ US | 88 654 491 787 $ US |
| 2021 | 13 804 496 055 $ US | 59 325 202 688 $ US |
| 2020 | 13 021 165 408 $ US | 45 020 248 017 $ US |
| 2019 | 6 557 503 906 $ US | 29 690 840 211 $ US |
| 2018 | 2 413 018 727 $ US | 744 116 826 $ US |
| 2017 | 6 004 796 901 $ US | 4 102 721 900 $ US |
| 2016 | 5 128 475 225 $ US | −29 164 313 043 $ US |
| 2015 | 8 575 319 326 $ US | −20 697 527 562 $ US |
| 2014 | 3 984 226 053 $ US | −4 534 241 834 $ US |
| 2013 | 4 406 103 796 $ US | −20 813 947 643 $ US |
| 2012 | −1 392 248 402 $ US | −2 754 284 041 $ US |
| 2011 | −1 462 187 515 $ US | 14 312 855 739 $ US |
| 2010 | 3 412 251 219 $ US | −10 673 454 648 $ US |
| 2009 | 4 198 677 110 $ US | 2 610 816 112 $ US |
| 2008 | −2 287 048 495 $ US | −26 920 535 671 $ US |
| 2007 | −2 539 773 861 $ US | −14 030 776 478 $ US |
| 2006 | −575 153 283 $ US | −13 863 452 925 $ US |
| 2005 | −1 009 500 635 $ US | −18 867 201 155 $ US |
| 2004 | −793 186 301 $ US | −16 501 636 079 $ US |
| 2003 | −1 975 804 879 $ US | −9 762 376 238 $ US |
| 2002 | −4 669 753 894 $ US | 16 743 083 $ US |
| 2001 | −4 222 578 168 $ US | 326 284 935 $ US |
| 2000 | −1 098 518 628 $ US | −8 967 396 083 $ US |
| 1999 | −3 810 722 999 $ US | −9 508 710 365 $ US |
| 1998 | −3 730 624 984 $ US | −3 507 427 254 $ US |
| 1997 | −5 975 502 116 $ US | 1 194 238 231 $ US |
| 1996 | −8 351 877 056 $ US | −1 817 145 814 $ US |
| 1995 | −8 115 948 262 $ US | −7 226 017 226 $ US |
| 1994 | −6 867 235 894 $ US | −1 661 016 949 $ US |
| 1993 | −6 232 770 220 $ US | −999 859 472 $ US |
| 1992 | −4 720 523 362 $ US | 885 181 705 $ US |
| 1991 | −5 509 077 267 $ US | −431 670 147 $ US |
| 1990 | −3 103 552 723 $ US | −5 989 166 711 $ US |
| 1989 | −2 010 870 382 $ US | −5 487 302 420 $ US |
| 1988 | −2 800 375 258 $ US | −1 557 034 010 $ US |
| 1987 | −3 498 185 125 $ US | −3 024 086 818 $ US |
| 1986 | −1 649 481 113 $ US | −5 591 074 426 $ US |
| 1985 | −1 698 280 601 $ US | −3 693 359 853 $ US |
| 1984 | −2 488 666 439 $ US | −2 760 339 500 $ US |
| 1983 | −3 259 483 986 $ US | −3 597 492 611 $ US |
| 1982 | −3 188 683 128 $ US | −6 378 682 555 $ US |
| 1981 | −3 131 228 070 $ US | −3 235 806 339 $ US |
| 1980 | −2 559 607 843 $ US | 788 857 939 $ US |
| 1979 | −2 851 200 000 $ US | −1 412 018 630 $ US |
| 1978 | −2 447 647 059 $ US | −1 142 531 028 $ US |
| 1977 | −1 834 000 000 $ US | −695 113 558 $ US |
| 1976 | −2 433 750 000 $ US | 146 216 890 $ US |
| 1975 | −3 438 333 333 $ US | −441 076 062 $ US |
| 1974 | −3 132 500 000 $ US | −57 479 735 $ US |
| 1973 | −2 412 500 000 $ US | 1 997 437 540 $ US |
| 1972 | −925 000 000 $ US | 442 757 009 $ US |
| 1971 | −1 000 000 000 $ US | −124 320 020 $ US |
| 1970 | −1 283 333 333 $ US | −100 800 016 $ US |
| 1969 | - | −505 120 081 $ US |
| 1968 | - | −714 560 114 $ US |
| 1967 | - | −306 880 049 $ US |
| 1966 | - | −599 200 096 $ US |
| 1965 | - | −530 880 085 $ US |
| 1964 | - | 278 880 045 $ US |
| 1963 | - | −178 080 028 $ US |
| 1962 | - | 260 960 042 $ US |
| 1961 | - | −515 200 082 $ US |
| 1960 | - | −198 240 032 $ US |
En 2025, la balance commerciale d'Israël affichait un excédent de 13 milliards de dollars et celle de l'Australie un excédent de 10,6 milliards de dollars ; l'excédent d'Israël était plus grand de 23 %. En 1970, la balance commerciale d'Israël affichait un déficit de 1,28 milliard de dollars et celle de l'Australie un déficit de 101 millions de dollars.
De 1970 à 2025, la balance commerciale d'Israël a été excédentaire pendant 15 des 56 années, et celle de l'Australie pendant 19. Les balances commerciales d'Israël et de l'Australie ont été déficitaires en même temps pendant 32 de ces années, la dernière fois en 2012.
Israël vs Australie : chiffres de la balance commerciale
|
Israël
|
Australie
|
|
|---|---|---|
| Biens et services, $ US | +13,0 Md $US (2025) | +10,6 Md $US (2025) |
| % du PIB | +2,1 % (2025) | +0,6 % (2025) |
| Années d'excédent depuis 2000 | 15 sur 26 | 13 sur 26 |
| Solde des biens entre les deux, chiffres propres | +363 M $US (2025) | −410 M $US (2025) |
| Premier excédent en biens avec | États-Unis (+6,12 Md $US, 2025) | Chine (+24,1 Md $US, 2025) |
| Premier déficit en biens avec | Chine (−18,0 Md $US, 2025) | Allemagne (−8,75 Md $US, 2025) |
Comparer la balance commerciale de 2 pays au choix
Sources :
- Banque mondiale | Économie et croissance (1960–2025, mis à jour en octobre 2026)
- TradeMap (2001–2025, mis à jour en octobre 2026)
Creative Commons Attribution (CC BY) : vous pouvez copier, partager, adapter et réutiliser ce contenu, y compris à des fins commerciales, à condition de citer statistics.wiki et d’indiquer les modifications apportées. Les sources citées ci-dessus peuvent avoir leurs propres conditions de licence.