
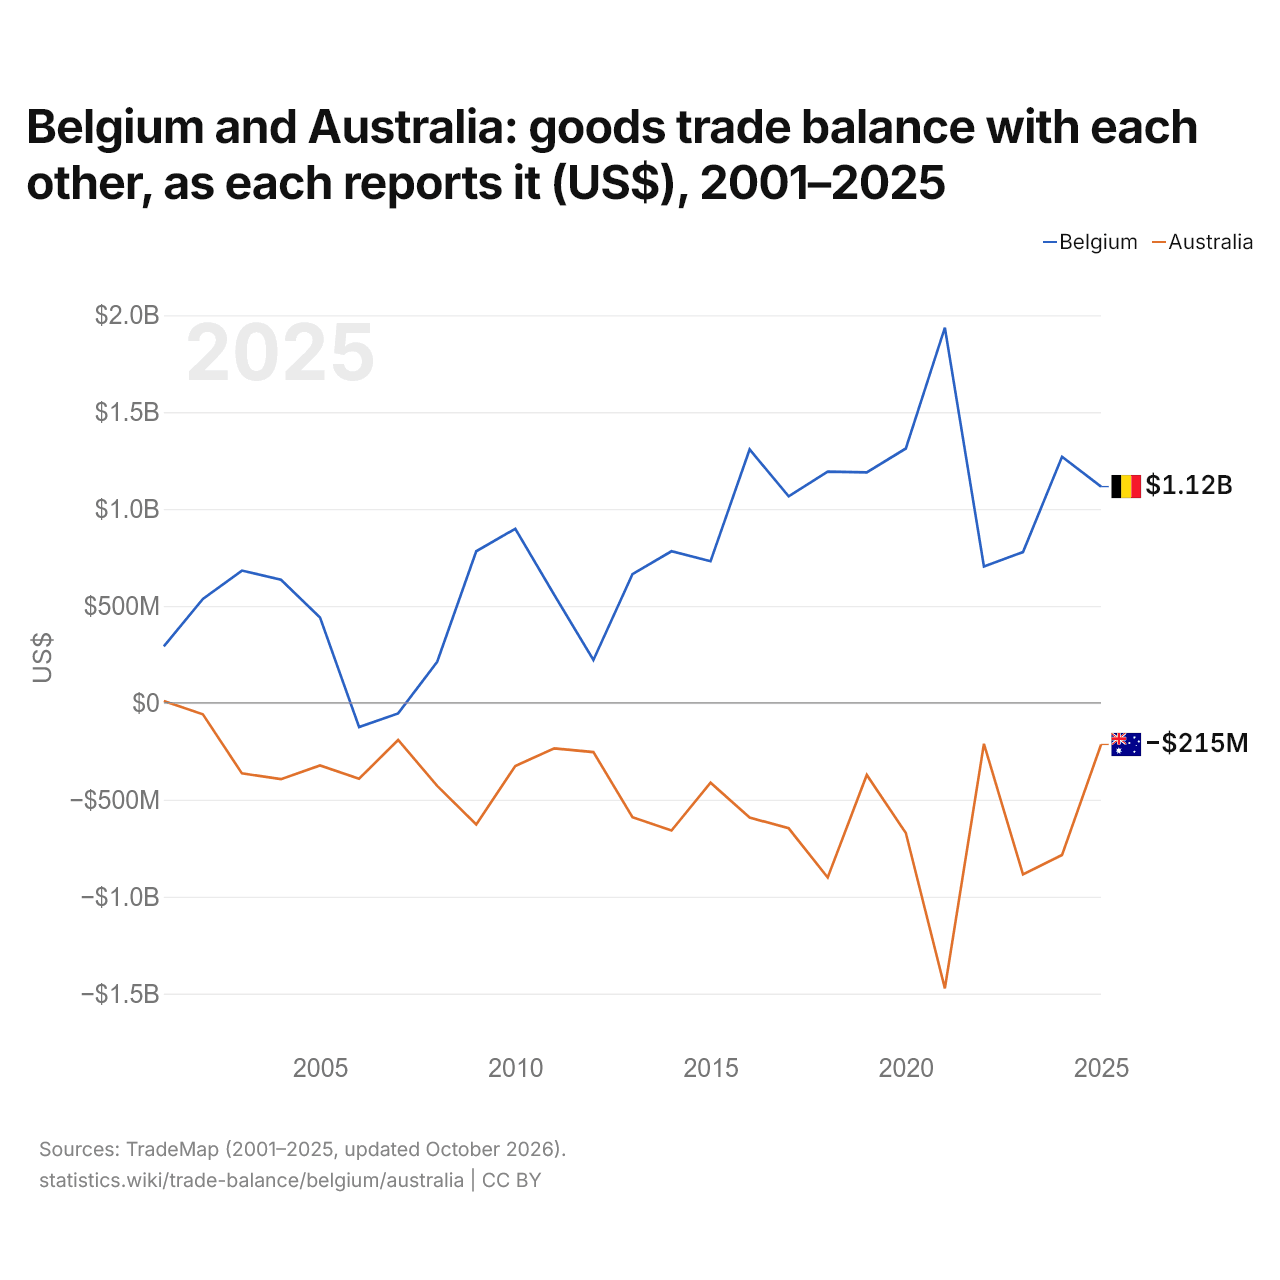
La Belgique et l'Australie : solde de leur commerce de biens bilatéral, selon chacun ($ US), 2001–2025
| Année | $ US | |
|---|---|---|
| Belgique | Australie | |
| 2025 | 1 115 795 000 $ US | −214 591 000 $ US |
| 2024 | 1 269 876 000 $ US | −784 995 000 $ US |
| 2023 | 777 739 000 $ US | −885 459 000 $ US |
| 2022 | 703 930 000 $ US | −211 358 000 $ US |
| 2021 | 1 935 587 000 $ US | −1 472 791 000 $ US |
| 2020 | 1 312 401 000 $ US | −671 396 000 $ US |
| 2019 | 1 188 930 000 $ US | −371 746 000 $ US |
| 2018 | 1 192 691 000 $ US | −901 078 000 $ US |
| 2017 | 1 065 405 000 $ US | −647 215 000 $ US |
| 2016 | 1 307 442 000 $ US | −591 895 000 $ US |
| 2015 | 730 938 000 $ US | −411 863 000 $ US |
| 2014 | 782 240 000 $ US | −658 867 000 $ US |
| 2013 | 664 192 000 $ US | −590 112 000 $ US |
| 2012 | 220 757 000 $ US | −253 854 000 $ US |
| 2011 | 556 527 000 $ US | −234 806 000 $ US |
| 2010 | 897 990 000 $ US | −325 580 000 $ US |
| 2009 | 782 254 000 $ US | −628 068 000 $ US |
| 2008 | 211 712 000 $ US | −428 402 000 $ US |
| 2007 | −54 517 000 $ US | −191 267 000 $ US |
| 2006 | −124 936 000 $ US | −391 676 000 $ US |
| 2005 | 440 096 000 $ US | −322 961 000 $ US |
| 2004 | 635 578 000 $ US | −393 879 000 $ US |
| 2003 | 682 477 000 $ US | −363 919 000 $ US |
| 2002 | 536 285 000 $ US | −59 111 000 $ US |
| 2001 | 291 059 000 $ US | 9 076 000 $ US |
En 2025, selon la Belgique, son commerce de biens avec l'Australie affichait un excédent de 1,12 milliard de dollars ; selon l'Australie, son commerce de biens avec la Belgique affichait un déficit de 215 millions de dollars. En 2001, les chiffres étaient un excédent de 291 millions de dollars pour la Belgique et un excédent de 9,08 millions de dollars pour l'Australie.
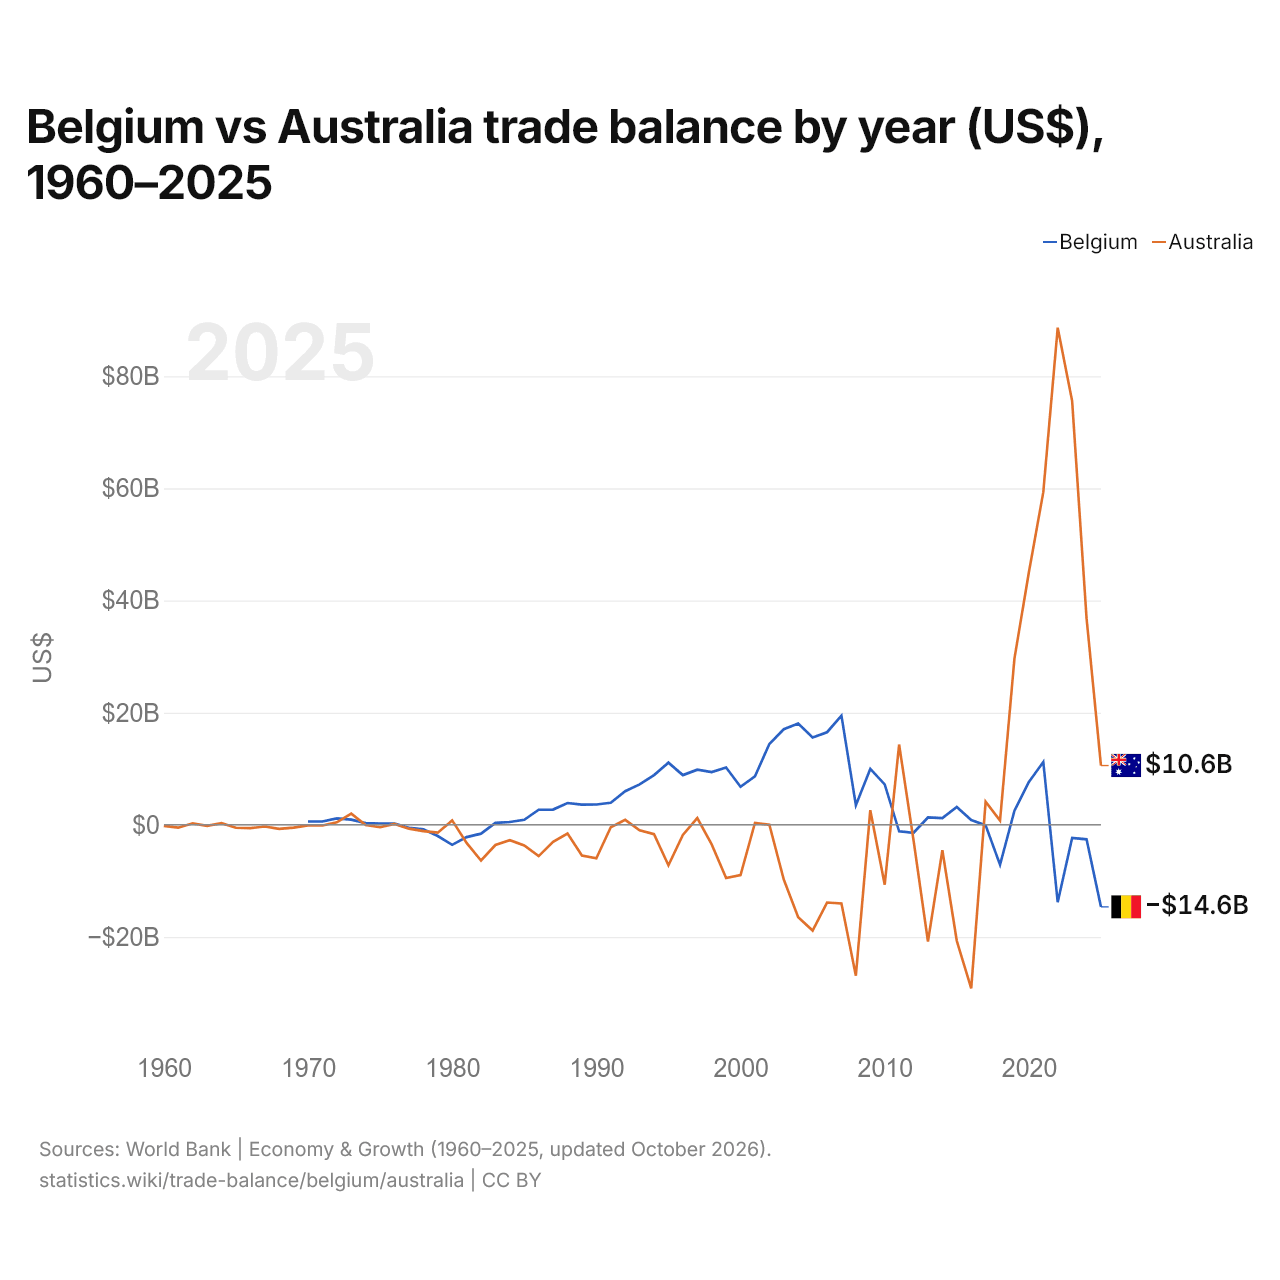
Belgique vs Australie : balance commerciale par année ($ US), 1960–2025
| Année | $ US | |
|---|---|---|
 Belgique |
 Australie |
|
| 2025 | −14 637 349 567 $ US | 10 564 991 460 $ US |
| 2024 | −2 589 378 795 $ US | 36 856 480 140 $ US |
| 2023 | −2 348 299 205 $ US | 75 583 868 406 $ US |
| 2022 | −13 809 679 840 $ US | 88 654 491 787 $ US |
| 2021 | 11 185 411 660 $ US | 59 325 202 688 $ US |
| 2020 | 7 646 774 510 $ US | 45 020 248 017 $ US |
| 2019 | 2 519 265 437 $ US | 29 690 840 211 $ US |
| 2018 | −7 117 140 449 $ US | 744 116 826 $ US |
| 2017 | −76 479 416 $ US | 4 102 721 900 $ US |
| 2016 | 846 891 572 $ US | −29 164 313 043 $ US |
| 2015 | 3 166 438 839 $ US | −20 697 527 562 $ US |
| 2014 | 1 191 266 653 $ US | −4 534 241 834 $ US |
| 2013 | 1 306 071 280 $ US | −20 813 947 643 $ US |
| 2012 | −1 422 261 060 $ US | −2 754 284 041 $ US |
| 2011 | −1 174 531 842 $ US | 14 312 855 739 $ US |
| 2010 | 7 194 531 778 $ US | −10 673 454 648 $ US |
| 2009 | 9 960 978 144 $ US | 2 610 816 112 $ US |
| 2008 | 3 480 542 817 $ US | −26 920 535 671 $ US |
| 2007 | 19 473 396 555 $ US | −14 030 776 478 $ US |
| 2006 | 16 503 842 056 $ US | −13 863 452 925 $ US |
| 2005 | 15 569 789 759 $ US | −18 867 201 155 $ US |
| 2004 | 18 069 920 173 $ US | −16 501 636 079 $ US |
| 2003 | 17 041 157 540 $ US | −9 762 376 238 $ US |
| 2002 | 14 411 205 478 $ US | 16 743 083 $ US |
| 2001 | 8 634 316 460 $ US | 326 284 935 $ US |
| 2000 | 6 783 287 644 $ US | −8 967 396 083 $ US |
| 1999 | 10 216 533 029 $ US | −9 508 710 365 $ US |
| 1998 | 9 409 313 181 $ US | −3 507 427 254 $ US |
| 1997 | 9 815 741 994 $ US | 1 194 238 231 $ US |
| 1996 | 8 856 286 645 $ US | −1 817 145 814 $ US |
| 1995 | 11 089 490 969 $ US | −7 226 017 226 $ US |
| 1994 | 8 858 973 957 $ US | −1 661 016 949 $ US |
| 1993 | 7 197 266 791 $ US | −999 859 472 $ US |
| 1992 | 5 983 582 183 $ US | 885 181 705 $ US |
| 1991 | 3 934 812 758 $ US | −431 670 147 $ US |
| 1990 | 3 612 875 423 $ US | −5 989 166 711 $ US |
| 1989 | 3 607 222 563 $ US | −5 487 302 420 $ US |
| 1988 | 3 884 174 438 $ US | −1 557 034 010 $ US |
| 1987 | 2 713 639 114 $ US | −3 024 086 818 $ US |
| 1986 | 2 687 310 818 $ US | −5 591 074 426 $ US |
| 1985 | 890 002 718 $ US | −3 693 359 853 $ US |
| 1984 | 495 069 813 $ US | −2 760 339 500 $ US |
| 1983 | 344 979 882 $ US | −3 597 492 611 $ US |
| 1982 | −1 582 876 567 $ US | −6 378 682 555 $ US |
| 1981 | −2 193 369 187 $ US | −3 235 806 339 $ US |
| 1980 | −3 577 711 408 $ US | 788 857 939 $ US |
| 1979 | −2 010 039 901 $ US | −1 412 018 630 $ US |
| 1978 | −799 154 605 $ US | −1 142 531 028 $ US |
| 1977 | −549 247 046 $ US | −695 113 558 $ US |
| 1976 | 208 368 861 $ US | 146 216 890 $ US |
| 1975 | 202 501 919 $ US | −441 076 062 $ US |
| 1974 | 288 928 128 $ US | −57 479 735 $ US |
| 1973 | 916 582 488 $ US | 1 997 437 540 $ US |
| 1972 | 1 138 651 819 $ US | 442 757 009 $ US |
| 1971 | 581 774 525 $ US | −124 320 020 $ US |
| 1970 | 583 597 418 $ US | −100 800 016 $ US |
| 1969 | - | −505 120 081 $ US |
| 1968 | - | −714 560 114 $ US |
| 1967 | - | −306 880 049 $ US |
| 1966 | - | −599 200 096 $ US |
| 1965 | - | −530 880 085 $ US |
| 1964 | - | 278 880 045 $ US |
| 1963 | - | −178 080 028 $ US |
| 1962 | - | 260 960 042 $ US |
| 1961 | - | −515 200 082 $ US |
| 1960 | - | −198 240 032 $ US |
En 2025, la balance commerciale de la Belgique affichait un déficit de 14,6 milliards de dollars et celle de l'Australie un excédent de 10,6 milliards de dollars. En 1970, la balance commerciale de la Belgique affichait un excédent de 584 millions de dollars et celle de l'Australie un déficit de 101 millions de dollars.
De 1970 à 2025, la balance commerciale de la Belgique a été excédentaire pendant 42 des 56 années, et celle de l'Australie pendant 19. Les balances commerciales de la Belgique et de l'Australie ont été déficitaires en même temps pendant 6 de ces années, la dernière fois en 2012.
Belgique vs Australie : chiffres de la balance commerciale
|
Belgique
|
Australie
|
|
|---|---|---|
| Biens et services, $ US | −14,6 Md $US (2025) | +10,6 Md $US (2025) |
| % du PIB | −2,0 % (2025) | +0,6 % (2025) |
| Années d'excédent depuis 2000 | 18 sur 26 | 13 sur 26 |
| Solde des biens entre les deux, chiffres propres | +1,12 Md $US (2025) | −215 M $US (2025) |
| Premier excédent en biens avec | Allemagne (+42,1 Md $US, 2025) | Chine (+24,1 Md $US, 2025) |
| Premier déficit en biens avec | Pays-Bas (−33,2 Md $US, 2025) | Allemagne (−8,75 Md $US, 2025) |
Comparer la balance commerciale de 2 pays au choix
Sources :
- Banque mondiale | Économie et croissance (1960–2025, mis à jour en octobre 2026)
- TradeMap (2001–2025, mis à jour en octobre 2026)
Creative Commons Attribution (CC BY) : vous pouvez copier, partager, adapter et réutiliser ce contenu, y compris à des fins commerciales, à condition de citer statistics.wiki et d’indiquer les modifications apportées. Les sources citées ci-dessus peuvent avoir leurs propres conditions de licence.