
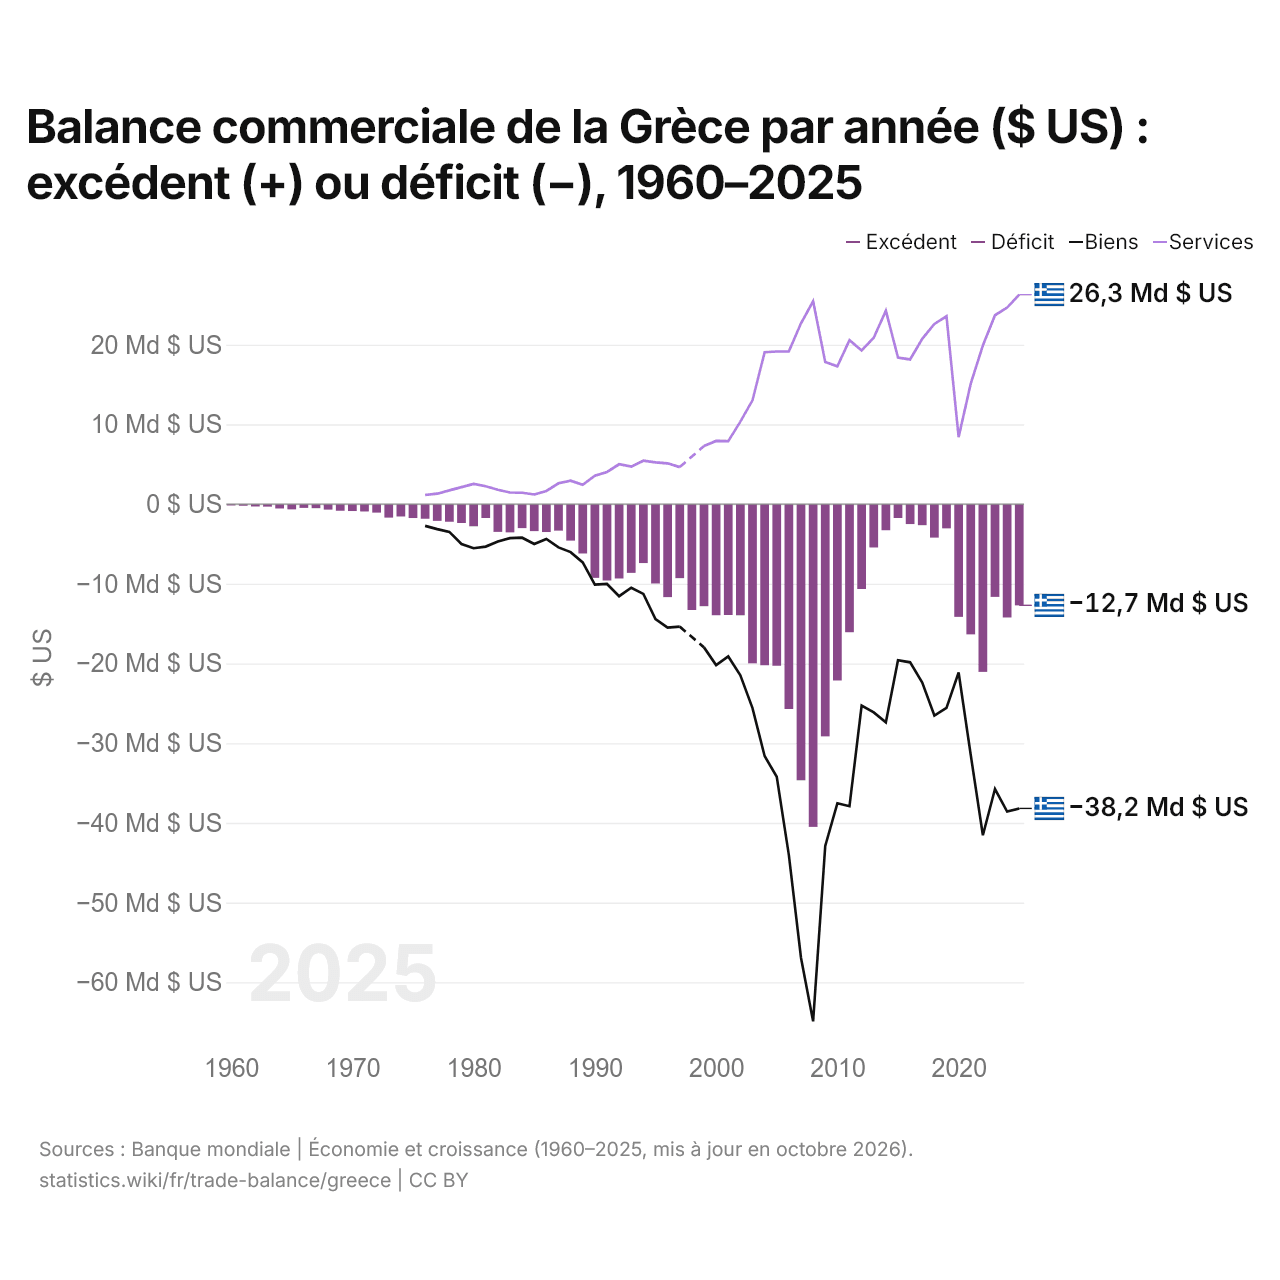
Balance commerciale de la Grèce par année ($ US) : excédent (+) ou déficit (−), 1960–2025
| Année | $ US | ||
|---|---|---|---|
| Biens et services | Biens | Services | |
| 2025 | −12 707 412 947 $ US | −38 187 847 150 $ US | 26 271 234 943 $ US |
| 2024 | −14 229 355 722 $ US | −38 580 996 406 $ US | 24 653 598 393 $ US |
| 2023 | −11 645 410 170 $ US | −35 750 502 708 $ US | 23 684 473 204 $ US |
| 2022 | −21 054 805 057 $ US | −41 552 978 623 $ US | 19 883 591 903 $ US |
| 2021 | −16 354 989 779 $ US | −31 479 622 156 $ US | 15 109 234 797 $ US |
| 2020 | −14 147 238 721 $ US | −21 135 301 378 $ US | 8 398 477 393 $ US |
| 2019 | −3 046 393 519 $ US | −25 572 170 056 $ US | 23 564 168 263 $ US |
| 2018 | −4 215 576 552 $ US | −26 532 107 327 $ US | 22 596 859 051 $ US |
| 2017 | −2 652 600 981 $ US | −22 389 144 869 $ US | 20 732 855 226 $ US |
| 2016 | −2 508 002 256 $ US | −19 858 204 214 $ US | 18 144 712 422 $ US |
| 2015 | −1 749 018 369 $ US | −19 602 740 554 $ US | 18 382 683 357 $ US |
| 2014 | −3 282 821 090 $ US | −27 376 500 768 $ US | 24 264 627 910 $ US |
| 2013 | −5 441 575 855 $ US | −26 133 877 463 $ US | 20 861 267 002 $ US |
| 2012 | −10 658 447 508 $ US | −25 272 646 680 $ US | 19 276 546 870 $ US |
| 2011 | −16 081 115 666 $ US | −37 909 431 516 $ US | 20 560 212 836 $ US |
| 2010 | −22 127 160 380 $ US | −37 541 321 400 $ US | 17 290 346 080 $ US |
| 2009 | −29 147 253 654 $ US | −42 891 859 290 $ US | 17 814 338 515 $ US |
| 2008 | −40 504 309 988 $ US | −64 899 521 188 $ US | 25 440 489 810 $ US |
| 2007 | −34 657 059 799 $ US | −56 914 603 183 $ US | 22 680 566 756 $ US |
| 2006 | −25 709 429 314 $ US | −44 050 578 972 $ US | 19 153 567 854 $ US |
| 2005 | −20 282 967 283 $ US | −34 218 738 826 $ US | 19 138 857 373 $ US |
| 2004 | −20 223 980 839 $ US | −31 611 218 931 $ US | 19 042 027 895 $ US |
| 2003 | −19 983 183 555 $ US | −25 597 543 053 $ US | 13 016 781 795 $ US |
| 2002 | −13 954 269 268 $ US | −21 490 270 103 $ US | 10 343 178 300 $ US |
| 2001 | −13 915 630 625 $ US | −19 118 732 705 $ US | 7 895 193 498 $ US |
| 2000 | −13 946 980 817 $ US | −20 200 797 572 $ US | 7 916 566 894 $ US |
| 1999 | −12 813 831 299 $ US | −17 982 368 580 $ US | 7 288 116 828 $ US |
| 1998 | −13 288 436 527 $ US | - | - |
| 1997 | −9 294 399 101 $ US | −15 375 000 000 $ US | 4 637 000 000 $ US |
| 1996 | −11 676 928 086 $ US | −15 505 000 000 $ US | 5 110 000 000 $ US |
| 1995 | −9 969 235 182 $ US | −14 425 000 000 $ US | 5 237 000 000 $ US |
| 1994 | −7 404 841 292 $ US | −11 273 000 000 $ US | 5 439 000 000 $ US |
| 1993 | −8 632 508 918 $ US | −10 499 000 000 $ US | 4 693 000 000 $ US |
| 1992 | −9 333 489 453 $ US | −11 561 000 000 $ US | 4 996 000 000 $ US |
| 1991 | −9 591 977 940 $ US | −10 021 630 000 $ US | 4 028 930 000 $ US |
| 1990 | −9 259 318 573 $ US | −10 106 000 000 $ US | 3 560 000 000 $ US |
| 1989 | −6 197 673 101 $ US | −7 327 000 000 $ US | 2 413 000 000 $ US |
| 1988 | −4 583 374 970 $ US | −6 027 000 000 $ US | 2 930 000 000 $ US |
| 1987 | −3 334 969 804 $ US | −5 435 000 000 $ US | 2 606 000 000 $ US |
| 1986 | −3 508 804 771 $ US | −4 375 000 000 $ US | 1 639 000 000 $ US |
| 1985 | −3 391 174 439 $ US | −5 013 000 000 $ US | 1 199 000 000 $ US |
| 1984 | −3 019 446 796 $ US | −4 222 000 000 $ US | 1 415 000 000 $ US |
| 1983 | −3 547 128 483 $ US | −4 270 000 000 $ US | 1 446 000 000 $ US |
| 1982 | −3 496 831 633 $ US | −4 699 000 000 $ US | 1 798 000 000 $ US |
| 1981 | −1 750 645 756 $ US | −5 337 000 000 $ US | 2 233 000 000 $ US |
| 1980 | −2 790 655 476 $ US | −5 542 000 000 $ US | 2 519 000 000 $ US |
| 1979 | −2 369 871 205 $ US | −5 006 000 000 $ US | 2 128 000 000 $ US |
| 1978 | −2 220 936 920 $ US | −3 494 000 000 $ US | 1 720 000 000 $ US |
| 1977 | −2 108 233 117 $ US | −3 145 000 000 $ US | 1 304 000 000 $ US |
| 1976 | −1 838 339 552 $ US | −2 739 000 000 $ US | 1 131 000 000 $ US |
| 1975 | −1 752 061 637 $ US | - | - |
| 1974 | −1 557 784 091 $ US | - | - |
| 1973 | −1 692 255 466 $ US | - | - |
| 1972 | −1 070 897 727 $ US | - | - |
| 1971 | −923 386 364 $ US | - | - |
| 1970 | −874 897 727 $ US | - | - |
| 1969 | −835 632 549 $ US | - | - |
| 1968 | −701 763 238 $ US | - | - |
| 1967 | −516 383 887 $ US | - | - |
| 1966 | −480 389 330 $ US | - | - |
| 1965 | −659 771 481 $ US | - | - |
| 1964 | −553 627 860 $ US | - | - |
| 1963 | −326 245 395 $ US | - | - |
| 1962 | −300 087 154 $ US | - | - |
| 1961 | −200 440 500 $ US | - | - |
| 1960 | −175 656 618 $ US | - | - |
En 2025, la balance commerciale de la Grèce affichait un déficit de 12,7 milliards de dollars, contre un déficit de 176 millions de dollars en 1960. Le plus grand déficit a été de 40,5 milliards de dollars, en 2008. La balance commerciale de la Grèce est déficitaire chaque année depuis 1960.
En 2025, le solde commercial de la Grèce était le 36e plus élevé de 41 pays situés en Europe, où les soldes allaient d'un déficit de 56,8 milliards de dollars en Ukraine à un excédent de 290 milliards de dollars en Irlande. De 2016 à 2025, les soldes commerciaux de la Grèce ont totalisé un déficit de 103 milliards de dollars, contre un déficit de 189 milliards de dollars de 2006 à 2015. En 2025, les transactions courantes de la Grèce affichaient un déficit de 5,6 % du PIB.
Commerce de biens de la Grèce avec ses 10 principaux partenaires commerciaux, selon la Grèce, 2025
| Pays | Exportations vers | Importations depuis | Solde | |
|---|---|---|---|---|
 Allemagne |
4,28 Md $US | 10,7 Md $US | −6,41 Md $US | vs Allemagne |
 Italie |
5,02 Md $US | 8,42 Md $US | −3,40 Md $US | vs Italie |
 Chine |
787 M $US | 7,32 Md $US | −6,54 Md $US | |
 Pays-Bas |
1,55 Md $US | 5,73 Md $US | −4,18 Md $US | |
 Bulgarie |
3,57 Md $US | 3,28 Md $US | +291 M $US | vs Bulgarie |
 France |
1,75 Md $US | 4,61 Md $US | −2,86 Md $US | vs France |
 Espagne |
1,86 Md $US | 3,90 Md $US | −2,04 Md $US | vs Espagne |
 Turquie |
1,56 Md $US | 3,77 Md $US | −2,22 Md $US | vs Turquie |
 États-Unis |
2,71 Md $US | 2,56 Md $US | +157 M $US | |
 Royaume-Uni |
3,43 Md $US | 1,06 Md $US | +2,37 Md $US |
Balance commerciale de la Grèce : excédent (+) ou déficit (−)
Comparer la balance commerciale de la Grèce avec celle d'autres pays
Sources :
- TradeMap (2025, mis à jour en octobre 2026)
- Banque mondiale | Économie et croissance (1960–2025, mis à jour en octobre 2026)
Creative Commons Attribution (CC BY) : vous pouvez copier, partager, adapter et réutiliser ce contenu, y compris à des fins commerciales, à condition de citer statistics.wiki et d’indiquer les modifications apportées. Les sources citées ci-dessus peuvent avoir leurs propres conditions de licence.