
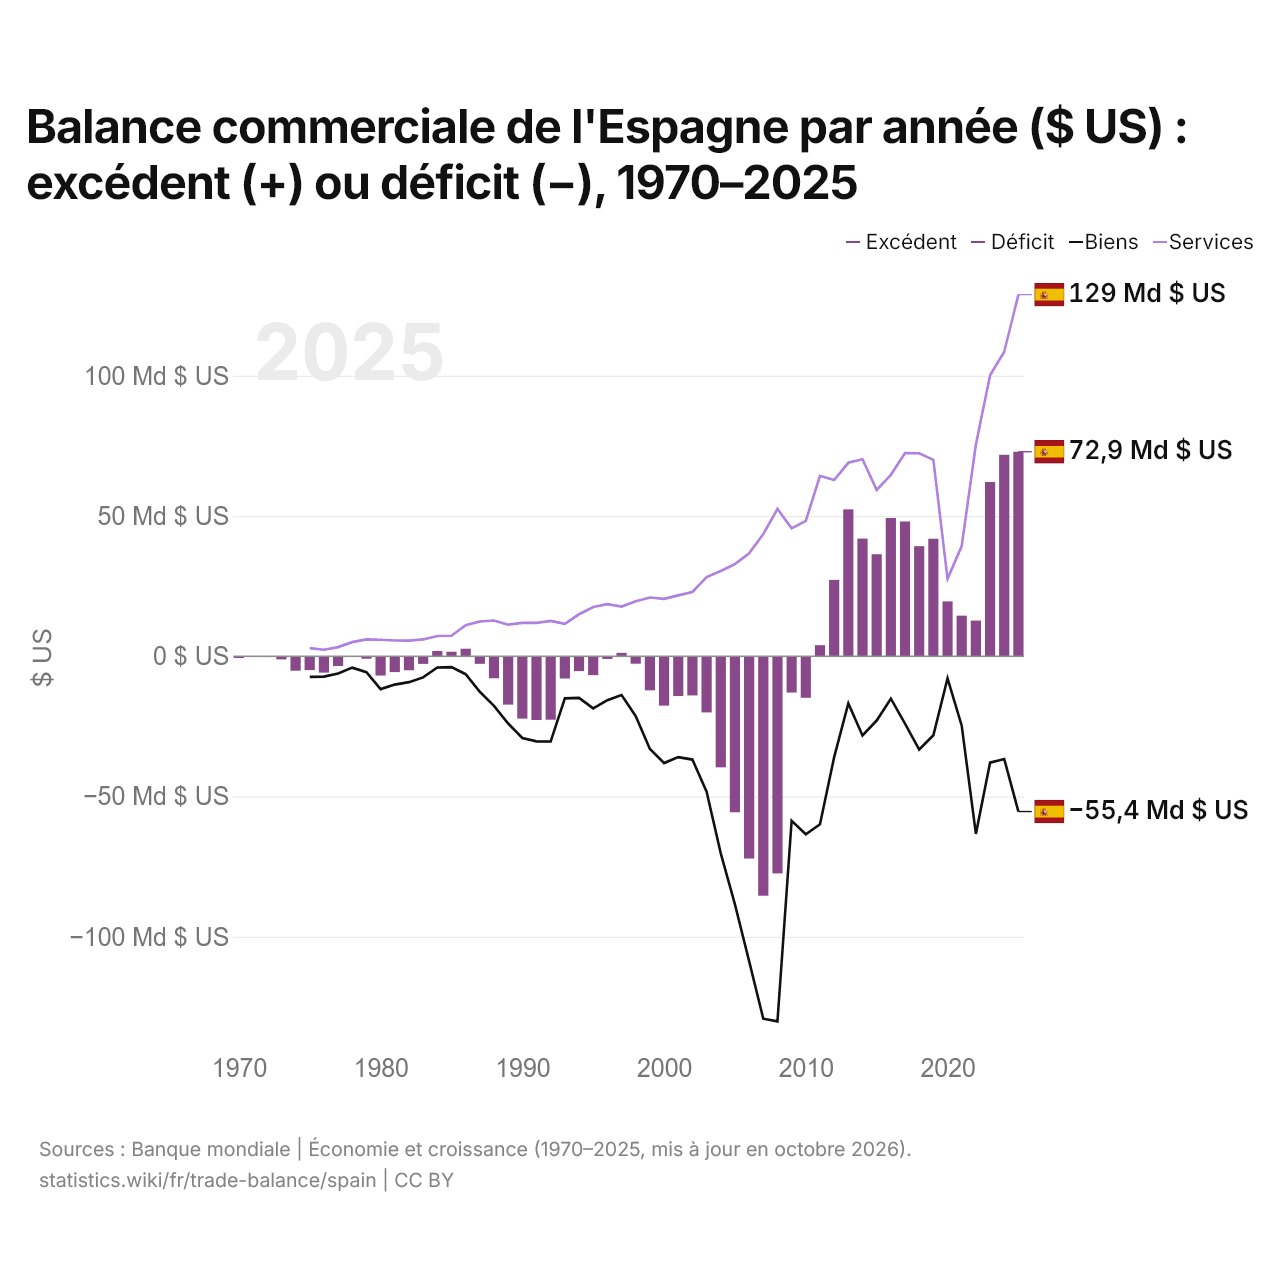
Balance commerciale de l'Espagne par année ($ US) : excédent (+) ou déficit (−), 1970–2025
| Année | $ US | ||
|---|---|---|---|
| Biens et services | Biens | Services | |
| 2025 | 72 905 382 033 $ US | −55 377 637 420 $ US | 128 903 543 096 $ US |
| 2024 | 71 813 779 341 $ US | −36 645 388 681 $ US | 108 563 722 942 $ US |
| 2023 | 62 117 801 378 $ US | −37 947 932 228 $ US | 100 153 472 890 $ US |
| 2022 | 12 715 562 305 $ US | −63 339 194 504 $ US | 75 447 506 741 $ US |
| 2021 | 14 460 183 031 $ US | −24 761 079 140 $ US | 39 295 383 057 $ US |
| 2020 | 19 552 112 993 $ US | −7 920 250 143 $ US | 27 570 150 168 $ US |
| 2019 | 41 892 975 106 $ US | −28 200 817 713 $ US | 70 015 614 829 $ US |
| 2018 | 39 230 127 861 $ US | −33 273 809 265 $ US | 72 377 276 231 $ US |
| 2017 | 48 023 876 493 $ US | −24 055 941 404 $ US | 72 433 967 611 $ US |
| 2016 | 49 290 395 615 $ US | −15 137 925 560 $ US | 64 663 530 256 $ US |
| 2015 | 36 369 832 555 $ US | −22 940 099 032 $ US | 59 283 174 335 $ US |
| 2014 | 41 951 397 767 $ US | −28 259 862 810 $ US | 70 249 745 529 $ US |
| 2013 | 52 337 147 571 $ US | −16 830 544 310 $ US | 68 970 087 332 $ US |
| 2012 | 27 224 671 957 $ US | −35 971 895 367 $ US | 62 819 576 926 $ US |
| 2011 | 3 942 017 276 $ US | −59 912 397 588 $ US | 64 316 734 173 $ US |
| 2010 | −14 818 860 900 $ US | −63 467 369 889 $ US | 48 256 395 232 $ US |
| 2009 | −12 958 923 482 $ US | −58 668 270 364 $ US | 45 599 656 215 $ US |
| 2008 | −77 429 392 408 $ US | −130 172 981 156 $ US | 52 487 504 530 $ US |
| 2007 | −85 367 077 063 $ US | −129 229 687 725 $ US | 43 562 119 373 $ US |
| 2006 | −72 139 174 807 $ US | −108 707 367 109 $ US | 36 658 690 403 $ US |
| 2005 | −55 631 984 710 $ US | −88 478 233 879 $ US | 32 859 578 093 $ US |
| 2004 | −39 615 800 979 $ US | −70 291 524 708 $ US | 30 396 090 623 $ US |
| 2003 | −20 017 014 300 $ US | −48 340 034 982 $ US | 28 227 072 503 $ US |
| 2002 | −13 991 654 416 $ US | −36 848 283 489 $ US | 22 882 798 356 $ US |
| 2001 | −14 189 458 605 $ US | −35 973 991 315 $ US | 21 709 161 063 $ US |
| 2000 | −17 606 826 022 $ US | −38 098 898 305 $ US | 20 450 993 792 $ US |
| 1999 | −12 163 706 600 $ US | −33 069 318 879 $ US | 20 923 373 583 $ US |
| 1998 | −2 663 993 763 $ US | −21 389 565 995 $ US | 19 580 106 699 $ US |
| 1997 | 1 209 090 909 $ US | −13 859 521 198 $ US | 17 688 199 354 $ US |
| 1996 | −973 335 085 $ US | −15 671 653 795 $ US | 18 556 471 889 $ US |
| 1995 | −6 745 396 317 $ US | −18 616 745 579 $ US | 17 526 688 865 $ US |
| 1994 | −5 306 615 327 $ US | −14 848 734 243 $ US | 14 950 870 740 $ US |
| 1993 | −7 943 935 155 $ US | −15 001 296 433 $ US | 11 546 917 322 $ US |
| 1992 | −22 619 393 792 $ US | −30 399 673 229 $ US | 12 586 823 131 $ US |
| 1991 | −22 740 254 604 $ US | −30 334 526 351 $ US | 11 908 361 553 $ US |
| 1990 | −22 235 288 932 $ US | −29 157 695 195 $ US | 11 882 493 409 $ US |
| 1989 | −17 259 685 172 $ US | −24 013 802 168 $ US | 11 241 953 854 $ US |
| 1988 | −7 858 501 643 $ US | −17 704 845 378 $ US | 12 725 920 193 $ US |
| 1987 | −2 712 726 048 $ US | −12 686 087 257 $ US | 12 394 655 813 $ US |
| 1986 | 2 681 646 667 $ US | −6 402 329 750 $ US | 11 057 596 182 $ US |
| 1985 | 1 600 854 207 $ US | −3 876 232 109 $ US | 7 288 540 603 $ US |
| 1984 | 1 872 076 175 $ US | −4 020 282 508 $ US | 7 199 922 572 $ US |
| 1983 | −2 730 429 234 $ US | −7 555 715 831 $ US | 5 978 518 478 $ US |
| 1982 | −5 009 245 797 $ US | −9 253 770 946 $ US | 5 588 535 652 $ US |
| 1981 | −5 669 717 066 $ US | −10 112 718 053 $ US | 5 616 527 726 $ US |
| 1980 | −6 898 052 913 $ US | −11 725 161 631 $ US | 5 860 889 114 $ US |
| 1979 | −885 949 430 $ US | −5 683 628 963 $ US | 6 000 985 353 $ US |
| 1978 | 78 546 007 $ US | −4 064 189 574 $ US | 5 011 621 293 $ US |
| 1977 | −3 503 969 332 $ US | −6 135 435 175 $ US | 3 256 508 821 $ US |
| 1976 | −5 842 516 787 $ US | −7 284 206 101 $ US | 2 298 214 441 $ US |
| 1975 | −4 959 394 203 $ US | −7 385 832 025 $ US | 2 895 186 070 $ US |
| 1974 | −5 167 078 166 $ US | - | - |
| 1973 | −1 140 005 711 $ US | - | - |
| 1972 | −288 646 130 $ US | - | - |
| 1971 | 68 340 120 $ US | - | - |
| 1970 | −634 228 667 $ US | - | - |
En 2025, la balance commerciale de l'Espagne affichait un excédent de 72,9 milliards de dollars, contre un déficit de 634 millions de dollars en 1970. Le plus grand déficit a été de 85,4 milliards de dollars, en 2007. La balance commerciale de l'Espagne est excédentaire chaque année depuis 2011. Le commerce de biens affichait un déficit de 55,4 milliards de dollars et celui de services un excédent de 129 milliards de dollars.
En 2025, le solde commercial de l'Espagne était le 5e plus élevé de 41 pays situés en Europe, où les soldes allaient d'un déficit de 56,8 milliards de dollars en Ukraine à un excédent de 290 milliards de dollars en Irlande. De 2016 à 2025, les soldes commerciaux de l'Espagne ont totalisé un excédent de 432 milliards de dollars, contre un déficit de 101 milliards de dollars de 2006 à 2015. En 2025, les transactions courantes de l'Espagne affichaient un excédent de 2,9 % du PIB.
Commerce de biens de l'Espagne avec ses 10 principaux partenaires commerciaux, selon l'Espagne, 2025
| Pays | Exportations vers | Importations depuis | Solde | |
|---|---|---|---|---|
 France |
61,3 Md $US | 41,5 Md $US | +19,7 Md $US | vs France |
 Allemagne |
43,4 Md $US | 55,3 Md $US | −11,9 Md $US | vs Allemagne |
 Italie |
34,9 Md $US | 34,8 Md $US | +102 M $US | vs Italie |
 Chine |
8,65 Md $US | 55,7 Md $US | −47,1 Md $US | |
 Portugal |
37,7 Md $US | 17,5 Md $US | +20,1 Md $US | vs Portugal |
 États-Unis |
18,2 Md $US | 33,5 Md $US | −15,3 Md $US | vs USA |
 Royaume-Uni |
27,5 Md $US | 12,0 Md $US | +15,5 Md $US | vs R.-U. |
 Pays-Bas |
15,5 Md $US | 23,4 Md $US | −7,84 Md $US | vs Pays-Bas |
 Belgique |
13,9 Md $US | 12,3 Md $US | +1,64 Md $US | vs Belgique |
 Maroc |
13,0 Md $US | 11,7 Md $US | +1,30 Md $US | vs Maroc |
Balance commerciale de l'Espagne : excédent (+) ou déficit (−)
Comparer la balance commerciale de l'Espagne avec celle d'autres pays
Sources :
- TradeMap (2025, mis à jour en octobre 2026)
- Banque mondiale | Économie et croissance (1970–2025, mis à jour en octobre 2026)
Creative Commons Attribution (CC BY) : vous pouvez copier, partager, adapter et réutiliser ce contenu, y compris à des fins commerciales, à condition de citer statistics.wiki et d’indiquer les modifications apportées. Les sources citées ci-dessus peuvent avoir leurs propres conditions de licence.