
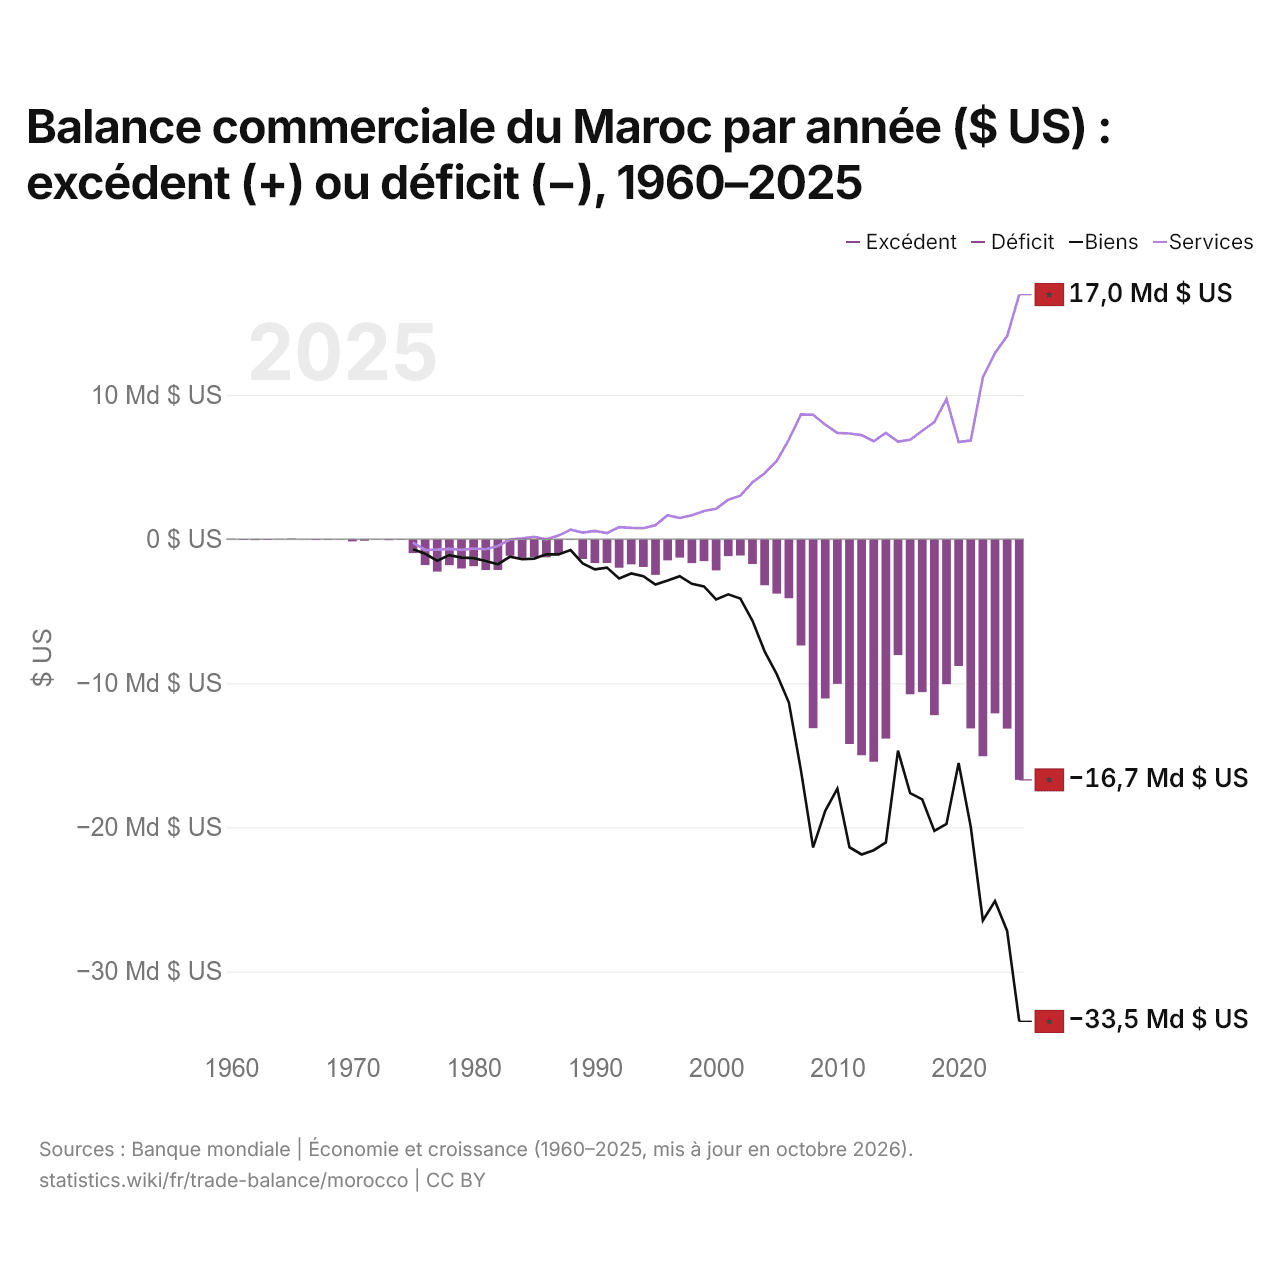
Balance commerciale du Maroc par année ($ US) : excédent (+) ou déficit (−), 1960–2025
| Année | $ US | ||
|---|---|---|---|
| Biens et services | Biens | Services | |
| 2025 | −16 711 370 159 $ US | −33 464 868 433 $ US | 16 957 784 811 $ US |
| 2024 | −13 154 358 447 $ US | −27 191 145 158 $ US | 14 087 558 969 $ US |
| 2023 | −12 095 698 963 $ US | −25 112 417 350 $ US | 12 921 362 143 $ US |
| 2022 | −15 070 969 799 $ US | −26 462 302 460 $ US | 11 227 687 204 $ US |
| 2021 | −13 138 811 840 $ US | −19 967 262 331 $ US | 6 842 335 286 $ US |
| 2020 | −8 804 922 307 $ US | −15 539 568 149 $ US | 6 726 657 877 $ US |
| 2019 | −10 071 252 426 $ US | −19 771 169 646 $ US | 9 721 790 937 $ US |
| 2018 | −12 222 219 618 $ US | −20 252 571 152 $ US | 8 121 088 769 $ US |
| 2017 | −10 621 752 089 $ US | −18 064 872 732 $ US | 7 513 438 968 $ US |
| 2016 | −10 770 661 075 $ US | −17 630 044 670 $ US | 6 890 795 063 $ US |
| 2015 | −8 056 861 554 $ US | −14 688 336 713 $ US | 6 760 494 690 $ US |
| 2014 | −13 852 049 948 $ US | −21 054 983 733 $ US | 7 364 657 303 $ US |
| 2013 | −15 452 612 955 $ US | −21 591 857 329 $ US | 6 781 438 868 $ US |
| 2012 | −15 001 080 728 $ US | −21 884 983 025 $ US | 7 210 202 049 $ US |
| 2011 | −14 219 008 328 $ US | −21 387 270 121 $ US | 7 324 646 646 $ US |
| 2010 | −10 050 304 390 $ US | −17 317 872 457 $ US | 7 364 594 271 $ US |
| 2009 | −11 062 913 455 $ US | −18 861 258 534 $ US | 7 934 349 119 $ US |
| 2008 | −13 124 997 984 $ US | −21 398 348 692 $ US | 8 623 620 869 $ US |
| 2007 | −7 385 441 974 $ US | −16 069 347 860 $ US | 8 648 754 224 $ US |
| 2006 | −4 108 550 667 $ US | −11 344 583 444 $ US | 6 903 839 328 $ US |
| 2005 | −3 788 292 814 $ US | −9 369 851 010 $ US | 5 418 682 015 $ US |
| 2004 | −3 208 669 864 $ US | −7 791 028 915 $ US | 4 563 398 664 $ US |
| 2003 | −1 728 628 059 $ US | −5 670 935 833 $ US | 3 942 521 140 $ US |
| 2002 | −1 139 912 204 $ US | −4 125 970 343 $ US | 3 011 056 584 $ US |
| 2001 | −1 183 660 488 $ US | −3 836 503 221 $ US | 2 725 087 864 $ US |
| 2000 | −2 170 940 439 $ US | −4 191 494 919 $ US | 2 098 274 367 $ US |
| 1999 | −1 531 205 001 $ US | −3 284 845 278 $ US | 1 949 529 052 $ US |
| 1998 | −1 668 096 217 $ US | −3 105 238 311 $ US | 1 650 178 447 $ US |
| 1997 | −1 292 630 083 $ US | −2 578 852 201 $ US | 1 461 828 915 $ US |
| 1996 | −1 477 676 771 $ US | −2 882 670 713 $ US | 1 649 977 613 $ US |
| 1995 | −2 485 677 026 $ US | −3 162 207 757 $ US | 963 673 622 $ US |
| 1994 | −1 935 637 021 $ US | −2 576 522 255 $ US | 754 451 268 $ US |
| 1993 | −1 755 914 442 $ US | −2 386 460 271 $ US | 778 172 526 $ US |
| 1992 | −1 995 360 541 $ US | −2 738 034 933 $ US | 828 894 778 $ US |
| 1991 | −1 660 046 700 $ US | −1 980 807 553 $ US | 407 853 857 $ US |
| 1990 | −1 662 325 914 $ US | −2 108 381 417 $ US | 564 402 713 $ US |
| 1989 | −1 379 125 300 $ US | −1 696 832 179 $ US | 445 679 104 $ US |
| 1988 | −37 146 581 $ US | −759 518 342 $ US | 657 193 497 $ US |
| 1987 | −1 021 875 832 $ US | −1 066 366 798 $ US | 238 179 975 $ US |
| 1986 | −1 268 123 845 $ US | −1 052 782 845 $ US | −23 395 174 $ US |
| 1985 | −1 242 570 804 $ US | −1 353 441 778 $ US | 154 236 114 $ US |
| 1984 | −1 348 202 879 $ US | −1 400 822 860 $ US | 49 032 205 $ US |
| 1983 | −1 154 613 565 $ US | −1 226 916 509 $ US | −30 374 094 $ US |
| 1982 | −2 146 213 313 $ US | −1 745 967 245 $ US | −484 142 306 $ US |
| 1981 | −2 151 238 058 $ US | −1 519 827 994 $ US | −708 196 151 $ US |
| 1980 | −1 883 905 741 $ US | −1 320 921 470 $ US | −653 602 104 $ US |
| 1979 | −2 045 402 902 $ US | −1 288 747 652 $ US | −755 295 887 $ US |
| 1978 | −1 813 126 114 $ US | −1 111 678 889 $ US | −686 879 313 $ US |
| 1977 | −2 256 944 059 $ US | −1 498 441 437 $ US | −737 229 634 $ US |
| 1976 | −1 803 221 859 $ US | −1 024 820 037 $ US | −757 810 180 $ US |
| 1975 | −976 930 956 $ US | −712 401 951 $ US | −250 710 212 $ US |
| 1974 | −48 812 671 $ US | - | - |
| 1973 | −79 232 106 $ US | - | - |
| 1972 | −32 929 056 $ US | - | - |
| 1971 | −120 793 060 $ US | - | - |
| 1970 | −155 973 038 $ US | - | - |
| 1969 | −16 599 183 $ US | - | - |
| 1968 | −51 378 424 $ US | - | - |
| 1967 | −69 163 263 $ US | - | - |
| 1966 | −11 856 559 $ US | - | - |
| 1965 | 37 545 771 $ US | - | - |
| 1964 | 9 880 387 $ US | - | - |
| 1963 | −57 306 684 $ US | - | - |
| 1962 | −73 115 430 $ US | - | - |
| 1961 | −61 258 870 $ US | - | - |
| 1960 | 17 784 859 $ US | - | - |
En 2025, la balance commerciale du Maroc affichait un déficit de 16,7 milliards de dollars, contre un excédent de 17,8 millions de dollars en 1960. Le plus grand excédent a été de 37,5 millions de dollars, en 1965. La balance commerciale du Maroc est déficitaire chaque année depuis 1966. Le commerce de biens affichait un déficit de 33,5 milliards de dollars et celui de services un excédent de 17 milliards de dollars.
En 2025, le solde commercial du Maroc était le 49e plus élevé de 50 pays situés en Afrique, où les soldes allaient d'un déficit de 42,7 milliards de dollars en Égypte à un excédent de 13,8 milliards de dollars en Angola. De 2016 à 2025, les soldes commerciaux du Maroc ont totalisé un déficit de 123 milliards de dollars, contre un déficit de 112 milliards de dollars de 2006 à 2015. En 2025, les transactions courantes du Maroc affichaient un déficit de 2,5 % du PIB.
Commerce de biens du Maroc avec ses 10 principaux partenaires commerciaux, selon le Maroc, 2025
| Pays | Exportations vers | Importations depuis | Solde | |
|---|---|---|---|---|
 Espagne |
10,8 Md $US | 12,0 Md $US | −1,14 Md $US | vs Espagne |
 France |
9,57 Md $US | 7,94 Md $US | +1,63 Md $US | vs France |
 Chine |
410 M $US | 12,2 Md $US | −11,8 Md $US | vs Chine |
 États-Unis |
1,62 Md $US | 8,16 Md $US | −6,54 Md $US | vs USA |
 Allemagne |
2,67 Md $US | 4,70 Md $US | −2,03 Md $US | vs Allemagne |
 Turquie |
1,18 Md $US | 4,87 Md $US | −3,69 Md $US | vs Turquie |
 Italie |
2,04 Md $US | 3,84 Md $US | −1,80 Md $US | vs Italie |
 Inde |
2,58 Md $US | 1,84 Md $US | +739 M $US | vs Inde |
 Royaume-Uni |
2,12 Md $US | 1,29 Md $US | +835 M $US | vs R.-U. |
 Brésil |
1,32 Md $US | 1,70 Md $US | −387 M $US | vs Brésil |
Balance commerciale du Maroc : excédent (+) ou déficit (−)
Comparer la balance commerciale du Maroc avec celle d'autres pays
Sources :
- TradeMap (2025, mis à jour en octobre 2026)
- Banque mondiale | Économie et croissance (1960–2025, mis à jour en octobre 2026)
Creative Commons Attribution (CC BY) : vous pouvez copier, partager, adapter et réutiliser ce contenu, y compris à des fins commerciales, à condition de citer statistics.wiki et d’indiquer les modifications apportées. Les sources citées ci-dessus peuvent avoir leurs propres conditions de licence.