
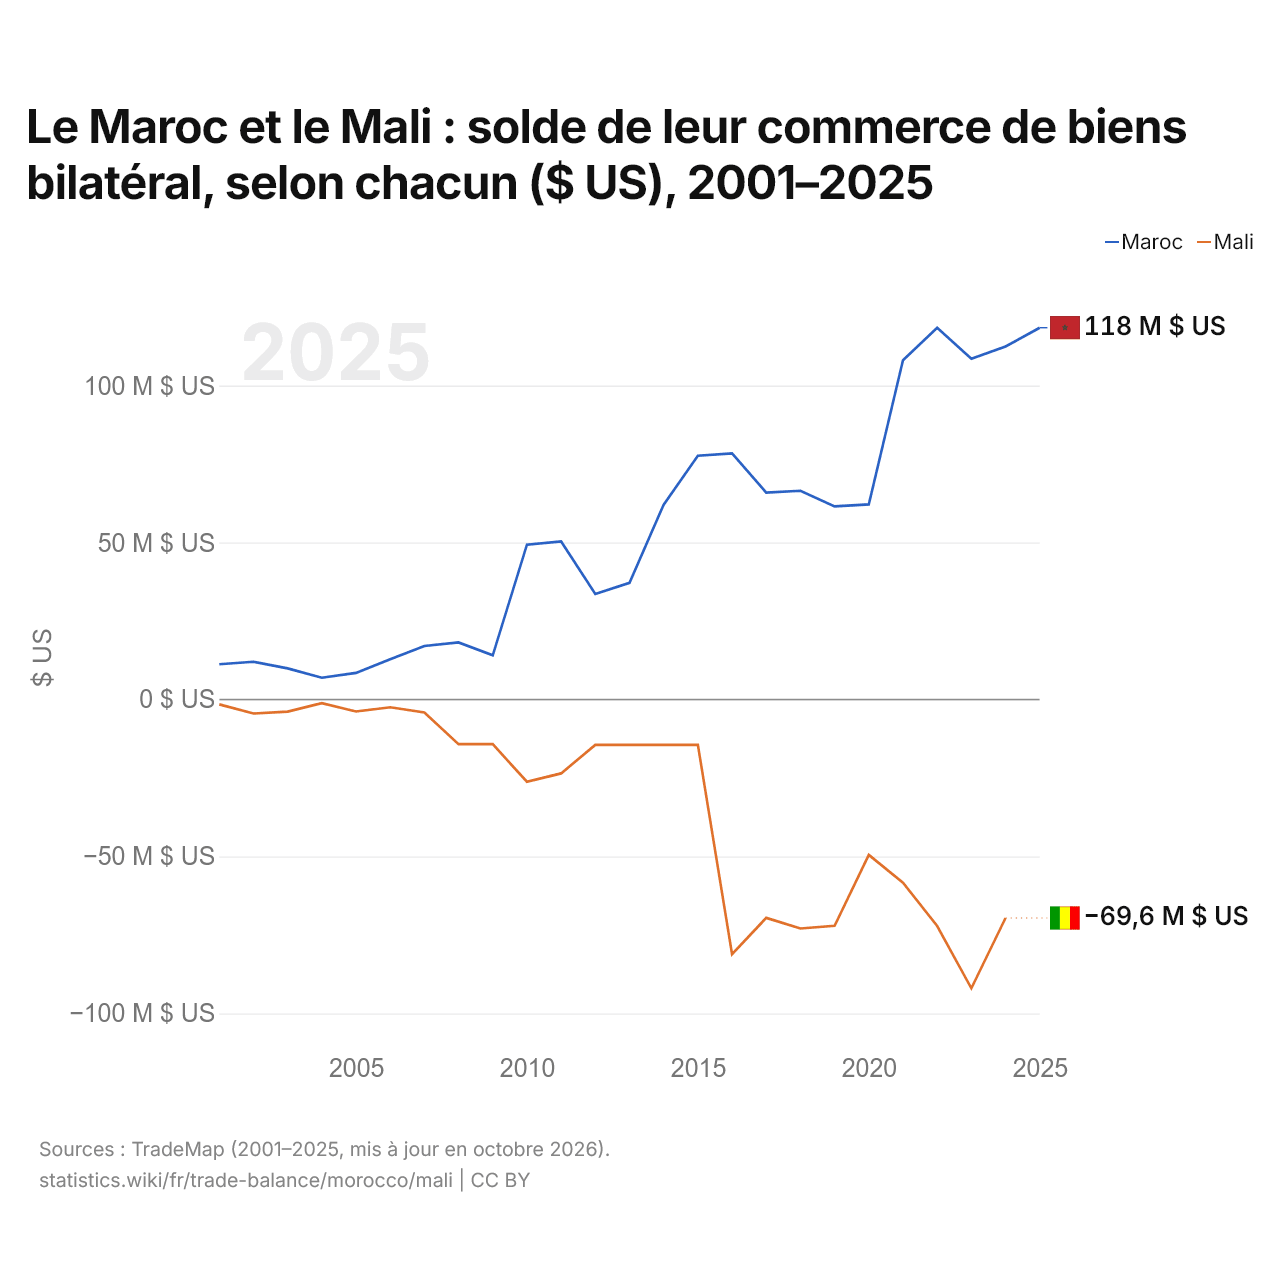
Le Maroc et le Mali : solde de leur commerce de biens bilatéral, selon chacun ($ US), 2001–2025
| Année | $ US | |
|---|---|---|
| Maroc | Mali | |
| 2025 | 118 438 000 $ US | - |
| 2024 | 112 453 000 $ US | −69 609 000 $ US |
| 2023 | 108 578 000 $ US | −92 005 000 $ US |
| 2022 | 118 391 000 $ US | −72 162 000 $ US |
| 2021 | 108 074 000 $ US | −58 369 000 $ US |
| 2020 | 62 144 000 $ US | −49 499 000 $ US |
| 2019 | 61 497 000 $ US | −72 071 000 $ US |
| 2018 | 66 500 000 $ US | −72 941 000 $ US |
| 2017 | 65 886 000 $ US | −69 571 000 $ US |
| 2016 | 78 393 000 $ US | −81 112 000 $ US |
| 2015 | 77 652 000 $ US | −14 446 000 $ US |
| 2014 | 62 086 000 $ US | −14 446 000 $ US |
| 2013 | 37 156 000 $ US | −14 446 000 $ US |
| 2012 | 33 604 000 $ US | −14 446 000 $ US |
| 2011 | 50 366 000 $ US | −23 552 000 $ US |
| 2010 | 49 324 000 $ US | −26 212 000 $ US |
| 2009 | 14 061 000 $ US | −14 243 000 $ US |
| 2008 | 18 191 000 $ US | −14 243 000 $ US |
| 2007 | 17 028 000 $ US | −4 122 000 $ US |
| 2006 | 12 825 000 $ US | −2 467 000 $ US |
| 2005 | 8 475 000 $ US | −3 832 000 $ US |
| 2004 | 6 932 000 $ US | −1 163 000 $ US |
| 2003 | 9 906 000 $ US | −3 864 000 $ US |
| 2002 | 12 016 000 $ US | −4 463 000 $ US |
| 2001 | 11 229 000 $ US | −1 563 000 $ US |
Selon le Maroc, son commerce de biens avec le Mali affichait un excédent de 112 millions de dollars ; selon le Mali, son commerce de biens avec le Maroc affichait un déficit de 69,6 millions de dollars. En 2001, les chiffres étaient un excédent de 11,2 millions de dollars pour le Maroc et un déficit de 1,56 million de dollars pour le Mali.
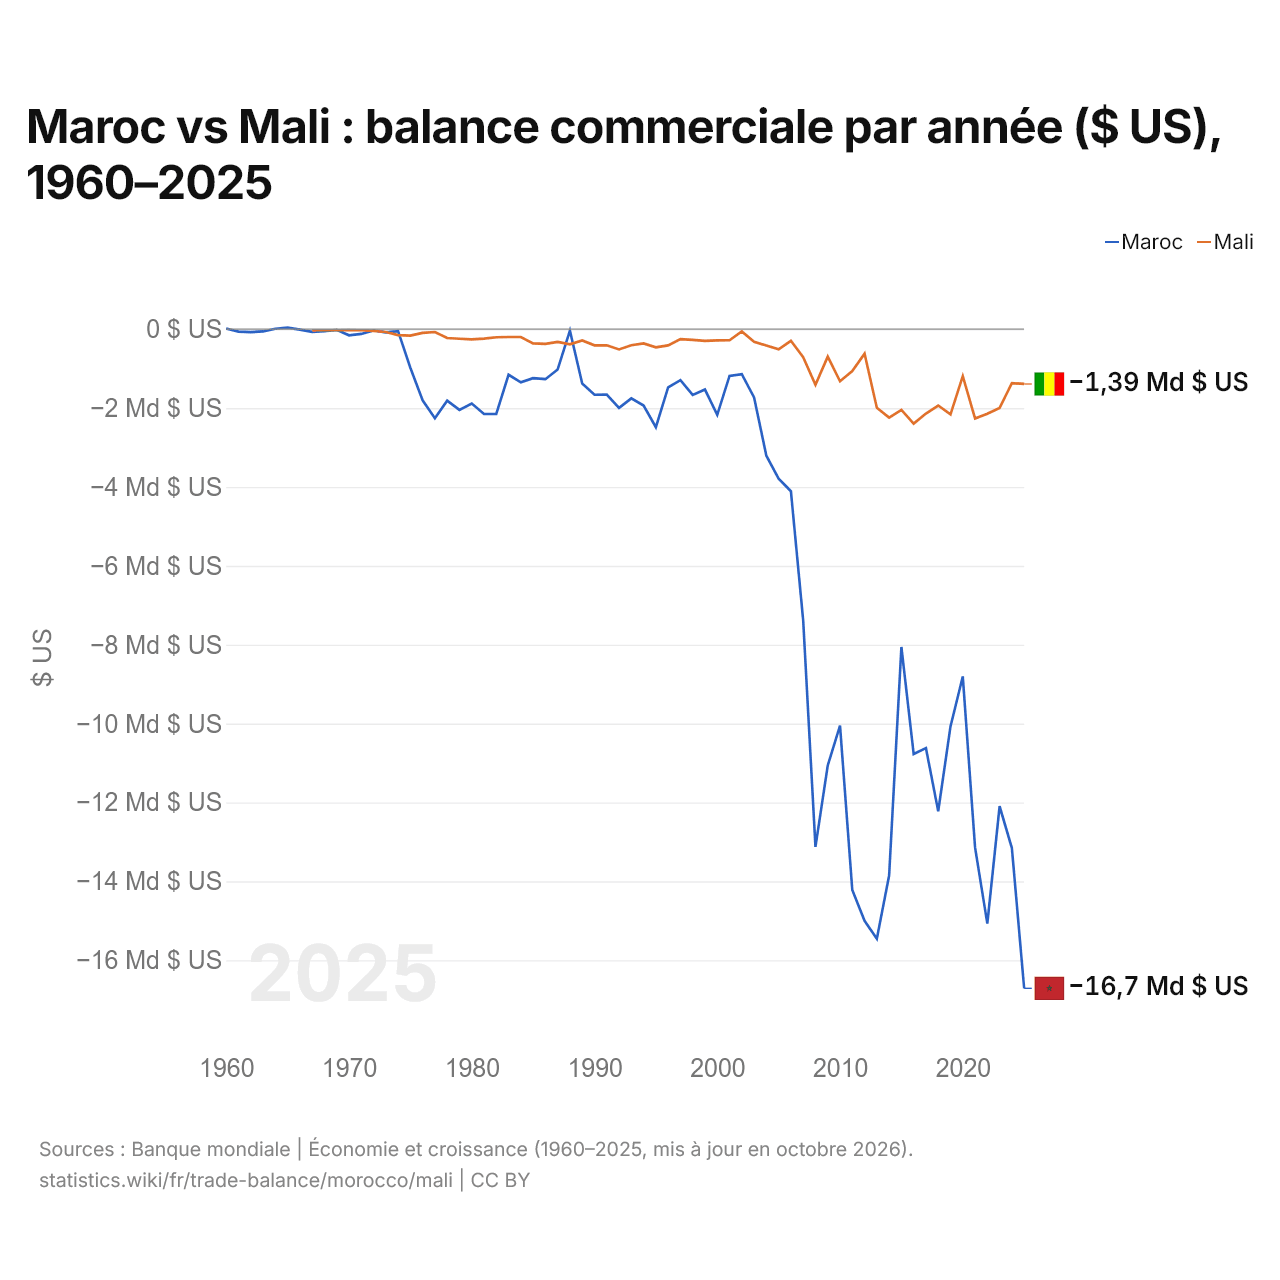
Maroc vs Mali : balance commerciale par année ($ US), 1960–2025
| Année | $ US | |
|---|---|---|
 Maroc |
 Mali |
|
| 2025 | −16 711 370 159 $ US | −1 388 790 964 $ US |
| 2024 | −13 154 358 447 $ US | −1 369 012 336 $ US |
| 2023 | −12 095 698 963 $ US | −1 996 210 658 $ US |
| 2022 | −15 070 969 799 $ US | −2 143 557 844 $ US |
| 2021 | −13 138 811 840 $ US | −2 264 392 317 $ US |
| 2020 | −8 804 922 307 $ US | −1 191 622 093 $ US |
| 2019 | −10 071 252 426 $ US | −2 159 193 072 $ US |
| 2018 | −12 222 219 618 $ US | −1 935 313 448 $ US |
| 2017 | −10 621 752 089 $ US | −2 138 230 547 $ US |
| 2016 | −10 770 661 075 $ US | −2 393 502 465 $ US |
| 2015 | −8 056 861 554 $ US | −2 045 647 953 $ US |
| 2014 | −13 852 049 948 $ US | −2 243 571 011 $ US |
| 2013 | −15 452 612 955 $ US | −1 991 489 960 $ US |
| 2012 | −15 001 080 728 $ US | −619 302 426 $ US |
| 2011 | −14 219 008 328 $ US | −1 062 908 871 $ US |
| 2010 | −10 050 304 390 $ US | −1 320 571 686 $ US |
| 2009 | −11 062 913 455 $ US | −695 673 831 $ US |
| 2008 | −13 124 997 984 $ US | −1 410 780 773 $ US |
| 2007 | −7 385 441 974 $ US | −713 016 204 $ US |
| 2006 | −4 108 550 667 $ US | −294 170 289 $ US |
| 2005 | −3 788 292 814 $ US | −508 989 538 $ US |
| 2004 | −3 208 669 864 $ US | −414 475 778 $ US |
| 2003 | −1 728 628 059 $ US | −319 187 483 $ US |
| 2002 | −1 139 912 204 $ US | −55 205 809 $ US |
| 2001 | −1 183 660 488 $ US | −279 991 324 $ US |
| 2000 | −2 170 940 439 $ US | −283 457 813 $ US |
| 1999 | −1 531 205 001 $ US | −296 618 855 $ US |
| 1998 | −1 668 096 217 $ US | −271 956 127 $ US |
| 1997 | −1 292 630 083 $ US | −253 103 910 $ US |
| 1996 | −1 477 676 771 $ US | −410 153 462 $ US |
| 1995 | −2 485 677 026 $ US | −461 926 730 $ US |
| 1994 | −1 935 637 021 $ US | −362 298 809 $ US |
| 1993 | −1 755 914 442 $ US | −406 409 634 $ US |
| 1992 | −1 995 360 541 $ US | −513 011 735 $ US |
| 1991 | −1 660 046 700 $ US | −409 809 176 $ US |
| 1990 | −1 662 325 914 $ US | −409 784 904 $ US |
| 1989 | −1 379 125 300 $ US | −287 766 808 $ US |
| 1988 | −37 146 581 $ US | −383 148 170 $ US |
| 1987 | −1 021 875 832 $ US | −324 087 024 $ US |
| 1986 | −1 268 123 845 $ US | −371 925 510 $ US |
| 1985 | −1 242 570 804 $ US | −358 809 903 $ US |
| 1984 | −1 348 202 879 $ US | −197 960 134 $ US |
| 1983 | −1 154 613 565 $ US | −199 046 865 $ US |
| 1982 | −2 146 213 313 $ US | −205 108 696 $ US |
| 1981 | −2 151 238 058 $ US | −237 550 712 $ US |
| 1980 | −1 883 905 741 $ US | −257 478 770 $ US |
| 1979 | −2 045 402 902 $ US | −243 040 632 $ US |
| 1978 | −1 813 126 114 $ US | −222 905 810 $ US |
| 1977 | −2 256 944 059 $ US | −71 638 003 $ US |
| 1976 | −1 803 221 859 $ US | −94 161 771 $ US |
| 1975 | −976 930 956 $ US | −162 846 011 $ US |
| 1974 | −48 812 671 $ US | −151 638 105 $ US |
| 1973 | −79 232 106 $ US | −71 335 899 $ US |
| 1972 | −32 929 056 $ US | −46 423 481 $ US |
| 1971 | −120 793 060 $ US | −26 874 262 $ US |
| 1970 | −155 973 038 $ US | −20 622 055 $ US |
| 1969 | −16 599 183 $ US | −26 542 485 $ US |
| 1968 | −51 378 424 $ US | −27 063 630 $ US |
| 1967 | −69 163 263 $ US | −34 552 713 $ US |
| 1966 | −11 856 559 $ US | - |
| 1965 | 37 545 771 $ US | - |
| 1964 | 9 880 387 $ US | - |
| 1963 | −57 306 684 $ US | - |
| 1962 | −73 115 430 $ US | - |
| 1961 | −61 258 870 $ US | - |
| 1960 | 17 784 859 $ US | - |
En 2025, la balance commerciale du Maroc affichait un déficit de 16,7 milliards de dollars et celle du Mali un déficit de 1,39 milliard de dollars ; le déficit du Maroc était 12 fois plus grand. En 1967, la balance commerciale du Maroc affichait un déficit de 69,2 millions de dollars et celle du Mali un déficit de 34,6 millions de dollars.
De 1967 à 2025, la balance commerciale du Maroc a été excédentaire pendant aucune des 59 années, et celle du Mali pendant aucune. Les balances commerciales du Maroc et du Mali ont été déficitaires chacune de ces années.
Maroc vs Mali : chiffres de la balance commerciale
|
Maroc
|
Mali
|
|
|---|---|---|
| Biens et services, $ US | −16,7 Md $US (2025) | −1,39 Md $US (2025) |
| % du PIB | −9,2 % (2025) | −4,6 % (2025) |
| Années d'excédent depuis 2000 | 0 sur 26 | 0 sur 26 |
| Solde des biens entre les deux, chiffres propres | +118 M $US (2025) | −69,6 M $US (2024) |
| Premier excédent en biens avec | France (+1,63 Md $US, 2025) | Afrique du Sud (+1,95 Md $US, 2024) |
| Premier déficit en biens avec | Chine (−11,8 Md $US, 2025) | Sénégal (−1,20 Md $US, 2024) |
Comparer la balance commerciale de 2 pays au choix
Sources :
- Banque mondiale | Économie et croissance (1960–2025, mis à jour en octobre 2026)
- TradeMap (2001–2025, mis à jour en octobre 2026)
Creative Commons Attribution (CC BY) : vous pouvez copier, partager, adapter et réutiliser ce contenu, y compris à des fins commerciales, à condition de citer statistics.wiki et d’indiquer les modifications apportées. Les sources citées ci-dessus peuvent avoir leurs propres conditions de licence.