
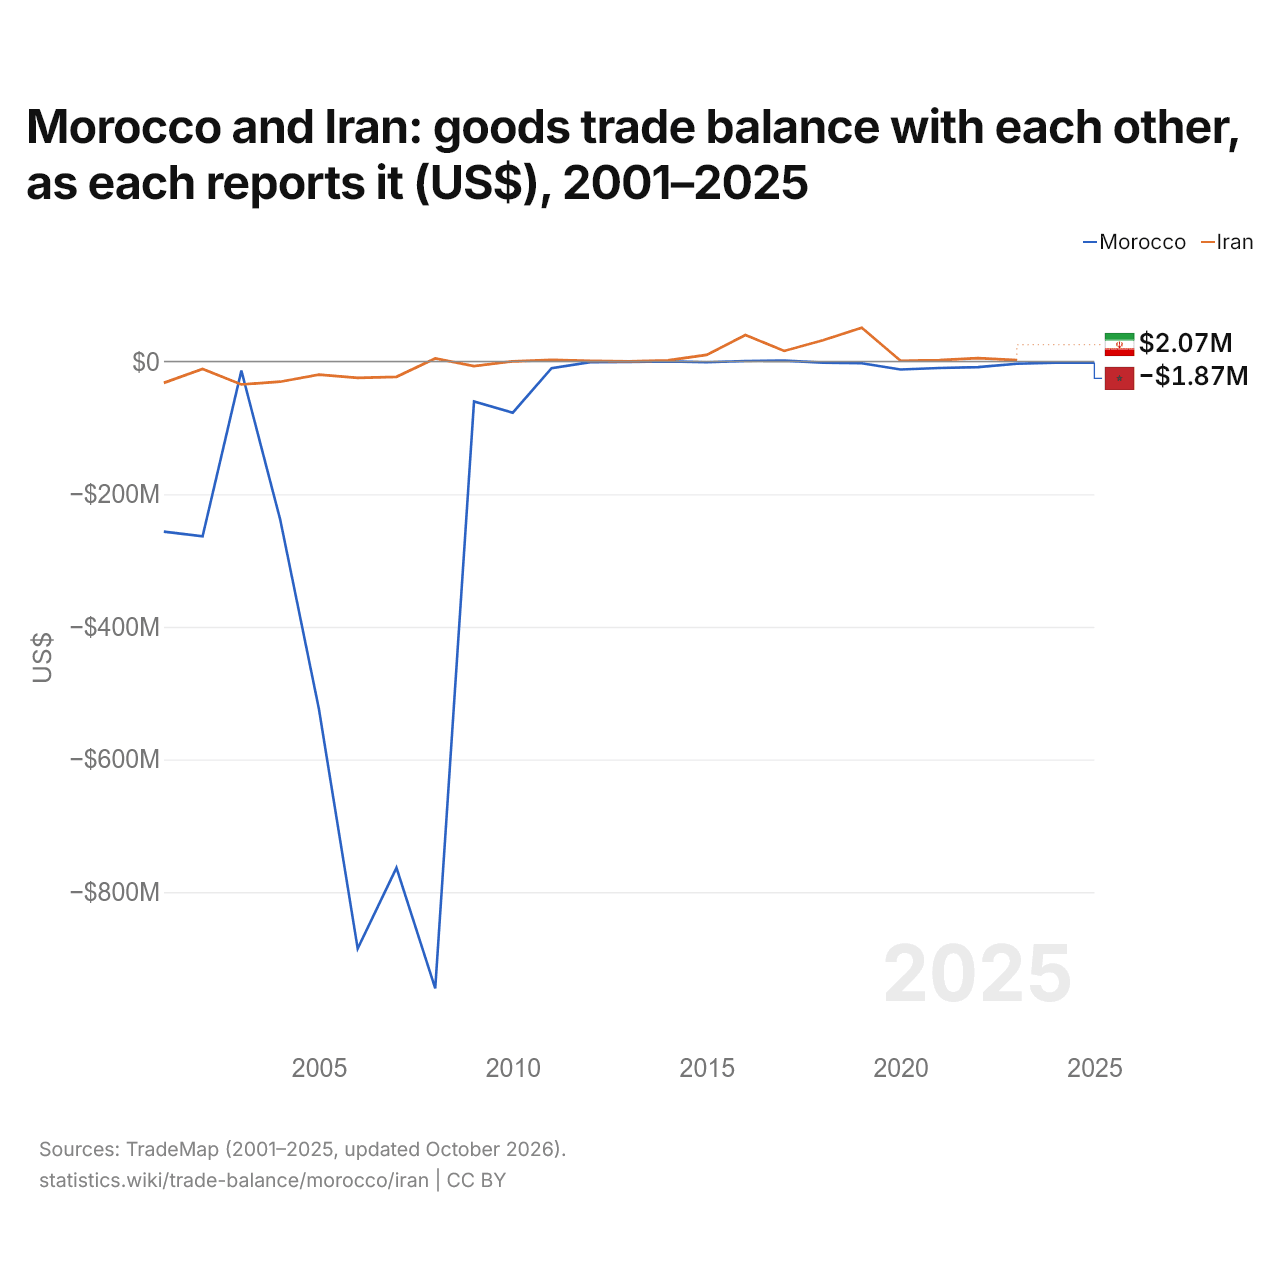
Le Maroc et l'Iran : solde de leur commerce de biens bilatéral, selon chacun ($ US), 2001–2025
| Année | $ US | |
|---|---|---|
| Maroc | Iran | |
| 2025 | −1 873 000 $ US | - |
| 2024 | −1 789 000 $ US | - |
| 2023 | −3 419 000 $ US | 2 069 000 $ US |
| 2022 | −8 386 000 $ US | 4 981 000 $ US |
| 2021 | −9 723 000 $ US | 2 069 000 $ US |
| 2020 | −11 991 000 $ US | 1 145 000 $ US |
| 2019 | −2 612 000 $ US | 50 982 000 $ US |
| 2018 | −1 558 000 $ US | 32 066 000 $ US |
| 2017 | 1 402 000 $ US | 15 958 000 $ US |
| 2016 | 806 000 $ US | 39 992 000 $ US |
| 2015 | −1 104 000 $ US | 9 944 000 $ US |
| 2014 | 135 000 $ US | 1 649 000 $ US |
| 2013 | −574 000 $ US | 163 000 $ US |
| 2012 | −970 000 $ US | 897 000 $ US |
| 2011 | −10 051 000 $ US | 2 429 000 $ US |
| 2010 | −77 229 000 $ US | 252 000 $ US |
| 2009 | −60 351 000 $ US | −6 818 000 $ US |
| 2008 | −945 050 000 $ US | 4 643 000 $ US |
| 2007 | −763 392 000 $ US | −23 079 000 $ US |
| 2006 | −885 207 000 $ US | −24 585 000 $ US |
| 2005 | −523 945 000 $ US | −19 788 000 $ US |
| 2004 | −237 969 000 $ US | −30 440 000 $ US |
| 2003 | −13 830 000 $ US | −34 605 000 $ US |
| 2002 | −263 635 000 $ US | −11 291 000 $ US |
| 2001 | −256 535 000 $ US | −32 199 000 $ US |
Selon le Maroc, son commerce de biens avec l'Iran affichait un déficit de 3,42 millions de dollars ; selon l'Iran, son commerce de biens avec le Maroc affichait un excédent de 2,07 millions de dollars. En 2001, les chiffres étaient un déficit de 257 millions de dollars pour le Maroc et un déficit de 32,2 millions de dollars pour l'Iran.
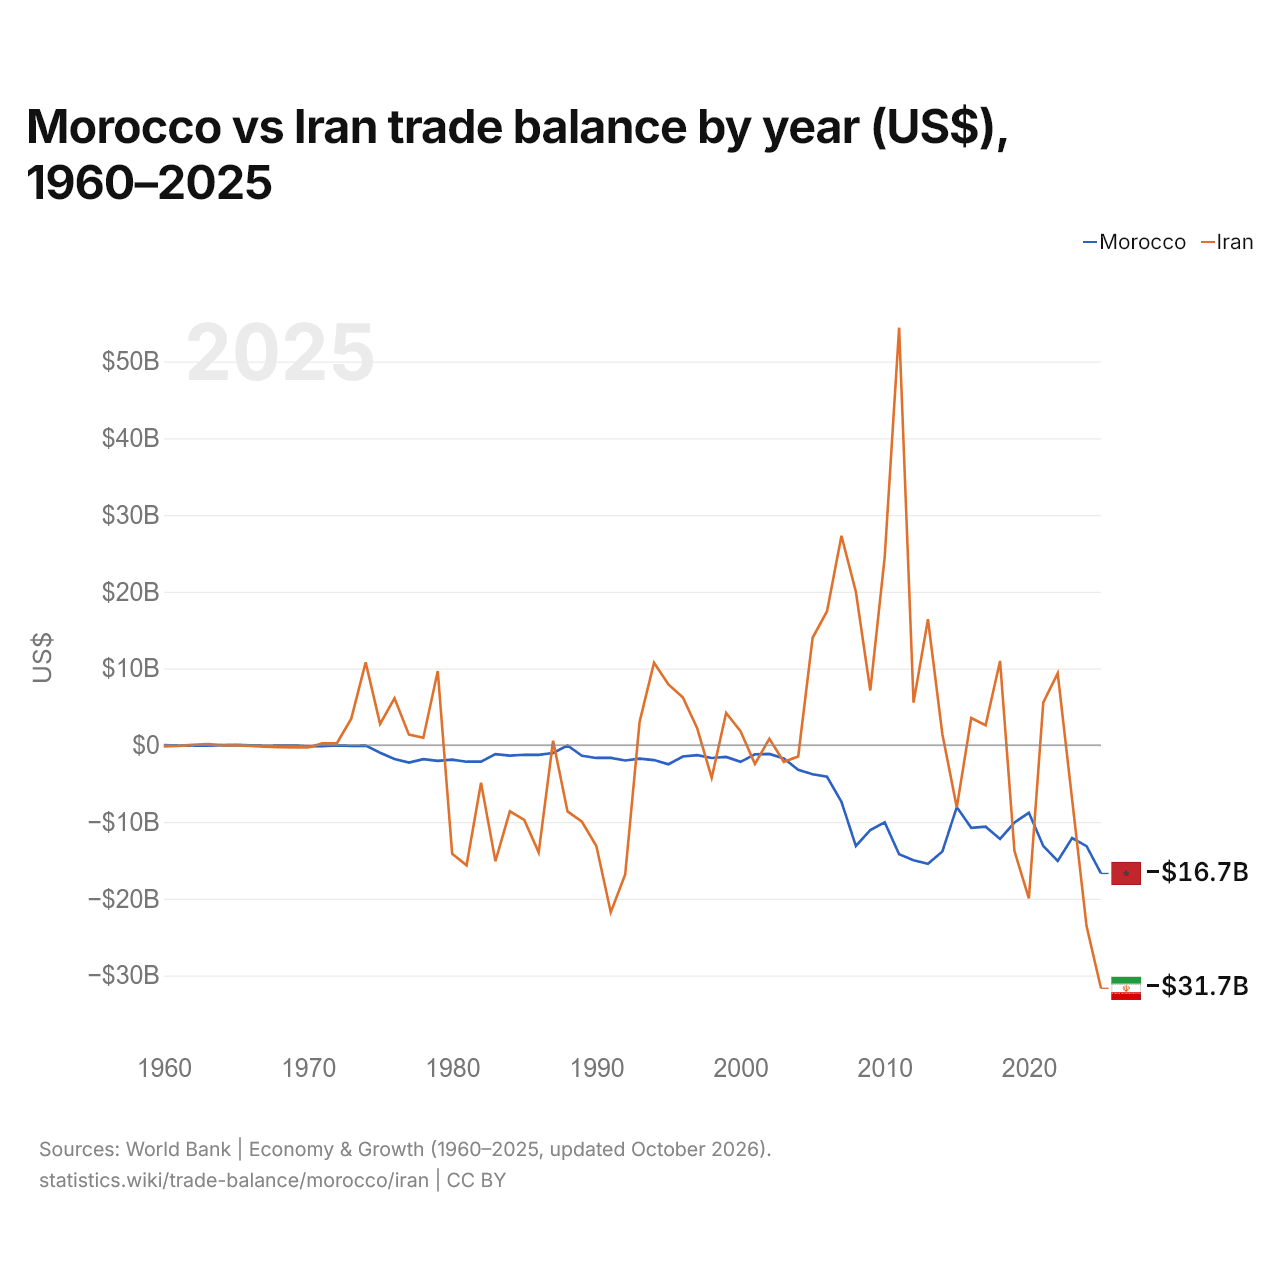
Maroc vs Iran : balance commerciale par année ($ US), 1960–2025
| Année | $ US | |
|---|---|---|
 Maroc |
 Iran |
|
| 2025 | −16 711 370 159 $ US | −31 676 191 270 $ US |
| 2024 | −13 154 358 447 $ US | −23 568 637 367 $ US |
| 2023 | −12 095 698 963 $ US | −7 092 579 071 $ US |
| 2022 | −15 070 969 799 $ US | 9 361 488 157 $ US |
| 2021 | −13 138 811 840 $ US | 5 564 557 565 $ US |
| 2020 | −8 804 922 307 $ US | −19 956 781 850 $ US |
| 2019 | −10 071 252 426 $ US | −13 788 535 089 $ US |
| 2018 | −12 222 219 618 $ US | 10 973 263 186 $ US |
| 2017 | −10 621 752 089 $ US | 2 603 085 001 $ US |
| 2016 | −10 770 661 075 $ US | 3 552 884 583 $ US |
| 2015 | −8 056 861 554 $ US | −8 105 758 514 $ US |
| 2014 | −13 852 049 948 $ US | 1 432 734 468 $ US |
| 2013 | −15 452 612 955 $ US | 16 408 588 952 $ US |
| 2012 | −15 001 080 728 $ US | 5 546 640 294 $ US |
| 2011 | −14 219 008 328 $ US | 54 398 073 068 $ US |
| 2010 | −10 050 304 390 $ US | 24 493 086 440 $ US |
| 2009 | −11 062 913 455 $ US | 7 135 886 374 $ US |
| 2008 | −13 124 997 984 $ US | 19 998 393 809 $ US |
| 2007 | −7 385 441 974 $ US | 27 279 166 988 $ US |
| 2006 | −4 108 550 667 $ US | 17 451 954 234 $ US |
| 2005 | −3 788 292 814 $ US | 13 995 728 754 $ US |
| 2004 | −3 208 669 864 $ US | −1 464 487 186 $ US |
| 2003 | −1 728 628 059 $ US | −2 163 459 033 $ US |
| 2002 | −1 139 912 204 $ US | 842 657 775 $ US |
| 2001 | −1 183 660 488 $ US | −2 447 396 907 $ US |
| 2000 | −2 170 940 439 $ US | 1 837 707 919 $ US |
| 1999 | −1 531 205 001 $ US | 4 210 835 500 $ US |
| 1998 | −1 668 096 217 $ US | −4 258 296 496 $ US |
| 1997 | −1 292 630 083 $ US | 2 171 645 134 $ US |
| 1996 | −1 477 676 771 $ US | 6 223 632 673 $ US |
| 1995 | −2 485 677 026 $ US | 7 914 318 073 $ US |
| 1994 | −1 935 637 021 $ US | 10 749 816 311 $ US |
| 1993 | −1 755 914 442 $ US | 3 046 536 574 $ US |
| 1992 | −1 995 360 541 $ US | −16 849 952 852 $ US |
| 1991 | −1 660 046 700 $ US | −21 780 150 763 $ US |
| 1990 | −1 662 325 914 $ US | −13 134 204 728 $ US |
| 1989 | −1 379 125 300 $ US | −9 977 684 994 $ US |
| 1988 | −37 146 581 $ US | −8 630 857 567 $ US |
| 1987 | −1 021 875 832 $ US | 576 180 379 $ US |
| 1986 | −1 268 123 845 $ US | −13 970 909 215 $ US |
| 1985 | −1 242 570 804 $ US | −9 739 286 228 $ US |
| 1984 | −1 348 202 879 $ US | −8 612 447 582 $ US |
| 1983 | −1 154 613 565 $ US | −15 108 728 819 $ US |
| 1982 | −2 146 213 313 $ US | −4 890 560 840 $ US |
| 1981 | −2 151 238 058 $ US | −15 651 420 597 $ US |
| 1980 | −1 883 905 741 $ US | −14 164 364 821 $ US |
| 1979 | −2 045 402 902 $ US | 9 660 039 875 $ US |
| 1978 | −1 813 126 114 $ US | 978 445 643 $ US |
| 1977 | −2 256 944 059 $ US | 1 372 240 187 $ US |
| 1976 | −1 803 221 859 $ US | 6 107 914 246 $ US |
| 1975 | −976 930 956 $ US | 2 773 055 993 $ US |
| 1974 | −48 812 671 $ US | 10 783 896 083 $ US |
| 1973 | −79 232 106 $ US | 3 461 654 472 $ US |
| 1972 | −32 929 056 $ US | 247 261 280 $ US |
| 1971 | −120 793 060 $ US | 244 757 918 $ US |
| 1970 | −155 973 038 $ US | −300 301 792 $ US |
| 1969 | −16 599 183 $ US | −294 433 624 $ US |
| 1968 | −51 378 424 $ US | −261 589 868 $ US |
| 1967 | −69 163 263 $ US | −178 485 511 $ US |
| 1966 | −11 856 559 $ US | −89 504 575 $ US |
| 1965 | 37 545 771 $ US | −20 171 392 $ US |
| 1964 | 9 880 387 $ US | 3 653 727 $ US |
| 1963 | −57 306 684 $ US | 141 505 731 $ US |
| 1962 | −73 115 430 $ US | 38 426 764 $ US |
| 1961 | −61 258 870 $ US | −94 336 012 $ US |
| 1960 | 17 784 859 $ US | −148 623 522 $ US |
En 2025, la balance commerciale du Maroc affichait un déficit de 16,7 milliards de dollars et celle de l'Iran un déficit de 31,7 milliards de dollars ; le déficit de l'Iran était 1,9 fois plus grand. En 1960, la balance commerciale du Maroc affichait un excédent de 17,8 millions de dollars et celle de l'Iran un déficit de 149 millions de dollars.
De 1960 à 2025, la balance commerciale du Maroc a été excédentaire pendant 3 des 66 années, et celle de l'Iran pendant 36. Les balances commerciales du Maroc et de l'Iran ont été déficitaires en même temps pendant 28 de ces années, la dernière fois en 2025.
Maroc vs Iran : chiffres de la balance commerciale
|
Maroc
|
Iran
|
|
|---|---|---|
| Biens et services, $ US | −16,7 Md $US (2025) | −31,7 Md $US (2025) |
| % du PIB | −9,2 % (2025) | −8,7 % (2025) |
| Années d'excédent depuis 2000 | 0 sur 26 | 17 sur 26 |
| Solde des biens entre les deux, chiffres propres | −1,87 M $US (2025) | +2,07 M $US (2023) |
| Premier excédent en biens avec | France (+1,63 Md $US, 2025) | Irak (+11,5 Md $US, 2023) |
| Premier déficit en biens avec | Chine (−11,8 Md $US, 2025) | Émirats arabes unis (−14,5 Md $US, 2023) |
Comparer la balance commerciale de 2 pays au choix
Sources :
- Banque mondiale | Économie et croissance (1960–2025, mis à jour en octobre 2026)
- TradeMap (2001–2025, mis à jour en octobre 2026)
Creative Commons Attribution (CC BY) : vous pouvez copier, partager, adapter et réutiliser ce contenu, y compris à des fins commerciales, à condition de citer statistics.wiki et d’indiquer les modifications apportées. Les sources citées ci-dessus peuvent avoir leurs propres conditions de licence.