
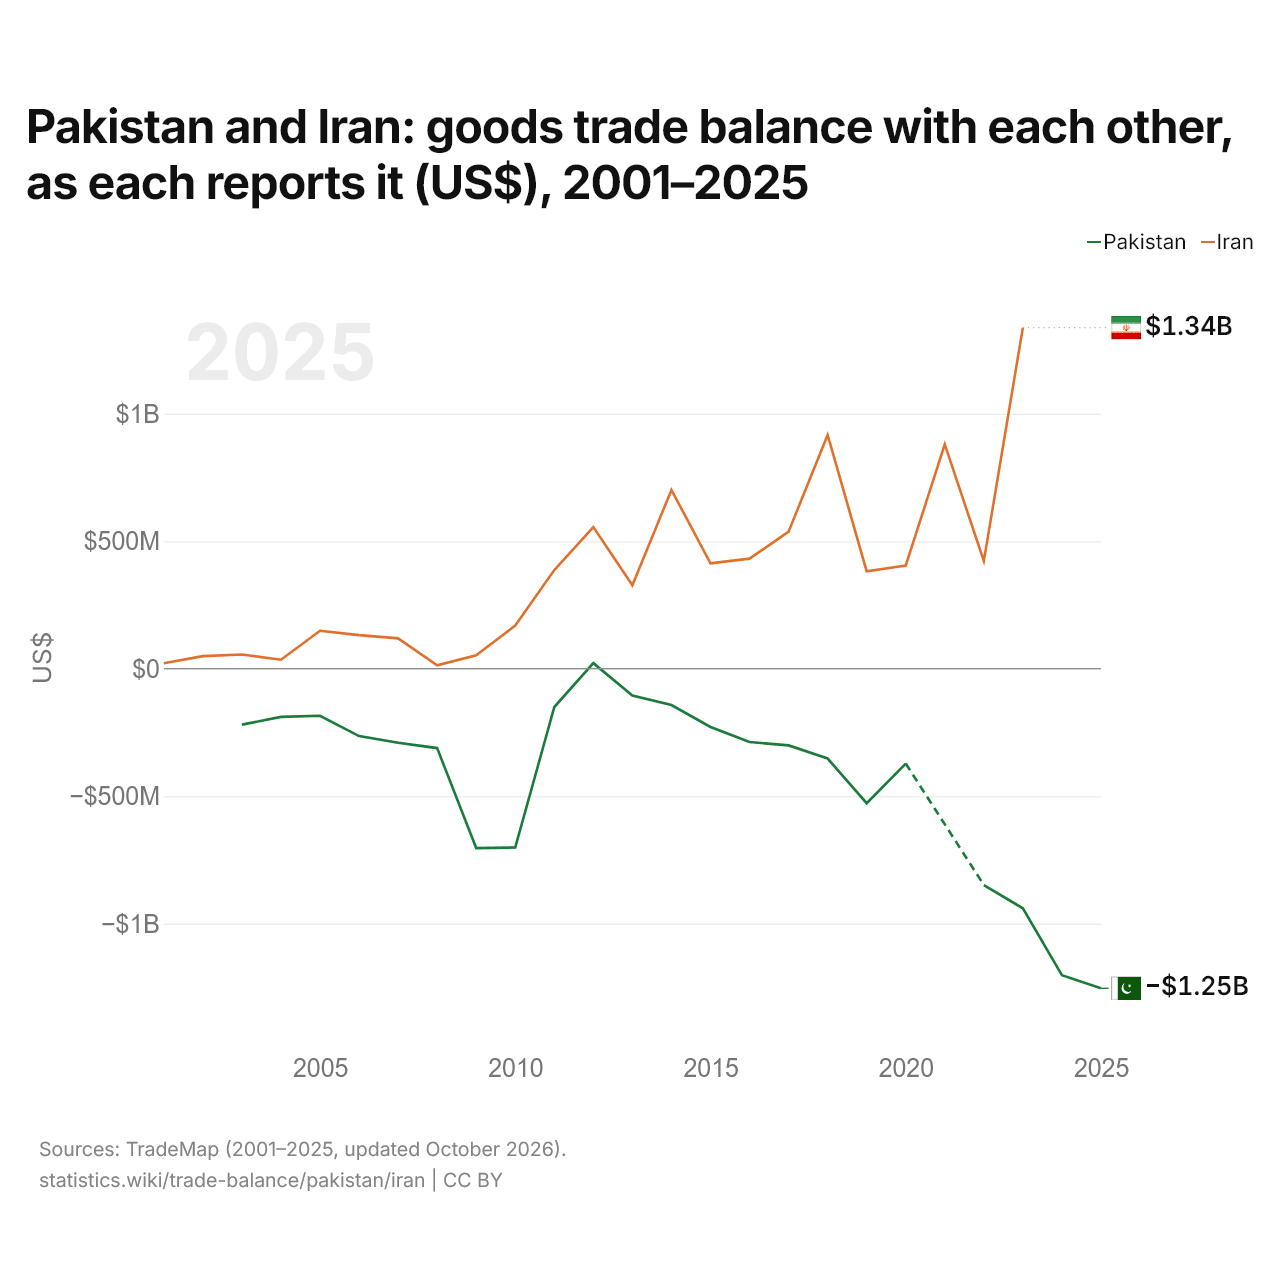
Le Pakistan et l'Iran : solde de leur commerce de biens bilatéral, selon chacun ($ US), 2001–2025
| Année | $ US | |
|---|---|---|
| Pakistan | Iran | |
| 2025 | −1 253 717 000 $ US | - |
| 2024 | −1 202 213 000 $ US | - |
| 2023 | −939 927 000 $ US | 1 337 418 000 $ US |
| 2022 | −848 673 000 $ US | 422 387 000 $ US |
| 2021 | - | 879 556 000 $ US |
| 2020 | −372 361 000 $ US | 404 690 000 $ US |
| 2019 | −527 922 000 $ US | 382 090 000 $ US |
| 2018 | −352 469 000 $ US | 916 997 000 $ US |
| 2017 | −301 049 000 $ US | 537 340 000 $ US |
| 2016 | −287 524 000 $ US | 431 435 000 $ US |
| 2015 | −228 601 000 $ US | 413 249 000 $ US |
| 2014 | −142 682 000 $ US | 701 119 000 $ US |
| 2013 | −105 142 000 $ US | 326 730 000 $ US |
| 2012 | 21 616 000 $ US | 555 614 000 $ US |
| 2011 | −150 513 000 $ US | 386 880 000 $ US |
| 2010 | −701 403 000 $ US | 169 098 000 $ US |
| 2009 | −703 746 000 $ US | 52 096 000 $ US |
| 2008 | −311 450 000 $ US | 13 080 000 $ US |
| 2007 | −290 567 000 $ US | 118 806 000 $ US |
| 2006 | −264 395 000 $ US | 131 661 000 $ US |
| 2005 | −184 743 000 $ US | 148 687 000 $ US |
| 2004 | −189 035 000 $ US | 35 116 000 $ US |
| 2003 | −219 620 000 $ US | 55 540 000 $ US |
| 2002 | - | 49 244 000 $ US |
| 2001 | - | 21 049 000 $ US |
Selon le Pakistan, son commerce de biens avec l'Iran affichait un déficit de 940 millions de dollars ; selon l'Iran, son commerce de biens avec le Pakistan affichait un excédent de 1,34 milliard de dollars. En 2003, les chiffres étaient un déficit de 220 millions de dollars pour le Pakistan et un excédent de 55,5 millions de dollars pour l'Iran.
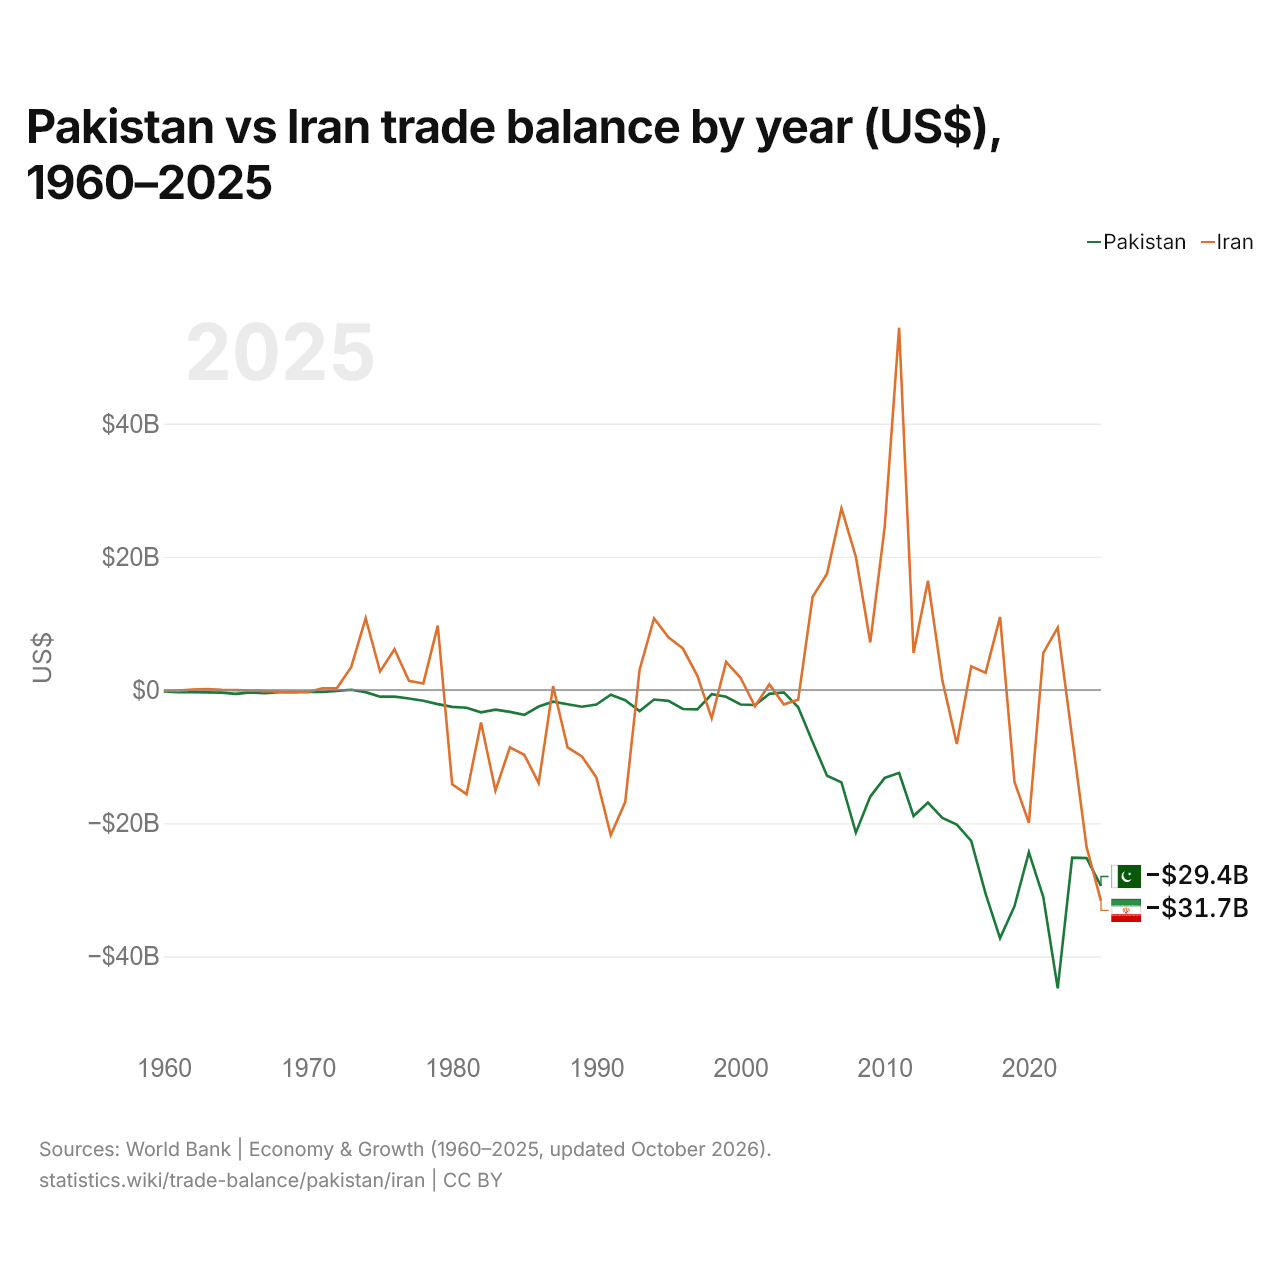
Pakistan vs Iran : balance commerciale par année ($ US), 1960–2025
| Année | $ US | |
|---|---|---|
 Pakistan |
 Iran |
|
| 2025 | −29 420 304 991 $ US | −31 676 191 270 $ US |
| 2024 | −25 257 703 998 $ US | −23 568 637 367 $ US |
| 2023 | −25 183 381 482 $ US | −7 092 579 071 $ US |
| 2022 | −44 800 038 644 $ US | 9 361 488 157 $ US |
| 2021 | −31 112 850 067 $ US | 5 564 557 565 $ US |
| 2020 | −24 392 041 495 $ US | −19 956 781 850 $ US |
| 2019 | −32 488 393 369 $ US | −13 788 535 089 $ US |
| 2018 | −37 259 759 399 $ US | 10 973 263 186 $ US |
| 2017 | −30 626 231 103 $ US | 2 603 085 001 $ US |
| 2016 | −22 669 632 006 $ US | 3 552 884 583 $ US |
| 2015 | −20 214 678 694 $ US | −8 105 758 514 $ US |
| 2014 | −19 214 125 936 $ US | 1 432 734 468 $ US |
| 2013 | −16 903 963 808 $ US | 16 408 588 952 $ US |
| 2012 | −18 935 710 905 $ US | 5 546 640 294 $ US |
| 2011 | −12 445 976 549 $ US | 54 398 073 068 $ US |
| 2010 | −13 208 171 673 $ US | 24 493 086 440 $ US |
| 2009 | −16 007 846 667 $ US | 7 135 886 374 $ US |
| 2008 | −21 428 199 020 $ US | 19 998 393 809 $ US |
| 2007 | −13 880 038 493 $ US | 27 279 166 988 $ US |
| 2006 | −12 871 731 104 $ US | 17 451 954 234 $ US |
| 2005 | −7 804 685 162 $ US | 13 995 728 754 $ US |
| 2004 | −2 594 600 000 $ US | −1 464 487 186 $ US |
| 2003 | −360 568 550 $ US | −2 163 459 033 $ US |
| 2002 | −590 557 973 $ US | 842 657 775 $ US |
| 2001 | −2 258 502 233 $ US | −2 447 396 907 $ US |
| 2000 | −2 189 374 438 $ US | 1 837 707 919 $ US |
| 1999 | −1 015 745 741 $ US | 4 210 835 500 $ US |
| 1998 | −648 129 008 $ US | −4 258 296 496 $ US |
| 1997 | −2 927 099 543 $ US | 2 171 645 134 $ US |
| 1996 | −2 864 555 918 $ US | 6 223 632 673 $ US |
| 1995 | −1 644 944 061 $ US | 7 914 318 073 $ US |
| 1994 | −1 433 344 463 $ US | 10 749 816 311 $ US |
| 1993 | −3 157 885 591 $ US | 3 046 536 574 $ US |
| 1992 | −1 541 375 310 $ US | −16 849 952 852 $ US |
| 1991 | −709 414 528 $ US | −21 780 150 763 $ US |
| 1990 | −2 183 424 485 $ US | −13 134 204 728 $ US |
| 1989 | −2 521 859 017 $ US | −9 977 684 994 $ US |
| 1988 | −2 141 612 076 $ US | −8 630 857 567 $ US |
| 1987 | −1 760 384 503 $ US | 576 180 379 $ US |
| 1986 | −2 492 684 439 $ US | −13 970 909 215 $ US |
| 1985 | −3 749 340 369 $ US | −9 739 286 228 $ US |
| 1984 | −3 293 781 538 $ US | −8 612 447 582 $ US |
| 1983 | −2 962 440 945 $ US | −15 108 728 819 $ US |
| 1982 | −3 361 895 735 $ US | −4 890 560 840 $ US |
| 1981 | −2 668 888 889 $ US | −15 651 420 597 $ US |
| 1980 | −2 534 646 465 $ US | −14 164 364 821 $ US |
| 1979 | −2 121 212 121 $ US | 9 660 039 875 $ US |
| 1978 | −1 613 232 323 $ US | 978 445 643 $ US |
| 1977 | −1 287 878 788 $ US | 1 372 240 187 $ US |
| 1976 | −1 007 373 737 $ US | 6 107 914 246 $ US |
| 1975 | −1 012 323 232 $ US | 2 773 055 993 $ US |
| 1974 | −327 474 747 $ US | 10 783 896 083 $ US |
| 1973 | 34 332 734 $ US | 3 461 654 472 $ US |
| 1972 | −138 453 590 $ US | 247 261 280 $ US |
| 1971 | −294 204 116 $ US | 244 757 918 $ US |
| 1970 | −274 044 519 $ US | −300 301 792 $ US |
| 1969 | −315 833 683 $ US | −294 433 624 $ US |
| 1968 | −326 963 461 $ US | −261 589 868 $ US |
| 1967 | −496 640 067 $ US | −178 485 511 $ US |
| 1966 | −353 002 940 $ US | −89 504 575 $ US |
| 1965 | −588 828 223 $ US | −20 171 392 $ US |
| 1964 | −399 832 003 $ US | 3 653 727 $ US |
| 1963 | −353 632 927 $ US | 141 505 731 $ US |
| 1962 | −331 583 368 $ US | 38 426 764 $ US |
| 1961 | −321 293 574 $ US | −94 336 012 $ US |
| 1960 | −226 585 468 $ US | −148 623 522 $ US |
En 2025, la balance commerciale du Pakistan affichait un déficit de 29,4 milliards de dollars et celle de l'Iran un déficit de 31,7 milliards de dollars ; le déficit de l'Iran était plus grand de 7,7 %. En 1960, la balance commerciale du Pakistan affichait un déficit de 227 millions de dollars et celle de l'Iran un déficit de 149 millions de dollars.
De 1960 à 2025, la balance commerciale du Pakistan a été excédentaire pendant une des 66 années, et celle de l'Iran pendant 36. Les balances commerciales du Pakistan et de l'Iran ont été déficitaires en même temps pendant 30 de ces années, la dernière fois en 2025.
Pakistan vs Iran : chiffres de la balance commerciale
|
Pakistan
|
Iran
|
|
|---|---|---|
| Biens et services, $ US | −29,4 Md $US (2025) | −31,7 Md $US (2025) |
| % du PIB | −7,2 % (2025) | −8,7 % (2025) |
| Années d'excédent depuis 2000 | 0 sur 26 | 17 sur 26 |
| Solde des biens entre les deux, chiffres propres | −1,25 Md $US (2025) | +1,34 Md $US (2023) |
| Premier excédent en biens avec | États-Unis (+3,17 Md $US, 2025) | Irak (+11,5 Md $US, 2023) |
| Premier déficit en biens avec | Chine (−18,2 Md $US, 2025) | Émirats arabes unis (−14,5 Md $US, 2023) |
Comparer la balance commerciale de 2 pays au choix
Sources :
- Banque mondiale | Économie et croissance (1960–2025, mis à jour en octobre 2026)
- TradeMap (2001–2025, mis à jour en octobre 2026)
Creative Commons Attribution (CC BY) : vous pouvez copier, partager, adapter et réutiliser ce contenu, y compris à des fins commerciales, à condition de citer statistics.wiki et d’indiquer les modifications apportées. Les sources citées ci-dessus peuvent avoir leurs propres conditions de licence.