
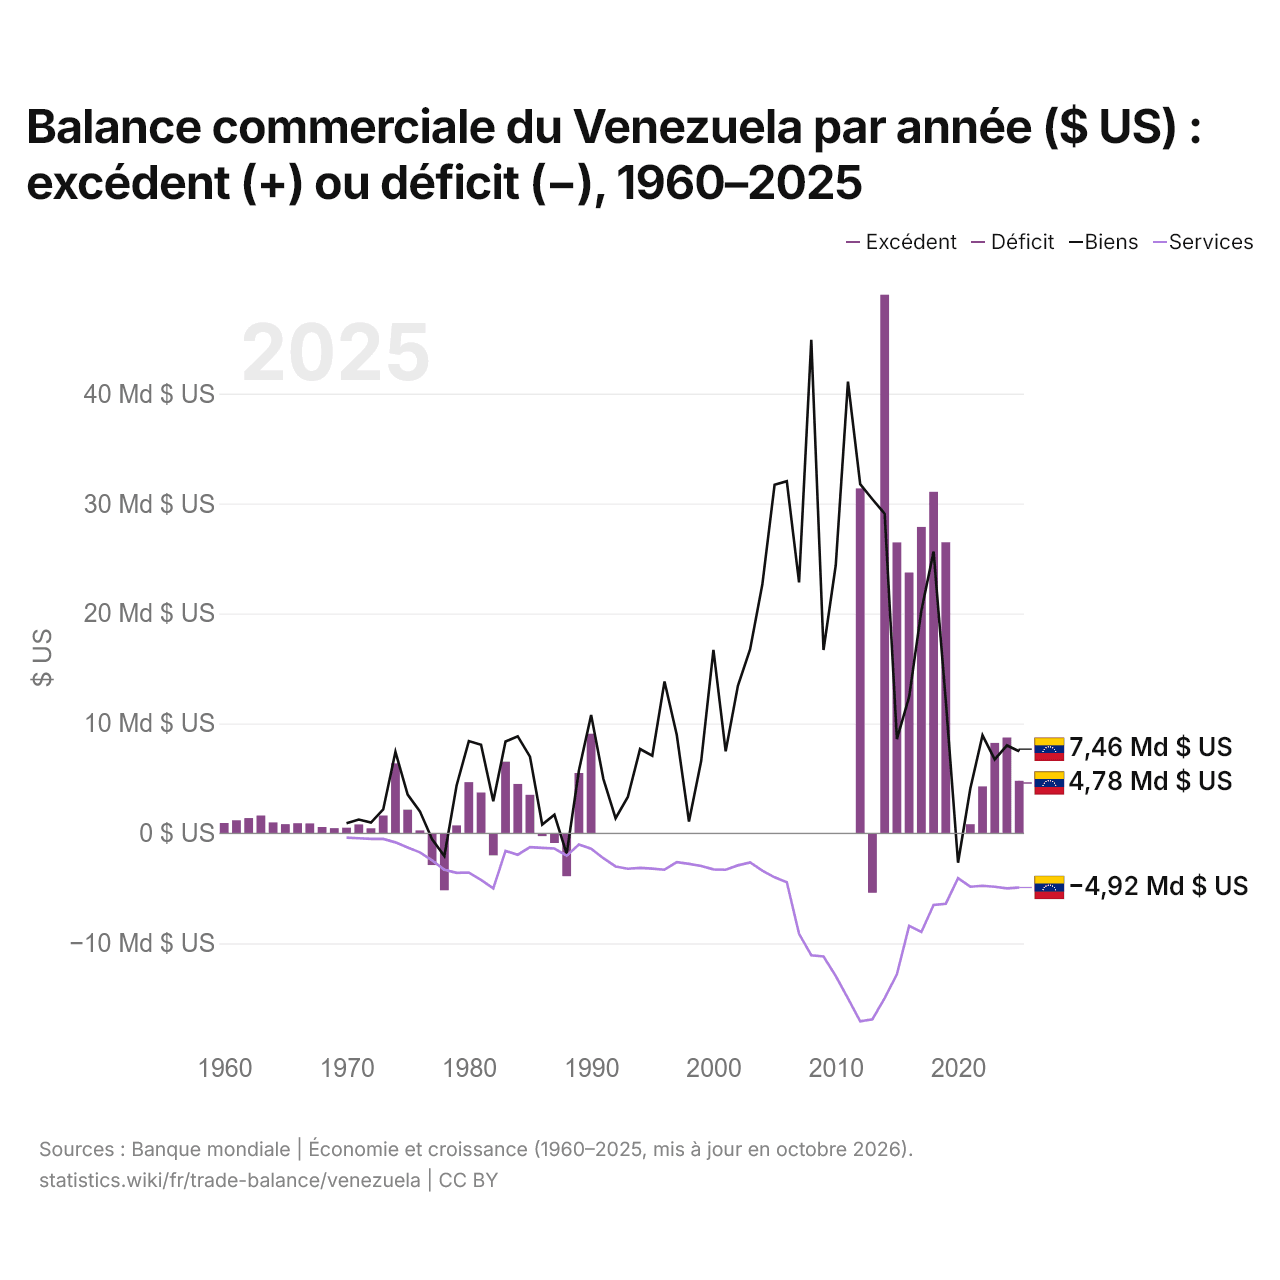
Balance commerciale du Venezuela par année ($ US) : excédent (+) ou déficit (−), 1960–2025
| Année | $ US | ||
|---|---|---|---|
| Biens et services | Biens | Services | |
| 2025 | 4 778 560 653 $ US | 7 461 000 000 $ US | −4 922 000 000 $ US |
| 2024 | 8 720 159 720 $ US | 7 997 000 000 $ US | −5 009 000 000 $ US |
| 2023 | 8 229 411 761 $ US | 6 729 000 000 $ US | −4 853 000 000 $ US |
| 2022 | 4 272 755 670 $ US | 8 921 000 000 $ US | −4 768 000 000 $ US |
| 2021 | 834 346 180 $ US | 4 054 000 000 $ US | −4 854 000 000 $ US |
| 2020 | −34 132 875 $ US | −2 672 000 000 $ US | −4 076 000 000 $ US |
| 2019 | 26 476 840 424 $ US | 12 028 000 000 $ US | −6 398 000 000 $ US |
| 2018 | 31 066 235 864 $ US | 25 629 000 000 $ US | −6 510 000 000 $ US |
| 2017 | 27 874 138 562 $ US | 20 260 000 000 $ US | −8 975 000 000 $ US |
| 2016 | 23 722 233 639 $ US | 12 410 000 000 $ US | −8 412 000 000 $ US |
| 2015 | 26 467 912 241 $ US | 8 581 000 000 $ US | −12 819 000 000 $ US |
| 2014 | 48 997 528 952 $ US | 29 075 000 000 $ US | −14 993 000 000 $ US |
| 2013 | −5 403 332 873 $ US | 30 390 000 000 $ US | −16 905 000 000 $ US |
| 2012 | 31 381 274 617 $ US | 31 755 000 000 $ US | −17 097 000 000 $ US |
| 2011 | 0 $ US | 41 082 000 000 $ US | −15 016 000 000 $ US |
| 2010 | 0 $ US | 24 382 000 000 $ US | −12 978 000 000 $ US |
| 2009 | 0 $ US | 16 677 000 000 $ US | −11 201 000 000 $ US |
| 2008 | 0 $ US | 44 884 000 000 $ US | −11 086 000 000 $ US |
| 2007 | 0 $ US | 22 825 000 000 $ US | −9 139 000 000 $ US |
| 2006 | 0 $ US | 32 027 000 000 $ US | −4 442 000 000 $ US |
| 2005 | 0 $ US | 31 710 000 000 $ US | −3 999 000 000 $ US |
| 2004 | 0 $ US | 22 651 000 000 $ US | −3 387 000 000 $ US |
| 2003 | 0 $ US | 16 751 000 000 $ US | −2 638 000 000 $ US |
| 2002 | 0 $ US | 13 425 000 000 $ US | −2 913 000 000 $ US |
| 2001 | 0 $ US | 7 460 000 000 $ US | −3 309 000 000 $ US |
| 2000 | 0 $ US | 16 688 000 000 $ US | −3 277 000 000 $ US |
| 1999 | 0 $ US | 6 601 000 000 $ US | −2 969 000 000 $ US |
| 1998 | 0 $ US | 1 081 000 000 $ US | −2 778 000 000 $ US |
| 1997 | 0 $ US | 8 967 000 000 $ US | −2 621 000 000 $ US |
| 1996 | 0 $ US | 13 811 000 000 $ US | −3 310 000 000 $ US |
| 1995 | 0 $ US | 7 061 000 000 $ US | −3 213 000 000 $ US |
| 1994 | 0 $ US | 7 668 000 000 $ US | −3 139 000 000 $ US |
| 1993 | 0 $ US | 3 305 000 000 $ US | −3 215 000 000 $ US |
| 1992 | 0 $ US | 1 380 000 000 $ US | −3 009 000 000 $ US |
| 1991 | 0 $ US | 4 960 000 000 $ US | −2 262 000 000 $ US |
| 1990 | 9 061 996 090 $ US | 10 758 000 000 $ US | −1 403 000 000 $ US |
| 1989 | 5 491 872 208 $ US | 5 723 000 000 $ US | −1 011 000 000 $ US |
| 1988 | −3 892 310 345 $ US | −1 863 000 000 $ US | −2 028 000 000 $ US |
| 1987 | −877 193 103 $ US | 1 694 000 000 $ US | −1 374 000 000 $ US |
| 1986 | −251 764 948 $ US | 798 000 000 $ US | −1 320 000 000 $ US |
| 1985 | 3 506 506 667 $ US | 6 977 000 000 $ US | −1 246 000 000 $ US |
| 1984 | 4 494 997 625 $ US | 8 829 000 000 $ US | −1 944 000 000 $ US |
| 1983 | 6 526 279 070 $ US | 8 350 000 000 $ US | −1 599 000 000 $ US |
| 1982 | −2 002 883 721 $ US | 2 932 000 000 $ US | −5 009 000 000 $ US |
| 1981 | 3 713 232 558 $ US | 8 058 000 000 $ US | −4 223 000 000 $ US |
| 1980 | 4 658 418 605 $ US | 8 398 000 000 $ US | −3 560 000 000 $ US |
| 1979 | 720 139 535 $ US | 4 356 000 000 $ US | −3 596 000 000 $ US |
| 1978 | −5 176 000 000 $ US | −2 060 000 000 $ US | −3 306 000 000 $ US |
| 1977 | −2 880 558 140 $ US | −533 000 000 $ US | −2 451 000 000 $ US |
| 1976 | 270 069 767 $ US | 2 005 000 000 $ US | −1 727 000 000 $ US |
| 1975 | 2 160 418 605 $ US | 3 520 000 000 $ US | −1 276 000 000 $ US |
| 1974 | 6 368 744 186 $ US | 7 414 000 000 $ US | −818 000 000 $ US |
| 1973 | 1 620 302 326 $ US | 2 177 000 000 $ US | −501 000 000 $ US |
| 1972 | 461 863 636 $ US | 980 000 000 $ US | −506 000 000 $ US |
| 1971 | 813 750 000 $ US | 1 256 000 000 $ US | −446 000 000 $ US |
| 1970 | 516 111 111 $ US | 927 000 000 $ US | −386 000 000 $ US |
| 1969 | 473 111 111 $ US | - | - |
| 1968 | 580 600 000 $ US | - | - |
| 1967 | 903 177 778 $ US | - | - |
| 1966 | 924 688 889 $ US | - | - |
| 1965 | 838 644 444 $ US | - | - |
| 1964 | 998 252 874 $ US | - | - |
| 1963 | 1 619 952 235 $ US | - | - |
| 1962 | 1 390 138 323 $ US | - | - |
| 1961 | 1 191 969 750 $ US | - | - |
| 1960 | 941 520 090 $ US | - | - |
En 2025, la balance commerciale du Venezuela affichait un excédent de 4,78 milliards de dollars, contre un excédent de 942 millions de dollars en 1960. Le plus grand déficit a été de 5,4 milliards de dollars, en 2013, et le plus grand excédent de 49 milliards de dollars, en 2014. La balance commerciale du Venezuela est excédentaire chaque année depuis 2021.
En 2025, le solde commercial du Venezuela était le 6e plus élevé de 26 pays situés en Amérique latine, où les soldes allaient d'un déficit de 24,7 milliards de dollars en Colombie à un excédent de 27,2 milliards de dollars au Pérou. De 2016 à 2025, les soldes commerciaux du Venezuela ont totalisé un excédent de 136 milliards de dollars. En 2025, les transactions courantes du Venezuela affichaient un excédent de 0,6 % du PIB.
Balance commerciale du Venezuela : excédent (+) ou déficit (−)
| Biens et services, $ US, 2025 | +4,78 Md $US |
|---|---|
| % du PIB, 2025 | +4,8 % |
| Années d'excédent, 2000–2025 | 12 |
| Biens, $ US, 2025 | +7,46 Md $US |
| Services, $ US, 2025 | −4,92 Md $US |
Comparer la balance commerciale du Venezuela avec celle d'autres pays
Sources :
- TradeMap (2013, mis à jour en octobre 2026)
- Banque mondiale | Économie et croissance (1960–2025, mis à jour en octobre 2026)
Creative Commons Attribution (CC BY) : vous pouvez copier, partager, adapter et réutiliser ce contenu, y compris à des fins commerciales, à condition de citer statistics.wiki et d’indiquer les modifications apportées. Les sources citées ci-dessus peuvent avoir leurs propres conditions de licence.