
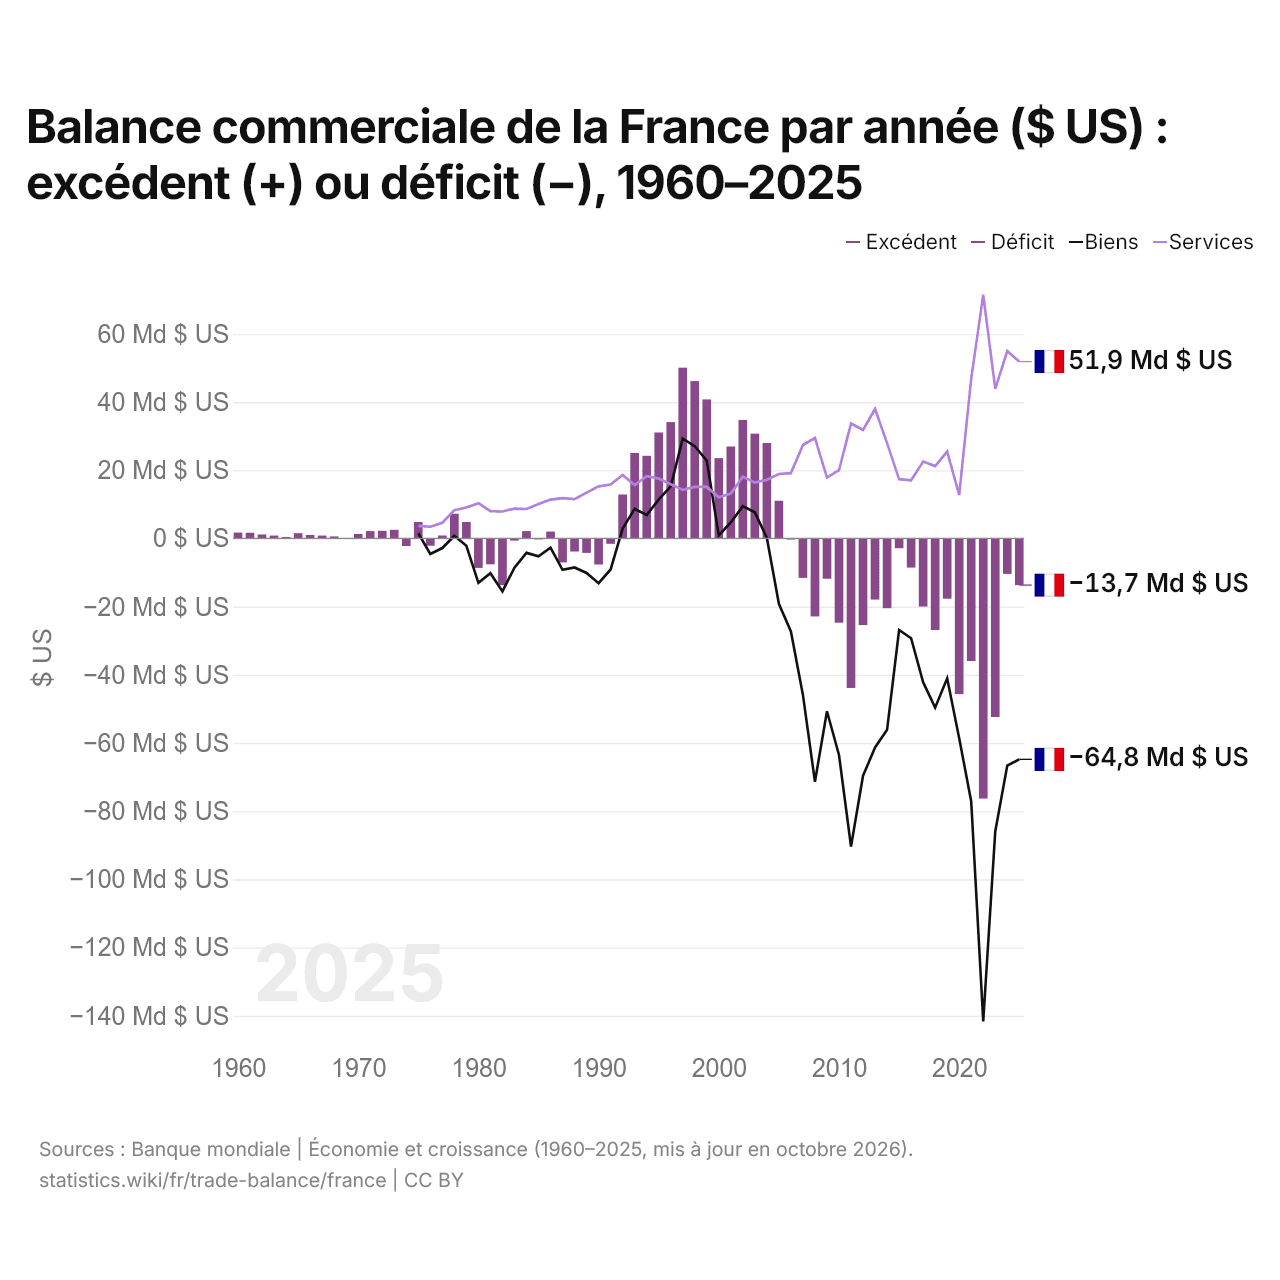
Balance commerciale de la France par année ($ US) : excédent (+) ou déficit (−), 1960–2025
| Année | $ US | ||
|---|---|---|---|
| Biens et services | Biens | Services | |
| 2025 | −13 691 892 676 $ US | −64 799 941 964 $ US | 51 873 397 925 $ US |
| 2024 | −10 387 713 597 $ US | −66 633 673 797 $ US | 54 969 193 957 $ US |
| 2023 | −52 372 867 874 $ US | −85 971 338 481 $ US | 43 887 557 348 $ US |
| 2022 | −76 323 175 109 $ US | −141 658 281 996 $ US | 71 507 833 101 $ US |
| 2021 | −35 964 530 801 $ US | −77 149 309 727 $ US | 46 894 419 107 $ US |
| 2020 | −45 662 030 726 $ US | −58 613 395 173 $ US | 12 744 850 446 $ US |
| 2019 | −17 694 749 944 $ US | −41 031 996 966 $ US | 25 477 011 196 $ US |
| 2018 | −26 878 288 452 $ US | −49 648 150 622 $ US | 21 229 684 591 $ US |
| 2017 | −19 990 725 131 $ US | −42 175 719 129 $ US | 22 561 969 471 $ US |
| 2016 | −8 555 918 301 $ US | −29 277 774 377 $ US | 17 064 584 238 $ US |
| 2015 | −2 874 747 900 $ US | −26 853 364 236 $ US | 17 389 475 241 $ US |
| 2014 | −20 476 182 589 $ US | −56 158 674 370 $ US | 27 957 995 870 $ US |
| 2013 | −17 928 929 470 $ US | −61 336 862 971 $ US | 37 982 498 608 $ US |
| 2012 | −25 424 169 112 $ US | −69 614 089 647 $ US | 31 793 442 964 $ US |
| 2011 | −43 858 143 696 $ US | −90 358 200 050 $ US | 33 694 922 116 $ US |
| 2010 | −24 731 111 845 $ US | −63 521 453 981 $ US | 20 006 361 884 $ US |
| 2009 | −11 805 159 462 $ US | −50 697 034 288 $ US | 17 863 874 008 $ US |
| 2008 | −22 878 042 543 $ US | −71 360 709 202 $ US | 29 448 127 478 $ US |
| 2007 | −11 565 875 316 $ US | −45 898 193 444 $ US | 27 389 294 878 $ US |
| 2006 | −314 778 625 $ US | −27 305 300 918 $ US | 19 152 427 435 $ US |
| 2005 | 11 054 488 524 $ US | −19 194 469 793 $ US | 18 911 228 481 $ US |
| 2004 | 27 985 189 929 $ US | 147 358 282 $ US | 17 208 517 673 $ US |
| 2003 | 30 738 831 193 $ US | 7 666 237 670 $ US | 16 376 164 843 $ US |
| 2002 | 34 756 831 657 $ US | 9 470 602 405 $ US | 18 136 748 701 $ US |
| 2001 | 26 968 658 956 $ US | 4 681 414 166 $ US | 13 185 972 145 $ US |
| 2000 | 23 545 285 267 $ US | 858 566 422 $ US | 12 061 881 884 $ US |
| 1999 | 40 790 461 990 $ US | 22 803 285 502 $ US | 15 116 777 291 $ US |
| 1998 | 46 166 110 740 $ US | 27 055 328 186 $ US | 15 115 368 351 $ US |
| 1997 | 50 108 338 953 $ US | 29 293 099 884 $ US | 14 231 874 092 $ US |
| 1996 | 34 112 706 757 $ US | 15 274 871 075 $ US | 15 914 521 246 $ US |
| 1995 | 31 069 260 087 $ US | 11 403 188 441 $ US | 17 568 012 596 $ US |
| 1994 | 24 247 400 756 $ US | 6 858 340 636 $ US | 18 237 146 645 $ US |
| 1993 | 25 065 323 141 $ US | 8 680 460 779 $ US | 15 676 619 855 $ US |
| 1992 | 12 888 475 836 $ US | 2 880 149 007 $ US | 18 609 310 163 $ US |
| 1991 | −1 575 747 006 $ US | −9 100 210 199 $ US | 15 795 962 474 $ US |
| 1990 | −7 657 631 611 $ US | −13 122 732 976 $ US | 15 274 176 687 $ US |
| 1989 | −4 238 741 518 $ US | −10 142 509 958 $ US | 13 435 098 022 $ US |
| 1988 | −3 842 638 476 $ US | −8 507 002 125 $ US | 11 538 319 090 $ US |
| 1987 | −7 038 415 366 $ US | −9 203 305 577 $ US | 11 810 278 500 $ US |
| 1986 | 2 015 437 068 $ US | −2 689 588 350 $ US | 11 392 848 718 $ US |
| 1985 | −286 173 164 $ US | −5 233 316 648 $ US | 10 086 161 124 $ US |
| 1984 | 2 161 975 531 $ US | −4 228 956 944 $ US | 8 637 218 795 $ US |
| 1983 | −632 756 692 $ US | −8 576 320 793 $ US | 8 747 016 824 $ US |
| 1982 | −13 723 325 681 $ US | −15 543 565 189 $ US | 7 899 577 308 $ US |
| 1981 | −7 579 843 090 $ US | −10 190 764 847 $ US | 8 005 394 965 $ US |
| 1980 | −8 643 123 254 $ US | −13 047 343 255 $ US | 10 328 974 643 $ US |
| 1979 | 4 816 373 728 $ US | −2 136 831 423 $ US | 9 077 660 125 $ US |
| 1978 | 7 241 133 721 $ US | 769 072 445 $ US | 8 307 898 478 $ US |
| 1977 | 868 280 289 $ US | −2 821 529 058 $ US | 4 608 128 186 $ US |
| 1976 | −2 147 364 108 $ US | −4 583 297 927 $ US | 3 434 261 370 $ US |
| 1975 | 4 812 605 171 $ US | 1 518 192 448 $ US | 3 706 447 774 $ US |
| 1974 | −2 215 630 115 $ US | - | - |
| 1973 | 2 527 401 296 $ US | - | - |
| 1972 | 2 245 383 615 $ US | - | - |
| 1971 | 2 159 464 899 $ US | - | - |
| 1970 | 1 297 980 394 $ US | - | - |
| 1969 | −146 618 606 $ US | - | - |
| 1968 | 612 901 162 $ US | - | - |
| 1967 | 840 231 291 $ US | - | - |
| 1966 | 1 011 891 447 $ US | - | - |
| 1965 | 1 521 823 088 $ US | - | - |
| 1964 | 442 835 372 $ US | - | - |
| 1963 | 841 559 930 $ US | - | - |
| 1962 | 1 154 587 274 $ US | - | - |
| 1961 | 1 666 644 737 $ US | - | - |
| 1960 | 1 710 489 823 $ US | - | - |
En 2025, la balance commerciale de la France affichait un déficit de 13,7 milliards de dollars, contre un excédent de 1,71 milliard de dollars en 1960. Le plus grand déficit a été de 76,3 milliards de dollars, en 2022, et le plus grand excédent de 50,1 milliards de dollars, en 1997. La balance commerciale de la France est déficitaire chaque année depuis 2006.
En 2025, le solde commercial de la France était le 37e plus élevé de 41 pays situés en Europe, où les soldes allaient d'un déficit de 56,8 milliards de dollars en Ukraine à un excédent de 290 milliards de dollars en Irlande. De 2016 à 2025, les soldes commerciaux de la France ont totalisé un déficit de 308 milliards de dollars, contre un déficit de 182 milliards de dollars de 2006 à 2015. En 2025, les transactions courantes de la France affichaient un déficit de 0,3 % du PIB.
Commerce de biens de la France avec ses 10 principaux partenaires commerciaux, selon la France, 2025
| Pays | Exportations vers | Importations depuis | Solde | |
|---|---|---|---|---|
 Allemagne |
90,7 Md $US | 97,7 Md $US | −6,97 Md $US | vs Allemagne |
 États-Unis |
52,8 Md $US | 62,8 Md $US | −10,0 Md $US | vs USA |
 Italie |
54,0 Md $US | 60,7 Md $US | −6,70 Md $US | vs Italie |
 Chine |
26,5 Md $US | 82,9 Md $US | −56,4 Md $US | vs Chine |
 Espagne |
50,9 Md $US | 51,2 Md $US | −287 M $US | vs Espagne |
 Belgique |
50,5 Md $US | 50,3 Md $US | +216 M $US | vs Belgique |
 Royaume-Uni |
44,2 Md $US | 28,9 Md $US | +15,2 Md $US | vs R.-U. |
 Pays-Bas |
26,9 Md $US | 32,9 Md $US | −5,96 Md $US | vs Pays-Bas |
 Suisse |
26,7 Md $US | 20,4 Md $US | +6,27 Md $US | vs Suisse |
 Pologne |
18,2 Md $US | 18,7 Md $US | −523 M $US | vs Pologne |
Balance commerciale de la France : excédent (+) ou déficit (−)
| Biens et services, $ US, 2025 | −13,7 Md $US |
|---|---|
| % du PIB, 2025 | −0,4 % |
| Années d'excédent, 2000–2025 | 6 |
| Biens, $ US, 2025 | −64,8 Md $US |
| Services, $ US, 2025 | +51,9 Md $US |
| Premier excédent en biens, 2025 | Royaume-Uni +15,2 Md $US |
| Premier déficit en biens, 2025 | Chine −56,4 Md $US |
Comparer la balance commerciale de la France avec celle d'autres pays
Sources :
- TradeMap (2025, mis à jour en octobre 2026)
- Banque mondiale | Économie et croissance (1960–2025, mis à jour en octobre 2026)
Creative Commons Attribution (CC BY) : vous pouvez copier, partager, adapter et réutiliser ce contenu, y compris à des fins commerciales, à condition de citer statistics.wiki et d’indiquer les modifications apportées. Les sources citées ci-dessus peuvent avoir leurs propres conditions de licence.