
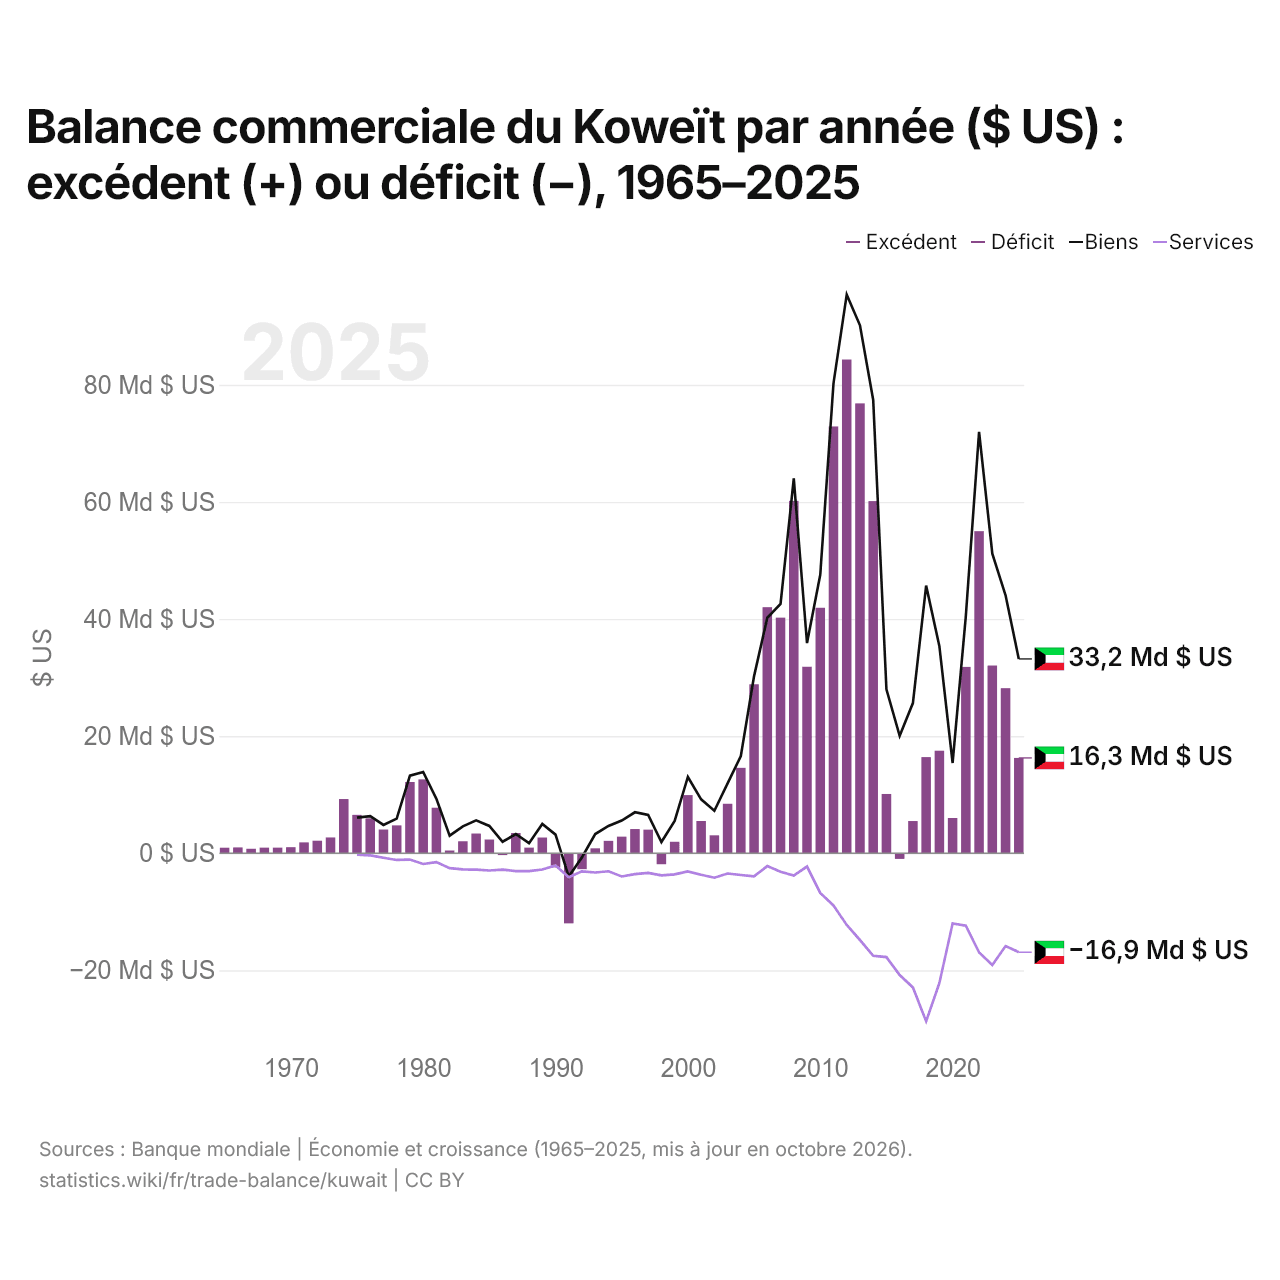
Balance commerciale du Koweït par année ($ US) : excédent (+) ou déficit (−), 1965–2025
| Année | $ US | ||
|---|---|---|---|
| Biens et services | Biens | Services | |
| 2025 | 16 276 674 173 $ US | 33 184 106 853 $ US | −16 907 432 680 $ US |
| 2024 | 28 191 893 469 $ US | 44 047 951 671 $ US | −15 859 067 864 $ US |
| 2023 | 32 049 742 012 $ US | 51 145 948 030 $ US | −19 100 644 344 $ US |
| 2022 | 55 010 938 776 $ US | 71 950 050 436 $ US | −16 936 308 900 $ US |
| 2021 | 31 822 717 583 $ US | 40 549 562 115 $ US | −12 382 337 141 $ US |
| 2020 | 6 011 762 286 $ US | 15 412 364 037 $ US | −12 011 173 113 $ US |
| 2019 | 17 509 576 399 $ US | 35 361 306 233 $ US | −22 181 547 642 $ US |
| 2018 | 16 411 973 268 $ US | 45 710 575 127 $ US | −28 716 460 383 $ US |
| 2017 | 5 494 402 505 $ US | 25 647 868 159 $ US | −22 920 681 256 $ US |
| 2016 | −977 113 032 $ US | 20 054 202 587 $ US | −20 818 850 985 $ US |
| 2015 | 10 118 771 356 $ US | 27 992 646 495 $ US | −17 740 822 605 $ US |
| 2014 | 60 138 150 594 $ US | 77 406 650 054 $ US | −17 518 570 624 $ US |
| 2013 | 76 836 954 889 $ US | 90 168 871 326 $ US | −14 824 517 848 $ US |
| 2012 | 84 329 989 712 $ US | 95 401 317 214 $ US | −12 260 696 621 $ US |
| 2011 | 72 889 603 919 $ US | 80 257 498 925 $ US | −8 916 129 009 $ US |
| 2010 | 41 918 027 124 $ US | 47 560 853 324 $ US | −6 775 465 014 $ US |
| 2009 | 31 850 165 922 $ US | 35 894 263 926 $ US | −2 276 355 841 $ US |
| 2008 | 60 183 463 032 $ US | 64 004 406 281 $ US | −3 818 250 331 $ US |
| 2007 | 40 233 767 513 $ US | 42 564 060 087 $ US | −3 175 072 770 $ US |
| 2006 | 42 022 772 386 $ US | 40 213 149 785 $ US | −2 194 183 896 $ US |
| 2005 | 28 852 739 726 $ US | 30 249 315 068 $ US | −3 940 068 493 $ US |
| 2004 | 14 584 323 040 $ US | 16 598 235 494 $ US | −3 724 126 230 $ US |
| 2003 | 8 439 257 480 $ US | 11 914 304 478 $ US | −3 471 342 303 $ US |
| 2002 | 3 053 495 397 $ US | 7 249 742 281 $ US | −4 190 326 689 $ US |
| 2001 | 5 500 811 916 $ US | 9 190 311 343 $ US | −3 691 123 804 $ US |
| 2000 | 9 929 845 608 $ US | 13 026 827 626 $ US | −3 097 946 520 $ US |
| 1999 | 1 957 853 588 $ US | 5 515 502 976 $ US | −3 610 207 130 $ US |
| 1998 | −1 876 911 365 $ US | 1 903 164 122 $ US | −3 780 077 704 $ US |
| 1997 | 4 025 066 837 $ US | 6 533 732 032 $ US | −3 369 058 596 $ US |
| 1996 | 4 124 792 508 $ US | 6 997 127 860 $ US | −3 580 391 917 $ US |
| 1995 | 2 824 612 663 $ US | 5 578 866 528 $ US | −3 978 251 188 $ US |
| 1994 | 2 117 844 781 $ US | 4 654 499 390 $ US | −3 085 522 377 $ US |
| 1993 | 834 437 748 $ US | 3 273 935 143 $ US | −3 296 463 739 $ US |
| 1992 | −2 730 061 350 $ US | −688 896 265 $ US | −3 096 622 817 $ US |
| 1991 | −11 979 850 423 $ US | −3 992 703 000 $ US | −4 098 237 000 $ US |
| 1990 | −2 420 138 889 $ US | 3 179 005 391 $ US | −2 080 047 148 $ US |
| 1989 | 2 682 288 387 $ US | 4 986 734 662 $ US | −2 774 190 273 $ US |
| 1988 | 956 889 069 $ US | 1 709 498 198 $ US | −3 046 275 614 $ US |
| 1987 | 3 448 610 687 $ US | 3 283 533 082 $ US | −3 046 688 072 $ US |
| 1986 | −326 914 778 $ US | 1 951 171 392 $ US | −2 808 035 019 $ US |
| 1985 | 2 344 116 933 $ US | 4 654 978 792 $ US | −2 949 261 563 $ US |
| 1984 | 3 357 405 206 $ US | 5 606 935 270 $ US | −2 816 978 323 $ US |
| 1983 | 2 040 607 321 $ US | 4 583 557 304 $ US | −2 751 506 705 $ US |
| 1982 | 461 948 310 $ US | 3 007 873 971 $ US | −2 549 398 955 $ US |
| 1981 | 7 773 015 406 $ US | 9 286 715 260 $ US | −1 513 709 478 $ US |
| 1980 | 12 615 751 562 $ US | 13 877 306 192 $ US | −1 842 414 952 $ US |
| 1979 | 12 165 027 898 $ US | 13 243 303 842 $ US | −1 081 898 319 $ US |
| 1978 | 4 755 447 132 $ US | 5 907 957 677 $ US | −1 152 506 205 $ US |
| 1977 | 4 040 954 265 $ US | 4 826 113 373 $ US | −781 669 845 $ US |
| 1976 | 5 959 224 931 $ US | 6 320 381 456 $ US | −362 532 703 $ US |
| 1975 | 6 547 553 718 $ US | 6 085 528 416 $ US | −237 904 510 $ US |
| 1974 | 9 250 181 647 $ US | - | - |
| 1973 | 2 691 757 819 $ US | - | - |
| 1972 | 2 133 461 418 $ US | - | - |
| 1971 | 1 850 333 335 $ US | - | - |
| 1970 | 1 025 919 590 $ US | - | - |
| 1969 | 957 599 617 $ US | - | - |
| 1968 | 949 199 620 $ US | - | - |
| 1967 | 758 799 696 $ US | - | - |
| 1966 | 988 399 605 $ US | - | - |
| 1965 | 935 199 626 $ US | - | - |
En 2025, la balance commerciale du Koweït affichait un excédent de 16,3 milliards de dollars, contre un excédent de 935 millions de dollars en 1965. Le plus grand déficit a été de 12 milliards de dollars, en 1991, et le plus grand excédent de 84,3 milliards de dollars, en 2012. La balance commerciale du Koweït est excédentaire chaque année depuis 2017. Le commerce de biens affichait un excédent de 33,2 milliards de dollars et celui de services un déficit de 16,9 milliards de dollars.
En 2025, le solde commercial du Koweït était le 13e plus élevé de 44 pays situés en Asie, où les soldes allaient d'un déficit de 68,9 milliards de dollars en Inde à un excédent de 816 milliards de dollars en Chine. De 2016 à 2025, les soldes commerciaux du Koweït ont totalisé un excédent de 208 milliards de dollars, contre un excédent de 521 milliards de dollars de 2006 à 2015. En 2025, les transactions courantes du Koweït affichaient un excédent de 22,7 % du PIB.
Commerce de biens du Koweït avec ses 10 principaux partenaires commerciaux, selon le Koweït, 2025
| Pays | Exportations vers | Importations depuis | Solde | |
|---|---|---|---|---|
 Chine |
782 M $US | 8,77 Md $US | −7,99 Md $US | |
 EAU |
1,90 Md $US | 5,07 Md $US | −3,16 Md $US | vs EAU |
 États-Unis |
81,2 M $US | 3,74 Md $US | −3,66 Md $US | |
 Inde |
1,44 Md $US | 2,05 Md $US | −617 M $US | |
 Arabie saoudite |
1,11 Md $US | 2,14 Md $US | −1,03 Md $US | |
 Japon |
7,50 M $US | 2,70 Md $US | −2,69 Md $US | |
 Allemagne |
38,4 M $US | 1,67 Md $US | −1,63 Md $US | |
 Italie |
51,0 M $US | 1,61 Md $US | −1,55 Md $US | |
 Suisse |
27,0 M $US | 1,25 Md $US | −1,22 Md $US | vs Suisse |
 France |
77,1 M $US | 1,13 Md $US | −1,05 Md $US | vs France |
Balance commerciale du Koweït : excédent (+) ou déficit (−)
Comparer la balance commerciale du Koweït avec celle d'autres pays
Sources :
- TradeMap (2025, mis à jour en octobre 2026)
- Banque mondiale | Économie et croissance (1965–2025, mis à jour en octobre 2026)
Creative Commons Attribution (CC BY) : vous pouvez copier, partager, adapter et réutiliser ce contenu, y compris à des fins commerciales, à condition de citer statistics.wiki et d’indiquer les modifications apportées. Les sources citées ci-dessus peuvent avoir leurs propres conditions de licence.