
Importations de biens et services du Koweït par année ($ US), 1965–2025
| Année | $ US | Rang mondial |
|---|---|---|
| Importations | Rang mondial | |
| 2025 | 67 106 804 066 $ US | #59 |
| 2024 | 61 521 205 383 $ US | #59 |
| 2023 | 63 425 622 996 $ US | #58 |
| 2022 | 55 913 469 388 $ US | #61 |
| 2021 | 44 912 694 808 $ US | #63 |
| 2020 | 42 529 707 772 $ US | #59 |
| 2019 | 55 817 806 338 $ US | #56 |
| 2018 | 63 048 258 687 $ US | #54 |
| 2017 | 56 293 171 254 $ US | #53 |
| 2016 | 53 090 012 147 $ US | #52 |
| 2015 | 51 488 579 434 $ US | #53 |
| 2014 | 51 286 394 768 $ US | #56 |
| 2013 | 46 580 345 500 $ US | #61 |
| 2012 | 45 739 026 063 $ US | #62 |
| 2011 | 39 894 339 787 $ US | #61 |
| 2010 | 35 034 036 154 $ US | #60 |
| 2009 | 31 130 878 955 $ US | #58 |
| 2008 | 38 206 585 624 $ US | #60 |
| 2007 | 32 461 455 101 $ US | #57 |
| 2006 | 24 543 725 187 $ US | #58 |
| 2005 | 22 839 041 096 $ US | #57 |
| 2004 | 19 246 691 551 $ US | #56 |
| 2003 | 16 499 335 597 $ US | #53 |
| 2002 | 13 961 186 388 $ US | #52 |
| 2001 | 12 400 466 933 $ US | #53 |
| 2000 | 11 370 749 009 $ US | #54 |
| 1999 | 11 878 521 098 $ US | #51 |
| 1998 | 13 256 506 845 $ US | #49 |
| 1997 | 12 015 862 917 $ US | #52 |
| 1996 | 12 340 978 394 $ US | #52 |
| 1995 | 11 409 022 677 $ US | #51 |
| 1994 | 10 518 518 519 $ US | #48 |
| 1993 | 10 602 648 675 $ US | #51 |
| 1992 | 10 766 871 506 $ US | #48 |
| 1991 | 13 840 763 854 $ US | #38 |
| 1990 | 10 701 388 542 $ US | #47 |
| 1989 | 10 058 581 791 $ US | #45 |
| 1988 | 8 884 381 552 $ US | #43 |
| 1987 | 8 303 936 655 $ US | #43 |
| 1986 | 8 596 155 818 $ US | #42 |
| 1985 | 9 166 990 520 $ US | #40 |
| 1984 | 9 687 160 122 $ US | #40 |
| 1983 | 10 300 332 102 $ US | #37 |
| 1982 | 11 298 630 132 $ US | #35 |
| 1981 | 9 641 838 693 $ US | #38 |
| 1980 | 9 822 528 922 $ US | #38 |
| 1979 | 7 131 847 261 $ US | #40 |
| 1978 | 6 180 627 006 $ US | #37 |
| 1977 | 6 141 691 617 $ US | #36 |
| 1976 | 4 275 155 872 $ US | #39 |
| 1975 | 3 127 241 132 $ US | #44 |
| 1974 | 1 800 437 317 $ US | #49 |
| 1973 | 1 199 034 299 $ US | #48 |
| 1972 | 919 595 439 $ US | #48 |
| 1971 | 724 238 833 $ US | #51 |
| 1970 | 692 999 723 $ US | #50 |
| 1969 | 800 799 680 $ US | - |
| 1968 | 694 399 722 $ US | - |
| 1967 | 694 399 722 $ US | - |
| 1966 | 582 399 767 $ US | - |
| 1965 | 484 399 806 $ US | - |
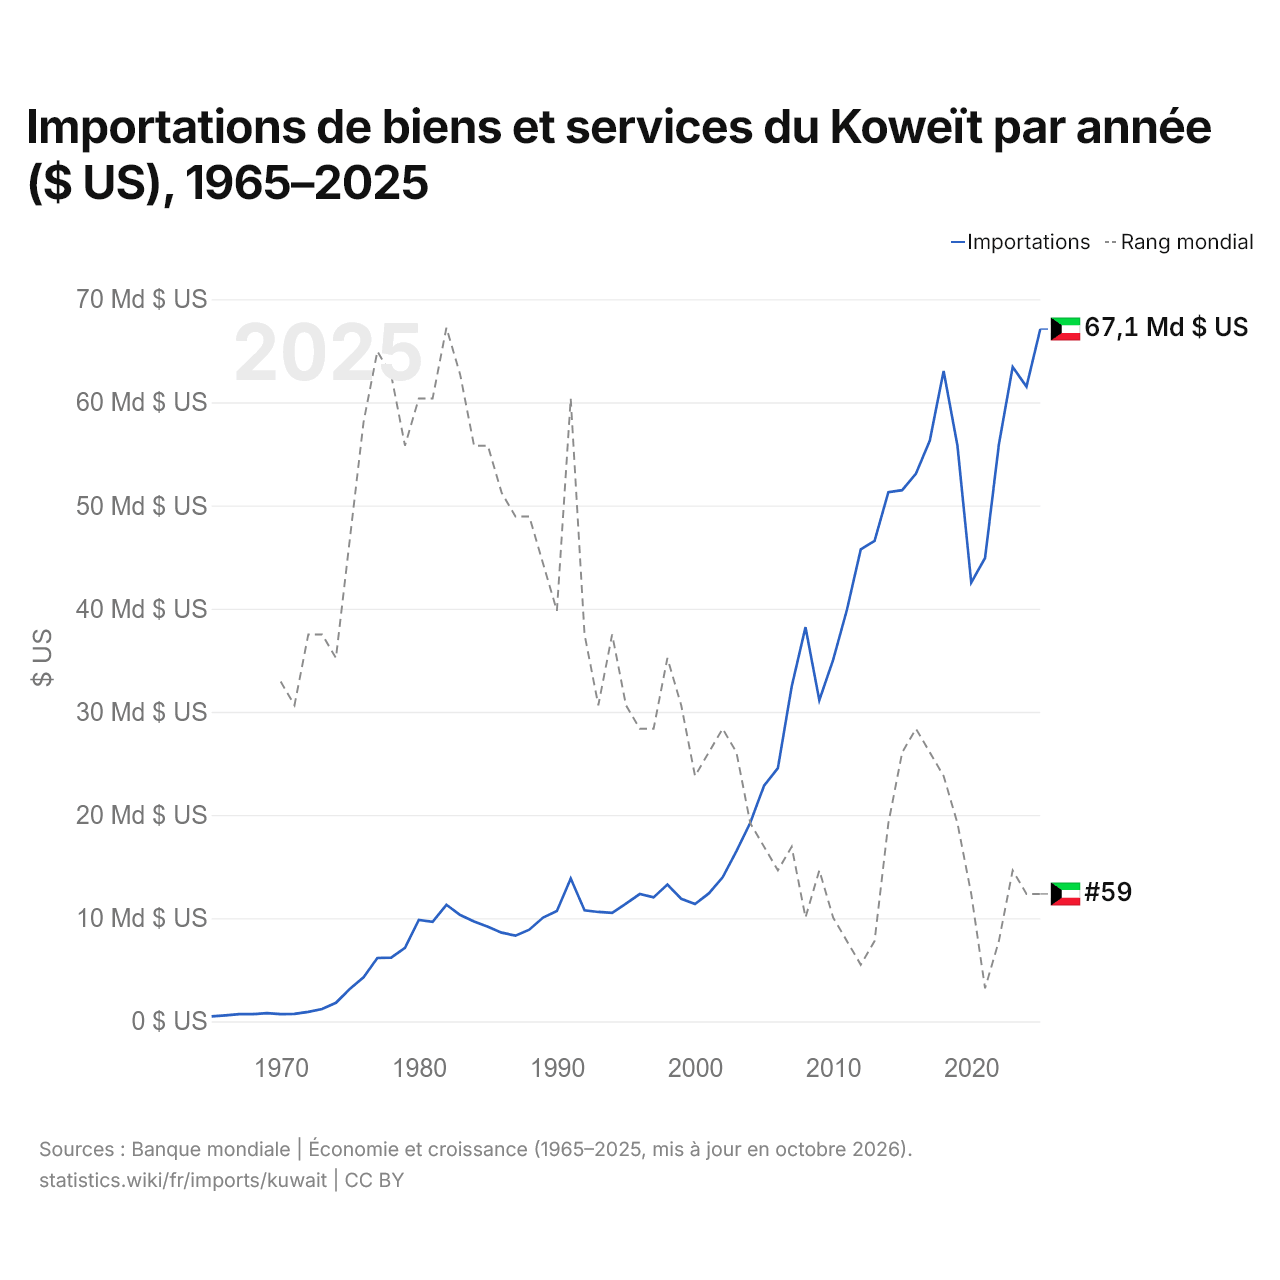
En 2025, les importations de biens et services du Koweït s'élevaient à 67,1 milliards de dollars, contre 484 millions de dollars en 1965. Elles se classaient au 59e rang mondial, un rang qu'elles occupent depuis 2024. Leur meilleur rang a été le 35e, occupé pour la dernière fois en 1982.
En 2025, les importations de biens et services du Koweït étaient les 21es plus élevées de 44 pays situés en Asie. En 2025, les exportations du Koweït dépassaient ses importations de 16,3 milliards de dollars, soit un excédent commercial. Le commerce du Koweït, exportations et importations réunies, équivalait à 95,7 % de son PIB en 2025, au 65e rang mondial.
Importations de biens du Koweït par catégorie, 2025
Importations de biens, 2025: 42,6 Md $US
En 2025, la première catégorie des importations de biens du Koweït était « machines, électronique et véhicules », avec 37,1 %, suivie de « produits chimiques, pharmaceutiques et plastiques », avec 14,0 %.
Origines des importations de biens du Koweït : les 10 premières, 2025
| Rang | Pays | Importations de biens | Part | |
|---|---|---|---|---|
| 1 |
 Chine |
8,77 Md $US | 20,6 % | |
| 2 |
 EAU |
5,07 Md $US | 11,9 % | vs EAU |
| 3 |
 États-Unis |
3,74 Md $US | 8,78 % | |
| 4 |
 Japon |
2,70 Md $US | 6,34 % | |
| 5 |
 Arabie saoudite |
2,14 Md $US | 5,02 % | |
| 6 |
 Inde |
2,05 Md $US | 4,82 % | |
| 7 |
 Allemagne |
1,67 Md $US | 3,92 % | |
| 8 |
 Italie |
1,61 Md $US | 3,77 % | |
| 9 |
 Suisse |
1,25 Md $US | 2,94 % | vs Suisse |
| 10 |
 France |
1,13 Md $US | 2,66 % | vs France |
| Autres partenaires et non précisés | 12,4 Md $US | 29,2 % |
Importations de biens du Koweït depuis ses 5 principales origines ($ US), 2001–2025
| Année | $ US | ||||
|---|---|---|---|---|---|
| Chine | Émirats arabes unis | États-Unis | Japon | Arabie saoudite | |
| 2025 | 8 774 369 000 $ US | 5 066 187 000 $ US | 3 736 944 000 $ US | 2 699 506 000 $ US | 2 138 717 000 $ US |
| 2024 | 7 244 119 000 $ US | 4 809 359 000 $ US | 3 448 490 000 $ US | 1 990 270 000 $ US | 1 962 923 000 $ US |
| 2023 | 7 429 644 000 $ US | 3 385 022 000 $ US | 3 402 663 000 $ US | 2 300 078 000 $ US | 1 945 417 000 $ US |
| 2022 | 6 397 627 000 $ US | 4 350 126 000 $ US | 3 017 607 000 $ US | 1 873 532 000 $ US | 1 758 089 000 $ US |
| 2021 | 5 733 260 000 $ US | 3 790 054 000 $ US | 2 547 118 000 $ US | 1 836 713 000 $ US | 1 696 292 000 $ US |
| 2020 | 4 935 554 000 $ US | 2 336 965 000 $ US | 2 409 428 000 $ US | 1 669 998 000 $ US | 1 648 124 000 $ US |
| 2019 | 5 988 347 000 $ US | 2 818 007 000 $ US | 3 034 014 000 $ US | 2 113 369 000 $ US | 2 073 784 000 $ US |
| 2018 | 5 978 934 000 $ US | 3 099 987 000 $ US | 3 104 011 000 $ US | 2 104 388 000 $ US | 2 042 104 000 $ US |
| 2017 | 5 505 123 000 $ US | 2 928 613 000 $ US | 3 441 642 000 $ US | 1 720 026 000 $ US | 1 835 625 000 $ US |
| 2016 | 4 667 048 000 $ US | 2 807 709 000 $ US | 2 948 178 000 $ US | 2 010 226 000 $ US | 1 521 868 000 $ US |
| 2015 | 5 097 158 000 $ US | 2 976 211 000 $ US | 3 006 007 000 $ US | 2 162 344 000 $ US | 1 581 846 000 $ US |
| 2014 | 4 452 186 000 $ US | 2 952 717 000 $ US | 3 076 842 000 $ US | 2 235 583 000 $ US | 1 570 292 000 $ US |
| 2013 | 3 934 186 000 $ US | 2 573 552 000 $ US | 2 907 490 000 $ US | 2 226 614 000 $ US | 1 404 892 000 $ US |
| 2012 | 3 600 825 000 $ US | 1 979 933 000 $ US | 2 725 195 000 $ US | 2 140 310 000 $ US | 1 434 656 000 $ US |
| 2011 | 3 713 411 000 $ US | 1 602 826 000 $ US | 2 687 599 000 $ US | 1 661 134 000 $ US | 1 442 332 000 $ US |
| 2010 | 2 835 878 000 $ US | 1 010 668 000 $ US | 2 596 293 000 $ US | 1 805 382 000 $ US | 1 202 288 000 $ US |
| 2009 | 2 459 765 000 $ US | 868 166 000 $ US | 2 209 728 000 $ US | 1 459 610 000 $ US | 1 205 163 000 $ US |
| 2008 | 2 903 748 000 $ US | 982 276 000 $ US | 2 674 507 000 $ US | 2 384 439 000 $ US | 1 393 285 000 $ US |
| 2007 | 2 455 816 000 $ US | 786 074 000 $ US | 2 418 248 000 $ US | 1 822 674 000 $ US | 1 288 274 000 $ US |
| 2006 | 1 594 018 000 $ US | 901 613 000 $ US | 1 940 102 000 $ US | 1 377 955 000 $ US | 1 368 960 000 $ US |
| 2005 | 856 006 000 $ US | 567 106 000 $ US | 1 358 043 000 $ US | 808 858 000 $ US | 1 000 545 000 $ US |
| 2004 | 856 006 000 $ US | 567 106 000 $ US | 1 358 043 000 $ US | 808 858 000 $ US | 1 000 545 000 $ US |
| 2003 | 628 170 000 $ US | 408 690 000 $ US | 1 277 532 000 $ US | 1 083 956 000 $ US | 745 754 000 $ US |
| 2002 | 468 978 000 $ US | 317 474 000 $ US | 986 802 000 $ US | 962 780 000 $ US | 581 207 000 $ US |
| 2001 | 344 044 000 $ US | 282 110 000 $ US | 834 558 000 $ US | 752 214 000 $ US | 508 699 000 $ US |
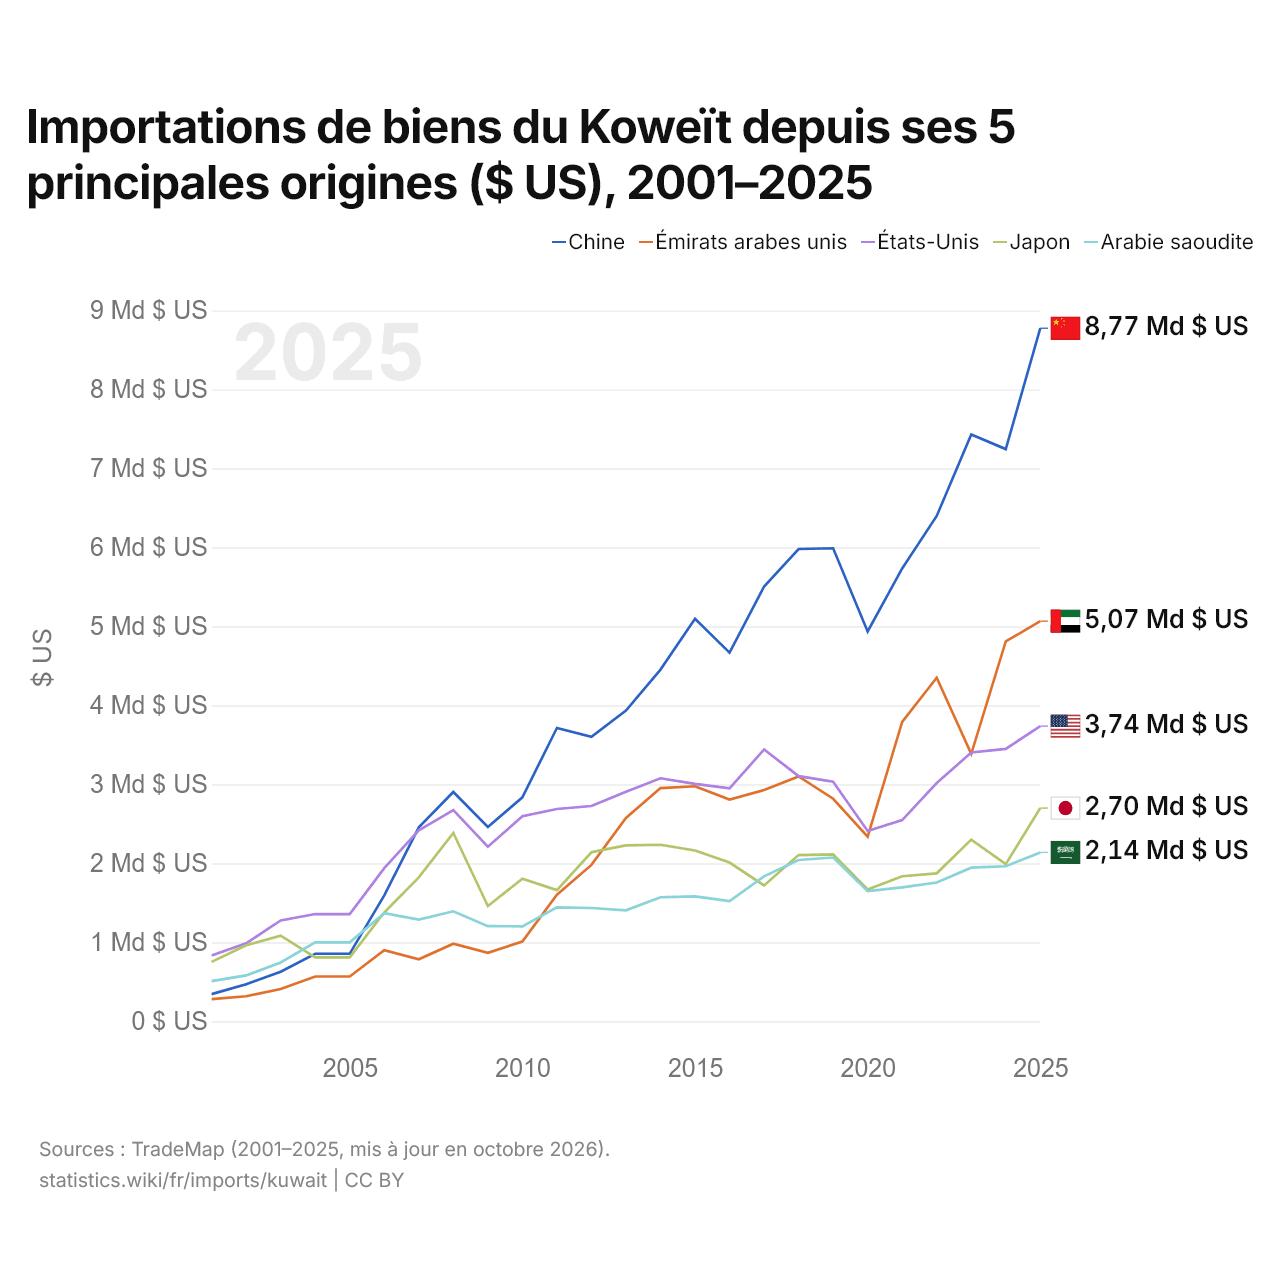
En 2025, les importations de biens s'élevaient à 8,77 milliards de dollars en provenance de la Chine, 5,07 milliards de dollars en provenance des Émirats arabes unis, 3,74 milliards de dollars en provenance des États-Unis, 2,7 milliards de dollars en provenance du Japon et 2,14 milliards de dollars en provenance de l'Arabie saoudite. Le premier rang des cinq fournisseurs du Koweït est occupé par la Chine depuis 2007. Le changement le plus récent dans leur ordre remonte à 2024, quand les importations du Koweït en provenance des Émirats arabes unis ont dépassé celles en provenance des États-Unis.
Importations de biens et de services du Koweït ($ US), 1975–2025
| Année | $ US | |
|---|---|---|
| Biens | Services | |
| 2025 | 37 508 423 093 $ US | 29 598 380 974 $ US |
| 2024 | 33 443 405 536 $ US | 28 077 485 650 $ US |
| 2023 | 33 028 053 860 $ US | 30 402 336 869 $ US |
| 2022 | 28 364 274 802 $ US | 27 544 877 826 $ US |
| 2021 | 27 866 083 169 $ US | 21 087 948 774 $ US |
| 2020 | 24 835 854 374 $ US | 19 179 365 209 $ US |
| 2019 | 29 436 065 811 $ US | 30 217 644 896 $ US |
| 2018 | 31 369 500 436 $ US | 36 835 282 619 $ US |
| 2017 | 29 526 868 427 $ US | 28 199 967 084 $ US |
| 2016 | 26 562 436 858 $ US | 26 347 954 128 $ US |
| 2015 | 27 342 757 606 $ US | 23 796 426 826 $ US |
| 2014 | 27 384 704 019 $ US | 23 786 773 434 $ US |
| 2013 | 25 576 252 707 $ US | 21 004 020 354 $ US |
| 2012 | 24 241 446 997 $ US | 21 097 204 164 $ US |
| 2011 | 22 597 216 656 $ US | 19 013 151 372 $ US |
| 2010 | 19 569 216 700 $ US | 15 784 903 368 $ US |
| 2009 | 18 528 664 731 $ US | 13 742 570 827 $ US |
| 2008 | 22 939 171 474 $ US | 15 777 352 861 $ US |
| 2007 | 19 962 073 760 $ US | 13 343 820 347 $ US |
| 2006 | 16 240 131 320 $ US | 10 638 362 947 $ US |
| 2005 | 15 053 424 658 $ US | 8 714 726 027 $ US |
| 2004 | 12 402 443 163 $ US | 7 495 079 742 $ US |
| 2003 | 9 880 154 933 $ US | 6 615 180 490 $ US |
| 2002 | 8 116 763 154 $ US | 5 838 488 950 $ US |
| 2001 | 7 047 046 612 $ US | 5 354 738 083 $ US |
| 2000 | 6 451 474 442 $ US | 4 920 919 995 $ US |
| 1999 | 6 707 955 377 $ US | 5 171 564 226 $ US |
| 1998 | 7 714 377 329 $ US | 5 546 082 757 $ US |
| 1997 | 7 746 856 849 $ US | 5 129 408 194 $ US |
| 1996 | 7 949 004 442 $ US | 5 072 333 213 $ US |
| 1995 | 7 254 201 821 $ US | 5 360 402 805 $ US |
| 1994 | 6 599 572 948 $ US | 4 500 281 545 $ US |
| 1993 | 6 940 132 905 $ US | 4 538 849 571 $ US |
| 1992 | 7 236 821 164 $ US | 4 590 368 184 $ US |
| 1991 | 5 072 667 600 $ US | 5 090 256 600 $ US |
| 1990 | 3 809 953 026 $ US | 3 359 276 144 $ US |
| 1989 | 6 409 570 900 $ US | 4 118 736 478 $ US |
| 1988 | 5 999 371 034 $ US | 4 203 860 348 $ US |
| 1987 | 4 937 859 585 $ US | 4 076 605 006 $ US |
| 1986 | 5 265 065 660 $ US | 3 861 048 151 $ US |
| 1985 | 5 718 973 945 $ US | 4 086 406 382 $ US |
| 1984 | 6 549 305 717 $ US | 3 705 306 019 $ US |
| 1983 | 6 889 059 182 $ US | 3 619 500 716 $ US |
| 1982 | 7 811 441 757 $ US | 3 490 662 057 $ US |
| 1981 | 6 736 365 878 $ US | 2 905 461 321 $ US |
| 1980 | 6 755 521 489 $ US | 3 066 991 958 $ US |
| 1979 | 4 870 351 632 $ US | 2 265 111 531 $ US |
| 1978 | 4 326 442 853 $ US | 1 854 189 794 $ US |
| 1977 | 4 735 383 837 $ US | 1 406 307 801 $ US |
| 1976 | 3 300 415 641 $ US | 974 734 153 $ US |
| 1975 | 2 399 732 452 $ US | 758 536 120 $ US |
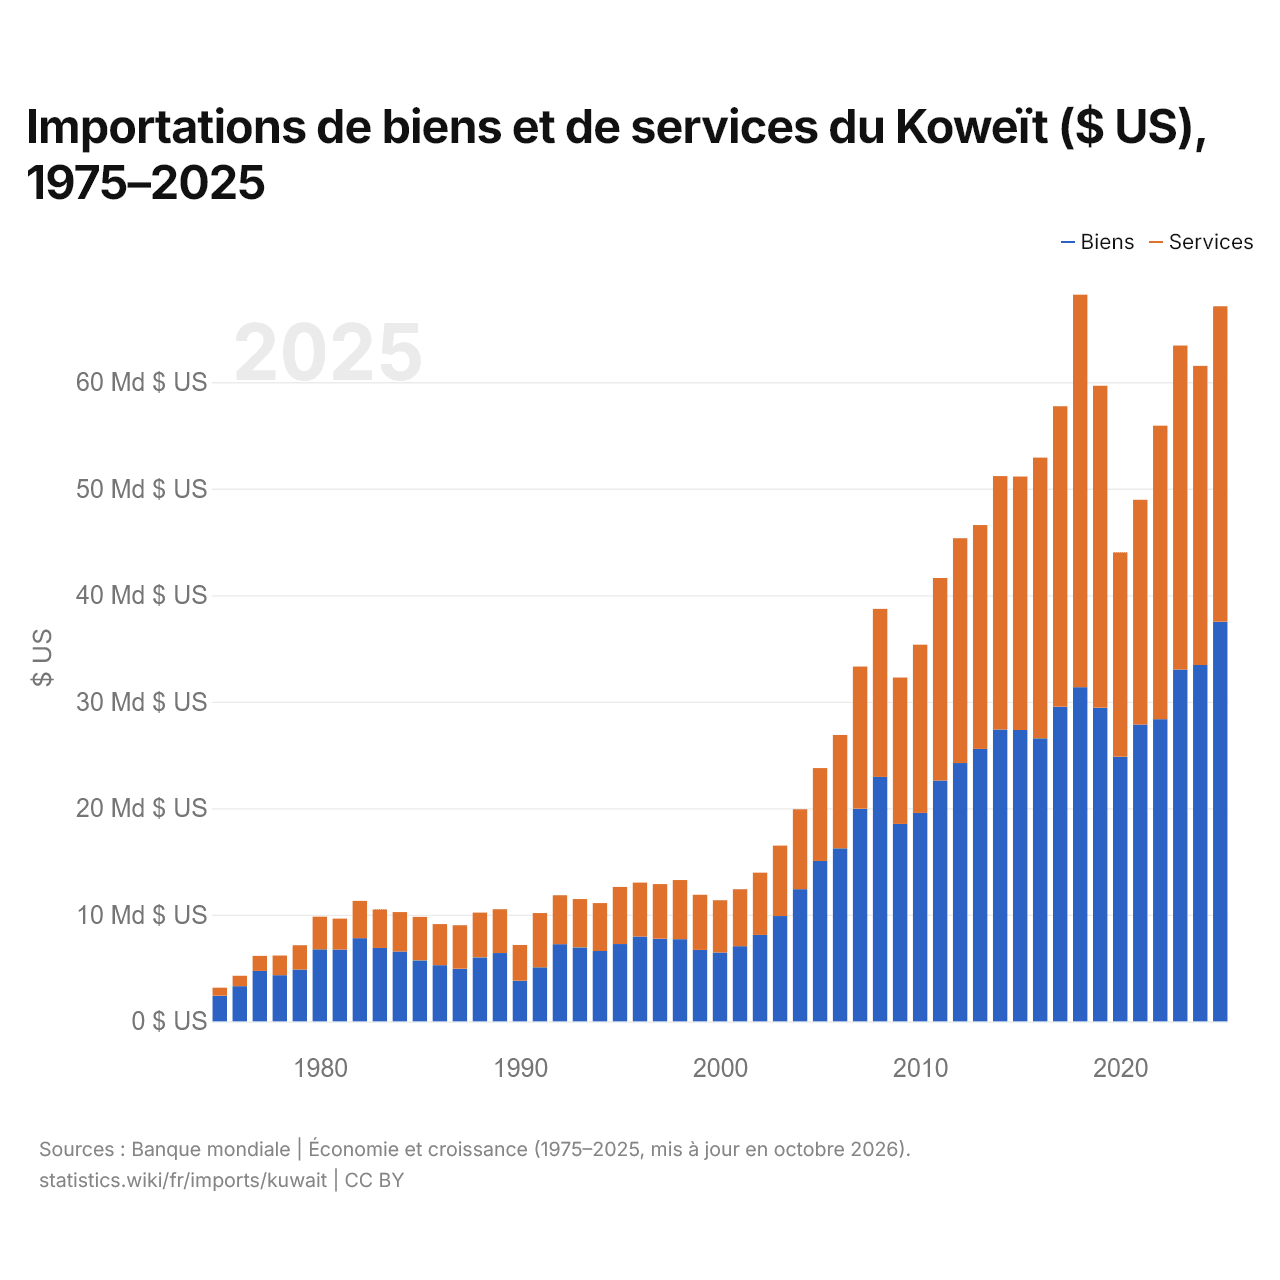
En 2025, les importations de biens du Koweït s'élevaient à 37,5 milliards de dollars et celles de services à 29,6 milliards de dollars ; les services représentaient 44,1 % du total, contre 24,0 % en 1975.
Le Koweït dans le classement mondial des importations, 2025







Importations de biens et services du Koweït, % du PIB, 1965–2025
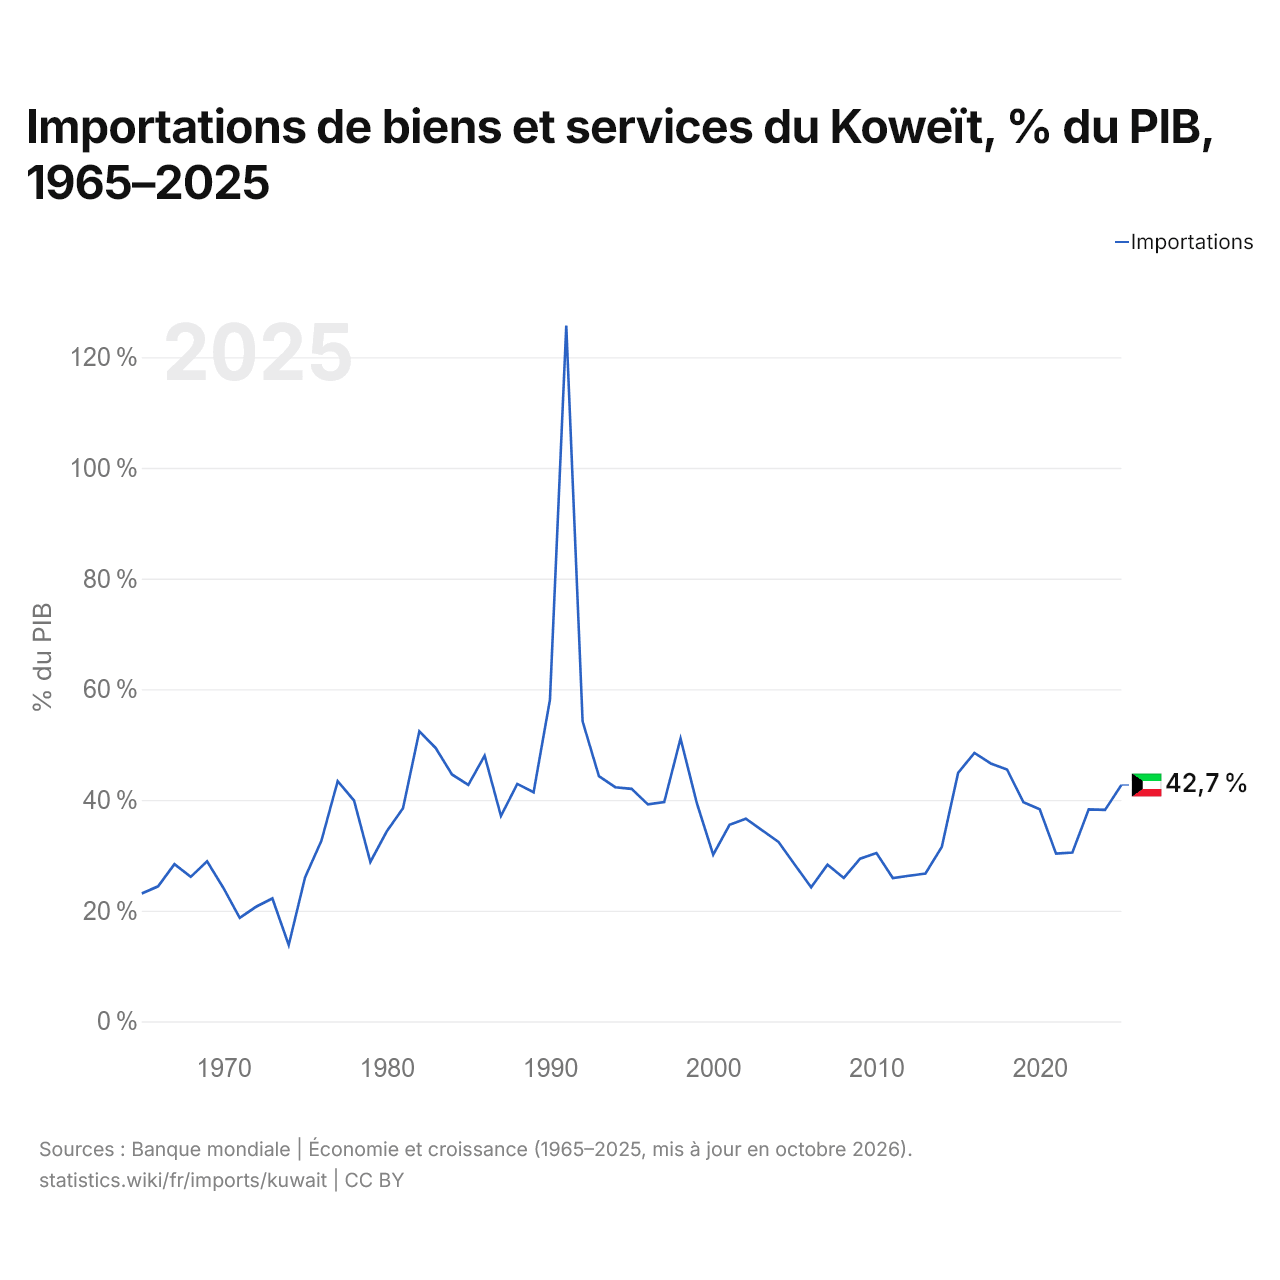
En 2025, les importations de biens et services du Koweït équivalaient à 42,7 % de son PIB, contre 23,1 % en 1965. La part la plus élevée a été de 125,7 %, en 1991.
Comparer les importations du Koweït avec celles d'autres pays
Sources :
- TradeMap (2001–2025, mis à jour en octobre 2026)
- Banque mondiale | Économie et croissance (1965–2025, mis à jour en octobre 2026)
Creative Commons Attribution (CC BY) : vous pouvez copier, partager, adapter et réutiliser ce contenu, y compris à des fins commerciales, à condition de citer statistics.wiki et d’indiquer les modifications apportées. Les sources citées ci-dessus peuvent avoir leurs propres conditions de licence.