
Importations de biens et services du Pakistan par année ($ US), 1960–2025
| Année | $ US | Rang mondial |
|---|---|---|
| Importations | Rang mondial | |
| 2025 | 70 090 772 303 $ US | #56 |
| 2024 | 63 865 509 443 $ US | #58 |
| 2023 | 60 515 108 026 $ US | #59 |
| 2022 | 84 315 688 680 $ US | #51 |
| 2021 | 62 659 182 540 $ US | #53 |
| 2020 | 52 327 295 403 $ US | #54 |
| 2019 | 62 624 564 039 $ US | #54 |
| 2018 | 67 821 965 005 $ US | #51 |
| 2017 | 58 514 391 836 $ US | #52 |
| 2016 | 50 070 595 635 $ US | #54 |
| 2015 | 50 134 759 860 $ US | #55 |
| 2014 | 49 596 212 908 $ US | #59 |
| 2013 | 48 401 946 136 $ US | #59 |
| 2012 | 48 633 322 391 $ US | #59 |
| 2011 | 43 534 938 844 $ US | #60 |
| 2010 | 38 066 808 316 $ US | #56 |
| 2009 | 39 220 849 369 $ US | #54 |
| 2008 | 45 441 542 692 $ US | #54 |
| 2007 | 35 286 555 607 $ US | #53 |
| 2006 | 33 184 884 875 $ US | #52 |
| 2005 | 25 595 408 507 $ US | #53 |
| 2004 | 17 697 600 000 $ US | #59 |
| 2003 | 14 030 211 712 $ US | #58 |
| 2002 | 11 619 627 152 $ US | #58 |
| 2001 | 12 581 363 105 $ US | #52 |
| 2000 | 11 769 388 548 $ US | #51 |
| 1999 | 10 684 436 463 $ US | #55 |
| 1998 | 10 900 343 052 $ US | #54 |
| 1997 | 12 967 600 154 $ US | #50 |
| 1996 | 13 567 628 711 $ US | #48 |
| 1995 | 11 777 213 240 $ US | #49 |
| 1994 | 9 883 122 490 $ US | #50 |
| 1993 | 11 552 190 707 $ US | #49 |
| 1992 | 9 984 113 697 $ US | #50 |
| 1991 | 8 434 875 711 $ US | #51 |
| 1990 | 8 100 453 419 $ US | #53 |
| 1989 | 8 174 710 143 $ US | #49 |
| 1988 | 7 473 483 338 $ US | #47 |
| 1987 | 6 366 035 537 $ US | #47 |
| 1986 | 6 415 065 096 $ US | #45 |
| 1985 | 7 040 171 504 $ US | #44 |
| 1984 | 6 843 425 349 $ US | #43 |
| 1983 | 6 458 110 236 $ US | #44 |
| 1982 | 6 492 985 782 $ US | #45 |
| 1981 | 6 275 656 566 $ US | #46 |
| 1980 | 5 512 929 293 $ US | #46 |
| 1979 | 4 295 858 586 $ US | #47 |
| 1978 | 3 292 929 293 $ US | #47 |
| 1977 | 2 701 111 111 $ US | #49 |
| 1976 | 2 409 494 949 $ US | #48 |
| 1975 | 2 324 848 485 $ US | #47 |
| 1974 | 1 535 555 556 $ US | #51 |
| 1973 | 907 783 978 $ US | #51 |
| 1972 | 814 017 565 $ US | #51 |
| 1971 | 1 117 807 644 $ US | #46 |
| 1970 | 1 037 799 244 $ US | #46 |
| 1969 | 916 841 663 $ US | - |
| 1968 | 932 801 344 $ US | - |
| 1967 | 1 013 229 735 $ US | - |
| 1966 | 806 173 877 $ US | - |
| 1965 | 1 007 139 857 $ US | - |
| 1964 | 801 763 965 $ US | - |
| 1963 | 732 255 355 $ US | - |
| 1962 | 620 327 593 $ US | - |
| 1961 | 577 278 454 $ US | - |
| 1960 | 495 590 088 $ US | - |
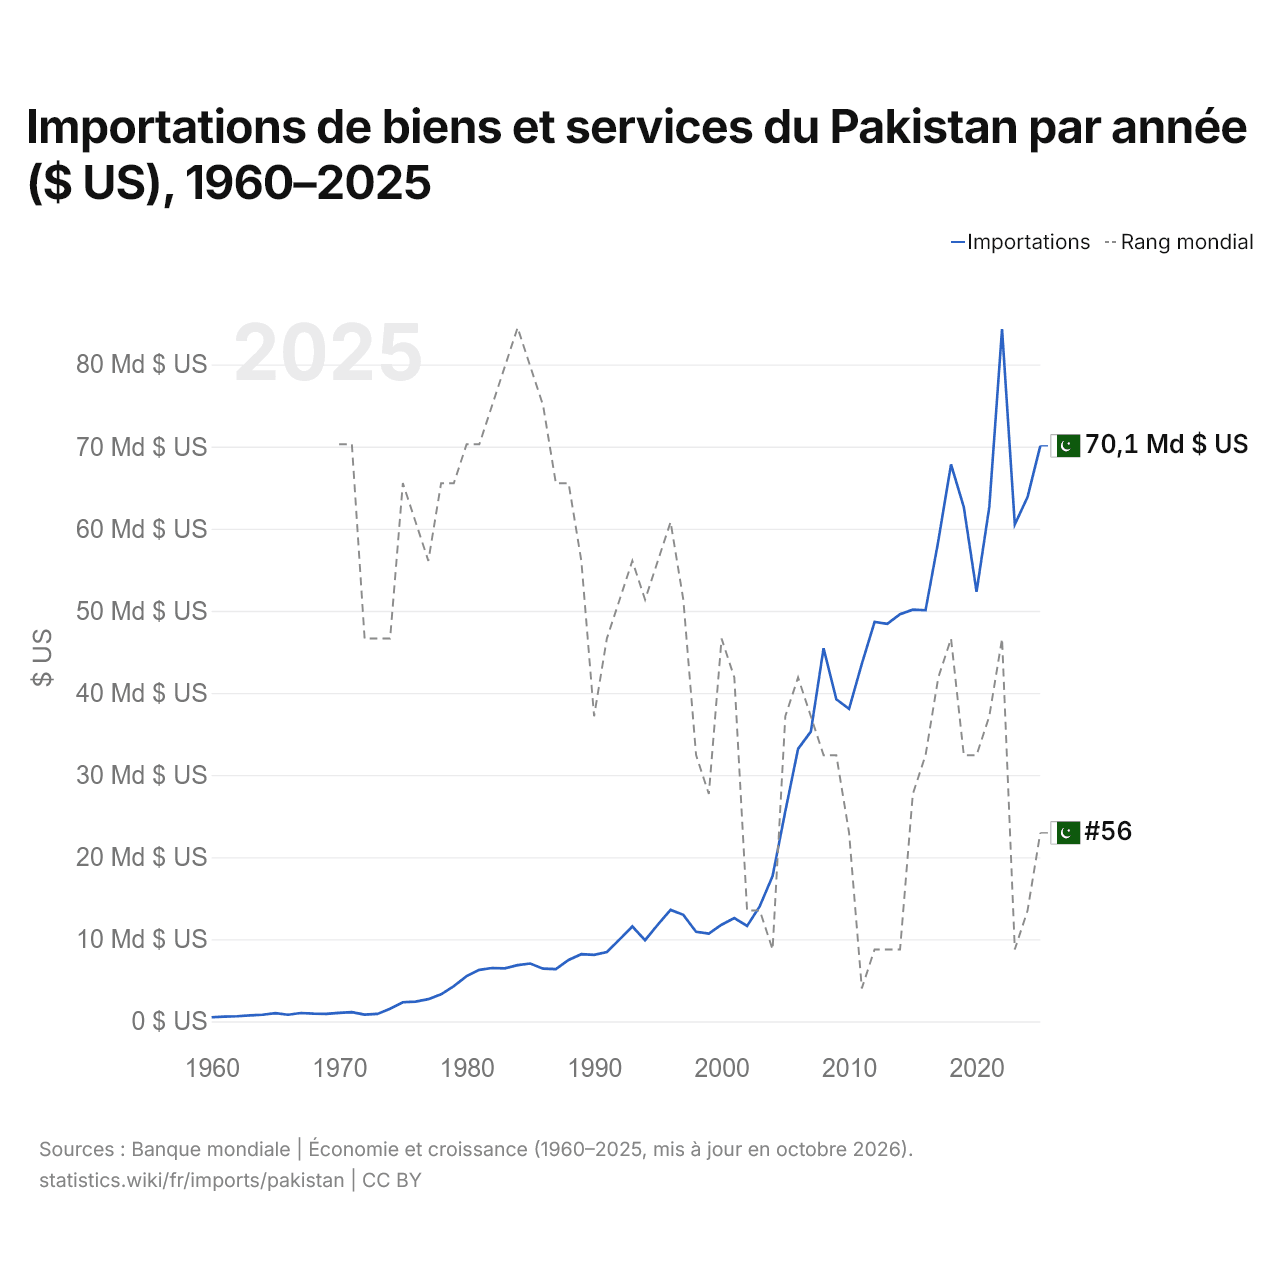
En 2025, les importations de biens et services du Pakistan s'élevaient à 70,1 milliards de dollars, contre 496 millions de dollars en 1960. Le maximum a été de 84,3 milliards de dollars, en 2022. Elles se classaient au 56e rang mondial, en hausse par rapport au 58e rang en 2024. Leur meilleur rang a été le 43e, occupé pour la dernière fois en 1984.
En 2025, les importations de biens et services du Pakistan étaient les 20es plus élevées de 44 pays situés en Asie. En 2025, les importations du Pakistan dépassaient ses exportations de 29,4 milliards de dollars, soit un déficit commercial. Le commerce du Pakistan, exportations et importations réunies, équivalait à 27,2 % de son PIB en 2025, au 170e rang mondial.
Importations de biens du Pakistan par catégorie, 2025
Importations de biens, 2025: 65,0 Md $US
En 2025, la première catégorie des importations de biens du Pakistan était « pétrole, gaz, minerais et autres matières premières », avec 29,3 %, suivie de « machines, électronique et véhicules », avec 23,0 %.
Origines des importations de biens du Pakistan : les 10 premières, 2025
| Rang | Pays | Importations de biens | Part | |
|---|---|---|---|---|
| 1 |
 Chine |
20,4 Md $US | 31,4 % | |
| 2 |
 EAU |
6,94 Md $US | 10,7 % | vs EAU |
| 3 |
 Indonésie |
4,33 Md $US | 6,66 % | vs Indonésie |
| 4 |
 Arabie saoudite |
4,14 Md $US | 6,37 % | vs Arabie saoudite |
| 5 |
 Qatar |
3,16 Md $US | 4,86 % | vs Qatar |
| 6 |
 États-Unis |
2,75 Md $US | 4,23 % | vs USA |
| 7 |
 Japon |
1,74 Md $US | 2,67 % | vs Japon |
| 8 |
 Koweït |
1,63 Md $US | 2,5 % | |
| 9 |
 Brésil |
1,37 Md $US | 2,11 % | vs Brésil |
| 10 |
 Corée du Sud |
1,25 Md $US | 1,93 % | vs Corée du Sud |
| Autres partenaires et non précisés | 17,3 Md $US | 26,6 % |
Importations de biens du Pakistan depuis ses 5 principales origines ($ US), 2003–2025
| Année | $ US | ||||
|---|---|---|---|---|---|
| Chine | Émirats arabes unis | Indonésie | Arabie saoudite | Qatar | |
| 2025 | 20 434 250 000 $ US | 6 936 645 000 $ US | 4 331 465 000 $ US | 4 142 073 000 $ US | 3 159 785 000 $ US |
| 2024 | 16 003 446 000 $ US | 5 663 818 000 $ US | 3 327 322 000 $ US | 4 474 049 000 $ US | 3 740 795 000 $ US |
| 2023 | 11 777 695 000 $ US | 4 855 668 000 $ US | 3 517 481 000 $ US | 4 507 282 000 $ US | 3 320 379 000 $ US |
| 2022 | 16 343 912 000 $ US | 7 943 945 000 $ US | 4 955 306 000 $ US | 5 148 536 000 $ US | 4 139 625 000 $ US |
| 2021 | 20 705 497 000 $ US | 7 373 763 000 $ US | 4 203 791 000 $ US | 3 781 055 000 $ US | 2 672 410 000 $ US |
| 2020 | 12 504 581 000 $ US | 4 481 028 000 $ US | 2 408 783 000 $ US | 1 895 867 000 $ US | 1 485 012 000 $ US |
| 2019 | 12 423 997 000 $ US | 6 340 201 000 $ US | 2 222 140 000 $ US | 2 439 770 000 $ US | 2 190 934 000 $ US |
| 2018 | 14 599 749 000 $ US | 8 702 013 000 $ US | 2 511 831 000 $ US | 3 254 606 000 $ US | 2 395 203 000 $ US |
| 2017 | 15 404 325 000 $ US | 7 534 899 000 $ US | 2 586 768 000 $ US | 2 734 072 000 $ US | 1 610 484 000 $ US |
| 2016 | 13 680 153 000 $ US | 6 202 090 000 $ US | 2 088 831 000 $ US | 1 843 133 000 $ US | 774 256 000 $ US |
| 2015 | 11 019 005 000 $ US | 5 734 688 000 $ US | 2 041 765 000 $ US | 3 006 751 000 $ US | 319 313 000 $ US |
| 2014 | 9 588 418 000 $ US | 7 077 180 000 $ US | 2 107 232 000 $ US | 4 417 354 000 $ US | 180 898 000 $ US |
| 2013 | 6 626 323 000 $ US | 7 751 513 000 $ US | 1 208 316 000 $ US | 3 847 222 000 $ US | 164 226 000 $ US |
| 2012 | 6 687 566 000 $ US | 7 210 795 000 $ US | 1 351 328 000 $ US | 4 283 523 000 $ US | 345 668 000 $ US |
| 2011 | 6 470 653 000 $ US | 6 818 753 000 $ US | 929 761 000 $ US | 4 668 279 000 $ US | 252 059 000 $ US |
| 2010 | 5 247 713 000 $ US | 5 247 779 000 $ US | 675 655 000 $ US | 3 837 918 000 $ US | 153 701 000 $ US |
| 2009 | 3 779 769 000 $ US | 3 349 590 000 $ US | 653 589 000 $ US | 3 500 108 000 $ US | 168 005 000 $ US |
| 2008 | 4 738 055 000 $ US | 3 777 884 000 $ US | 1 191 686 000 $ US | 5 954 944 000 $ US | 848 151 000 $ US |
| 2007 | 4 164 230 000 $ US | 2 766 898 000 $ US | 876 974 000 $ US | 4 011 781 000 $ US | 362 381 000 $ US |
| 2006 | 2 914 926 000 $ US | 3 408 355 000 $ US | 808 935 000 $ US | 3 033 230 000 $ US | 642 767 000 $ US |
| 2005 | 2 349 395 000 $ US | 2 480 738 000 $ US | 684 079 000 $ US | 2 650 629 000 $ US | 326 611 000 $ US |
| 2004 | 1 139 816 000 $ US | 471 380 000 $ US | 353 705 000 $ US | 1 757 829 000 $ US | 96 650 000 $ US |
| 2003 | 957 331 000 $ US | 1 456 909 000 $ US | 265 923 000 $ US | 1 416 666 000 $ US | 29 883 000 $ US |
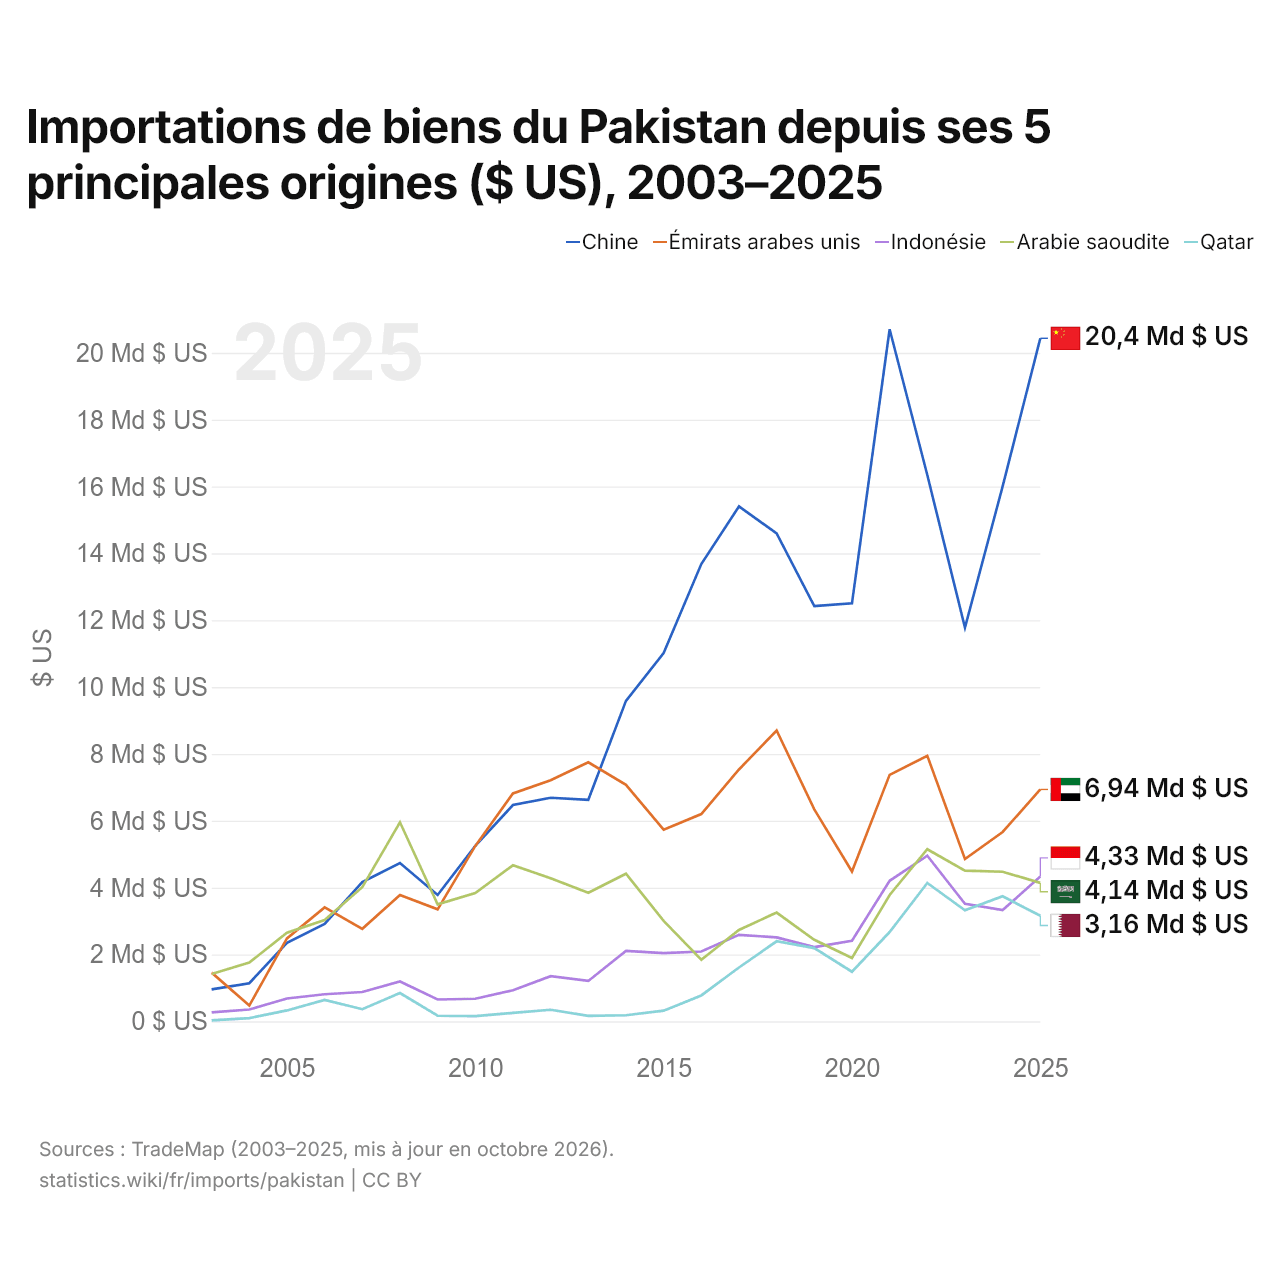
En 2025, les importations de biens s'élevaient à 20,4 milliards de dollars en provenance de la Chine, 6,94 milliards de dollars en provenance des Émirats arabes unis, 4,33 milliards de dollars en provenance de l'Indonésie, 4,14 milliards de dollars en provenance de l'Arabie saoudite et 3,16 milliards de dollars en provenance du Qatar. Le premier rang des cinq fournisseurs du Pakistan est occupé par la Chine depuis 2014. Le changement le plus récent dans leur ordre remonte à 2025, quand les importations du Pakistan en provenance de l'Indonésie ont dépassé celles en provenance de l'Arabie saoudite.
Importations de biens et de services du Pakistan ($ US), 1976–2025
| Année | $ US | |
|---|---|---|
| Biens | Services | |
| 2025 | 62 617 000 000 $ US | 12 035 089 300 $ US |
| 2024 | 55 651 000 000 $ US | 11 329 549 203 $ US |
| 2023 | 48 337 000 000 $ US | 9 731 663 330 $ US |
| 2022 | 65 880 000 000 $ US | 10 713 867 000 $ US |
| 2021 | 65 927 000 000 $ US | 10 587 126 000 $ US |
| 2020 | 44 113 000 000 $ US | 7 984 944 000 $ US |
| 2019 | 47 681 000 000 $ US | 10 295 078 000 $ US |
| 2018 | 56 753 000 000 $ US | 11 669 877 000 $ US |
| 2017 | 52 757 000 000 $ US | 11 741 061 000 $ US |
| 2016 | 42 200 000 000 $ US | 9 706 109 000 $ US |
| 2015 | 39 815 000 000 $ US | 8 807 000 000 $ US |
| 2014 | 42 675 000 000 $ US | 8 466 000 000 $ US |
| 2013 | 41 214 000 000 $ US | 7 953 000 000 $ US |
| 2012 | 40 385 000 000 $ US | 8 517 000 000 $ US |
| 2011 | 38 995 000 000 $ US | 8 156 000 000 $ US |
| 2010 | 32 843 000 000 $ US | 7 173 000 000 $ US |
| 2009 | 28 536 000 000 $ US | 6 615 430 000 $ US |
| 2008 | 38 132 000 000 $ US | 9 797 000 000 $ US |
| 2007 | 28 639 000 000 $ US | 8 947 000 000 $ US |
| 2006 | 26 597 000 000 $ US | 8 501 000 000 $ US |
| 2005 | 21 683 200 000 $ US | 7 592 000 000 $ US |
| 2004 | 16 643 000 000 $ US | 5 364 000 000 $ US |
| 2003 | 11 978 000 000 $ US | 3 232 000 000 $ US |
| 2002 | 10 428 000 000 $ US | 2 138 000 000 $ US |
| 2001 | 9 741 000 000 $ US | 2 211 000 000 $ US |
| 2000 | 9 896 000 000 $ US | 2 130 000 000 $ US |
| 1999 | 9 520 000 000 $ US | 2 045 000 000 $ US |
| 1998 | 9 834 000 000 $ US | 2 162 000 000 $ US |
| 1997 | 10 750 177 379 $ US | 2 658 273 721 $ US |
| 1996 | 12 163 732 482 $ US | 3 458 796 693 $ US |
| 1995 | 11 247 761 165 $ US | 2 937 533 913 $ US |
| 1994 | 9 355 275 505 $ US | 2 529 483 791 $ US |
| 1993 | 9 379 891 899 $ US | 2 638 769 455 $ US |
| 1992 | 9 716 526 928 $ US | 2 683 434 138 $ US |
| 1991 | 8 683 283 103 $ US | 2 314 175 682 $ US |
| 1990 | 8 132 503 396 $ US | 2 072 863 338 $ US |
| 1989 | 7 400 895 822 $ US | 1 712 051 967 $ US |
| 1988 | 7 130 851 528 $ US | 1 492 808 483 $ US |
| 1987 | 6 283 337 657 $ US | 1 287 617 761 $ US |
| 1986 | 5 999 165 490 $ US | 1 201 163 972 $ US |
| 1985 | 5 905 892 148 $ US | 1 184 234 929 $ US |
| 1984 | 6 263 361 660 $ US | 1 092 382 699 $ US |
| 1983 | 5 618 267 353 $ US | 989 427 323 $ US |
| 1982 | 5 770 827 043 $ US | 951 012 704 $ US |
| 1981 | 5 682 517 595 $ US | 919 380 034 $ US |
| 1980 | 5 470 407 619 $ US | 877 465 479 $ US |
| 1979 | 4 309 384 592 $ US | 791 505 121 $ US |
| 1978 | 3 236 250 197 $ US | 619 482 915 $ US |
| 1977 | 2 499 244 147 $ US | 494 246 690 $ US |
| 1976 | 2 202 087 205 $ US | 441 777 381 $ US |
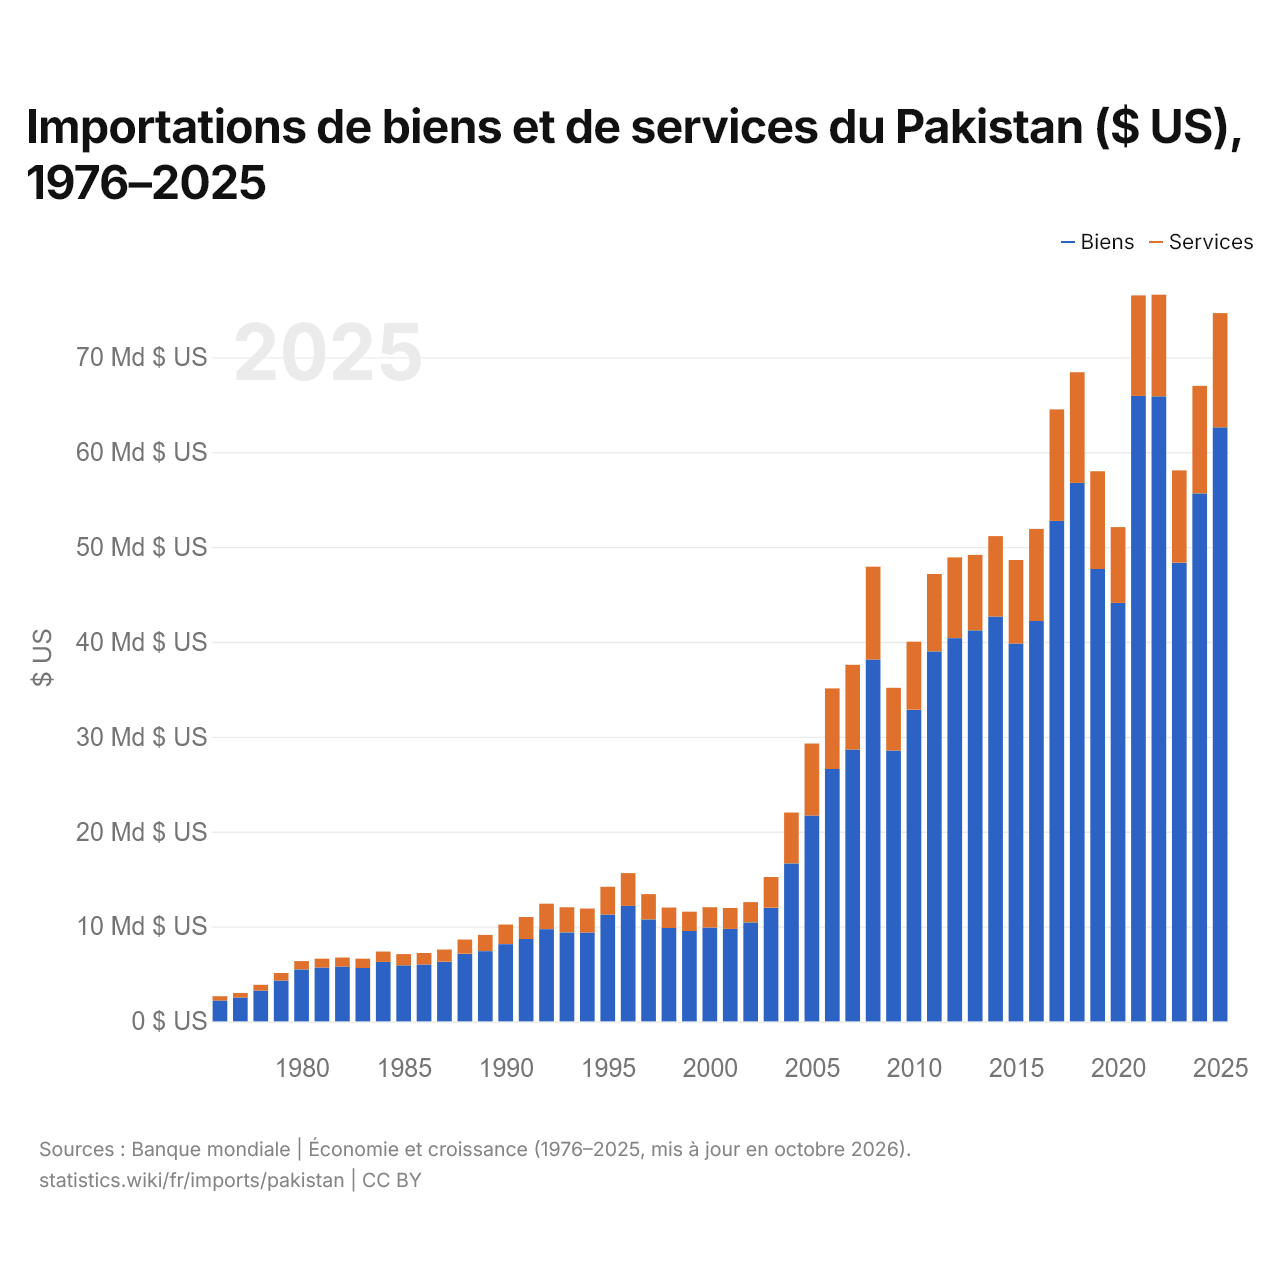
En 2025, les importations de biens du Pakistan s'élevaient à 62,6 milliards de dollars et celles de services à 12 milliards de dollars ; les services représentaient 16,1 % du total, contre 16,7 % en 1976.
Le Pakistan dans le classement mondial des importations, 2025
| Rang | Pays | Importations | Part mondiale | |
|---|---|---|---|---|
| 53 |
 Kazakhstan |
80,3 Md $US | 0,24 % | |
| 54 |
 Bangladesh |
76,8 Md $US | 0,23 % | vs Bangladesh |
| 55 |
 Pérou |
73,2 Md $US | 0,22 % | |
| 56 |
 Pakistan |
70,1 Md $US | 0,21 % | |
| 57 |
 Nouvelle-Zélande |
68,4 Md $US | 0,2 % | |
| 58 |
 Bulgarie |
67,7 Md $US | 0,2 % | |
| 59 |
Koweït
|
67,1 Md $US | 0,2 % |
Importations de biens et services du Pakistan, % du PIB, 1960–2025
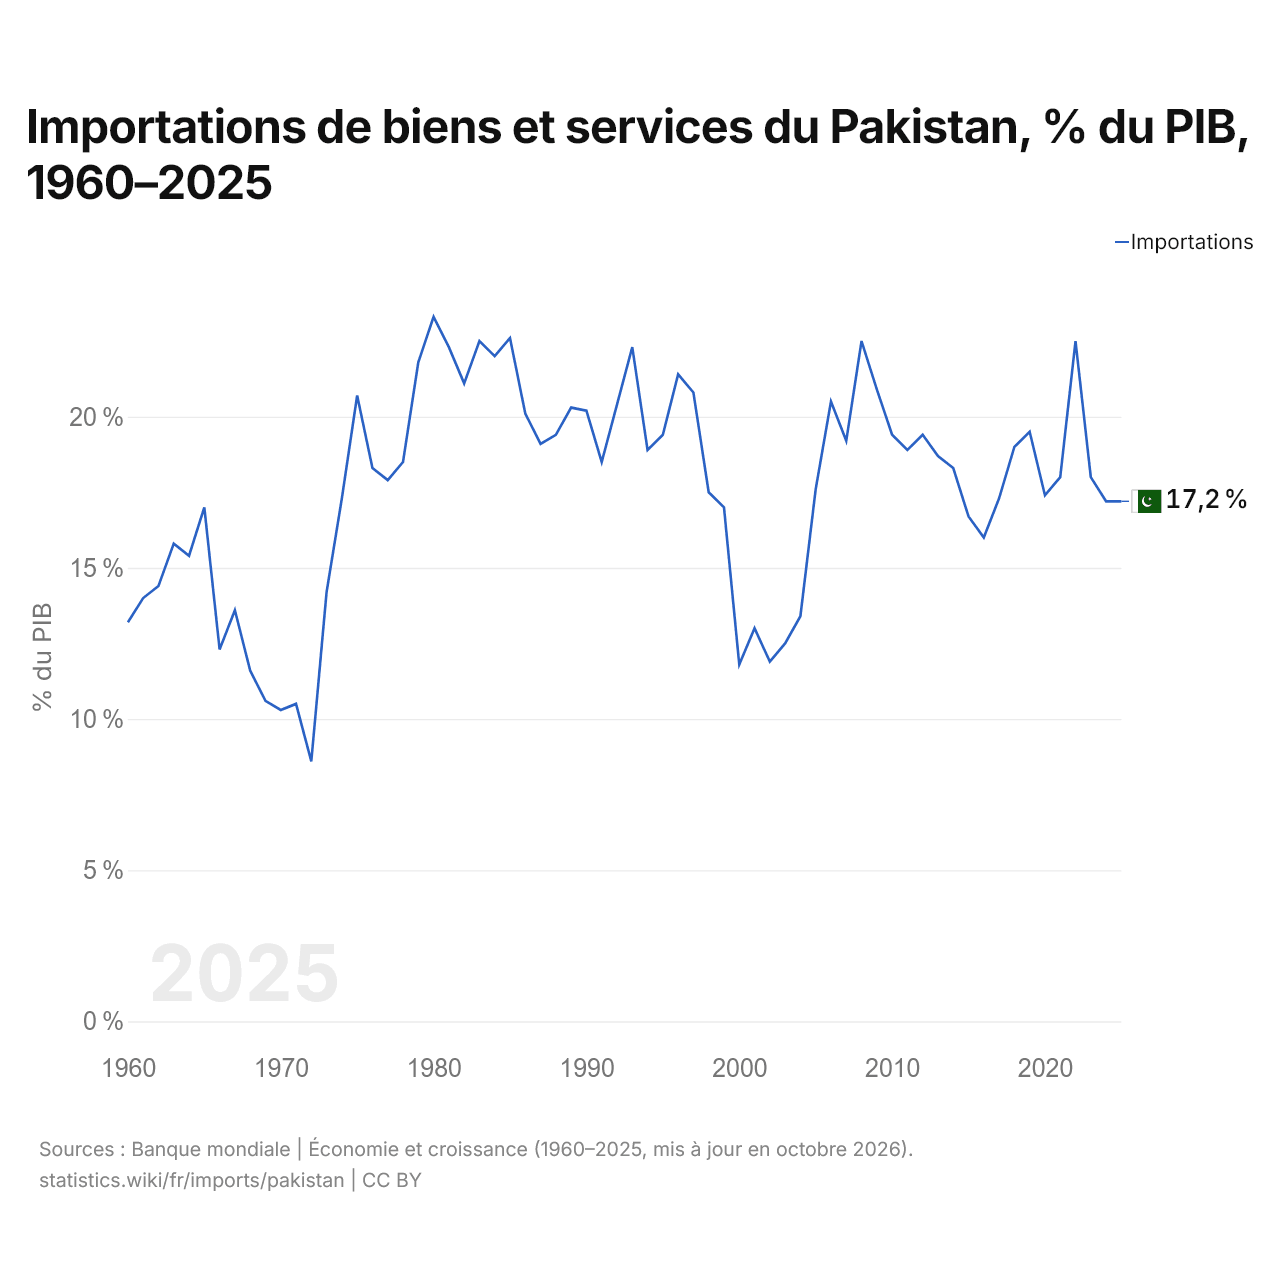
En 2025, les importations de biens et services du Pakistan équivalaient à 17,2 % de son PIB, contre 13,2 % en 1960. La part la plus élevée a été de 23,3 %, en 1980.
Comparer les importations du Pakistan avec celles d'autres pays
Sources :
- Banque mondiale | Économie et croissance (1960–2025, mis à jour en octobre 2026)
- TradeMap (2003–2025, mis à jour en octobre 2026)
Creative Commons Attribution (CC BY) : vous pouvez copier, partager, adapter et réutiliser ce contenu, y compris à des fins commerciales, à condition de citer statistics.wiki et d’indiquer les modifications apportées. Les sources citées ci-dessus peuvent avoir leurs propres conditions de licence.