
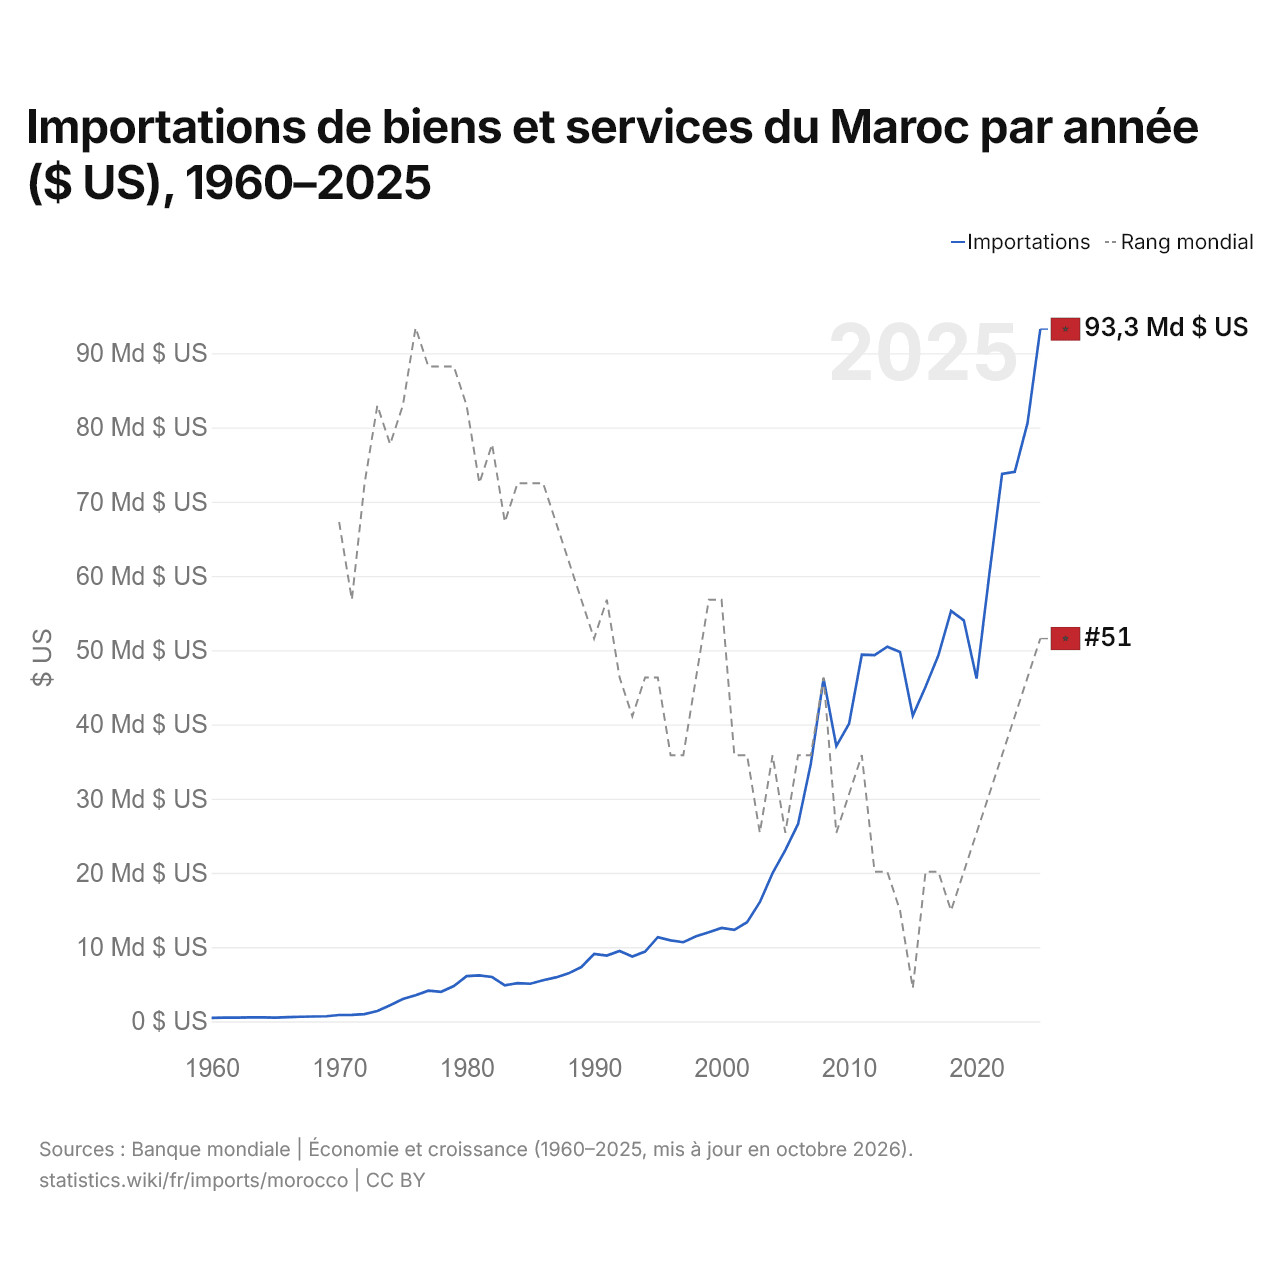
Importations de biens et services du Maroc par année ($ US), 1960–2025
| Année | $ US | Rang mondial |
|---|---|---|
| Importations | Rang mondial | |
| 2025 | 93 252 409 527 $ US | #51 |
| 2024 | 80 608 604 200 $ US | #52 |
| 2023 | 74 040 709 936 $ US | #53 |
| 2022 | 73 752 886 131 $ US | #54 |
| 2021 | 60 199 361 761 $ US | #55 |
| 2020 | 46 174 693 559 $ US | #56 |
| 2019 | 54 024 112 942 $ US | #57 |
| 2018 | 55 299 739 977 $ US | #58 |
| 2017 | 49 273 637 902 $ US | #57 |
| 2016 | 45 062 154 626 $ US | #57 |
| 2015 | 41 176 430 828 $ US | #60 |
| 2014 | 49 749 730 471 $ US | #58 |
| 2013 | 50 467 526 992 $ US | #57 |
| 2012 | 49 324 878 353 $ US | #57 |
| 2011 | 49 394 706 346 $ US | #54 |
| 2010 | 40 097 025 623 $ US | #55 |
| 2009 | 37 077 112 112 $ US | #56 |
| 2008 | 46 189 159 809 $ US | #52 |
| 2007 | 34 711 235 493 $ US | #54 |
| 2006 | 26 592 143 477 $ US | #54 |
| 2005 | 23 064 213 862 $ US | #56 |
| 2004 | 19 968 080 463 $ US | #54 |
| 2003 | 16 048 236 121 $ US | #56 |
| 2002 | 13 353 797 750 $ US | #54 |
| 2001 | 12 314 903 926 $ US | #54 |
| 2000 | 12 579 800 085 $ US | #50 |
| 1999 | 12 003 458 114 $ US | #50 |
| 1998 | 11 452 325 639 $ US | #52 |
| 1997 | 10 658 406 550 $ US | #54 |
| 1996 | 10 902 426 721 $ US | #54 |
| 1995 | 11 335 099 532 $ US | #52 |
| 1994 | 9 390 609 855 $ US | #52 |
| 1993 | 8 739 349 823 $ US | #53 |
| 1992 | 9 469 830 979 $ US | #52 |
| 1991 | 8 865 788 883 $ US | #50 |
| 1990 | 9 074 317 736 $ US | #51 |
| 1989 | 7 314 302 141 $ US | #50 |
| 1988 | 6 462 582 987 $ US | #49 |
| 1987 | 5 914 964 605 $ US | #48 |
| 1986 | 5 526 888 963 $ US | #47 |
| 1985 | 5 067 330 816 $ US | #47 |
| 1984 | 5 148 384 843 $ US | #47 |
| 1983 | 4 852 572 440 $ US | #48 |
| 1982 | 5 968 583 545 $ US | #46 |
| 1981 | 6 184 035 098 $ US | #47 |
| 1980 | 6 085 317 298 $ US | #45 |
| 1979 | 4 752 055 200 $ US | #44 |
| 1978 | 3 980 131 861 $ US | #44 |
| 1977 | 4 123 911 421 $ US | #44 |
| 1976 | 3 520 253 831 $ US | #43 |
| 1975 | 2 996 086 107 $ US | #45 |
| 1974 | 2 163 914 003 $ US | #46 |
| 1973 | 1 379 890 190 $ US | #45 |
| 1972 | 975 395 583 $ US | #47 |
| 1971 | 859 393 116 $ US | #50 |
| 1970 | 853 751 317 $ US | #48 |
| 1969 | 687 680 442 $ US | - |
| 1968 | 656 062 950 $ US | - |
| 1967 | 614 564 993 $ US | - |
| 1966 | 557 258 289 $ US | - |
| 1965 | 497 975 492 $ US | - |
| 1964 | 535 521 284 $ US | - |
| 1963 | 533 545 171 $ US | - |
| 1962 | 501 927 679 $ US | - |
| 1961 | 501 927 679 $ US | - |
| 1960 | 462 405 814 $ US | - |
En 2025, les importations de biens et services du Maroc s'élevaient à 93,3 milliards de dollars, contre 462 millions de dollars en 1960. Elles se classaient au 51e rang mondial, en hausse par rapport au 52e rang en 2024. Leur meilleur rang a été le 43e, occupé pour la dernière fois en 1976.
En 2025, les importations de biens et services du Maroc étaient les 3es plus élevées de 50 pays situés en Afrique, après celles de l'Afrique du Sud et de l'Égypte. En 2025, les importations du Maroc dépassaient ses exportations de 16,7 milliards de dollars, soit un déficit commercial. Le commerce du Maroc, exportations et importations réunies, équivalait à 93,1 % de son PIB en 2025, au 70e rang mondial.
Importations de biens du Maroc par catégorie, 2025
Importations de biens, 2025: 88,0 Md $US
En 2025, la première catégorie des importations de biens du Maroc était « machines, électronique et véhicules », avec 35,1 %, suivie de « pétrole, gaz, minerais et autres matières premières », avec 18,8 %.
Origines des importations de biens du Maroc : les 10 premières, 2025
| Rang | Pays | Importations de biens | Part | |
|---|---|---|---|---|
| 1 |
 Chine |
12,2 Md $US | 13,9 % | vs Chine |
| 2 |
 Espagne |
12,0 Md $US | 13,6 % | vs Espagne |
| 3 |
 États-Unis |
8,16 Md $US | 9,27 % | vs USA |
| 4 |
 France |
7,94 Md $US | 9,02 % | vs France |
| 5 |
 Turquie |
4,87 Md $US | 5,53 % | vs Turquie |
| 6 |
 Allemagne |
4,70 Md $US | 5,34 % | vs Allemagne |
| 7 |
 Italie |
3,84 Md $US | 4,36 % | vs Italie |
| 8 |
 Arabie saoudite |
2,84 Md $US | 3,23 % | vs Arabie saoudite |
| 9 |
 Portugal |
2,00 Md $US | 2,27 % | vs Portugal |
| 10 |
 Inde |
1,84 Md $US | 2,09 % | vs Inde |
| Autres partenaires et non précisés | 27,7 Md $US | 31,4 % |
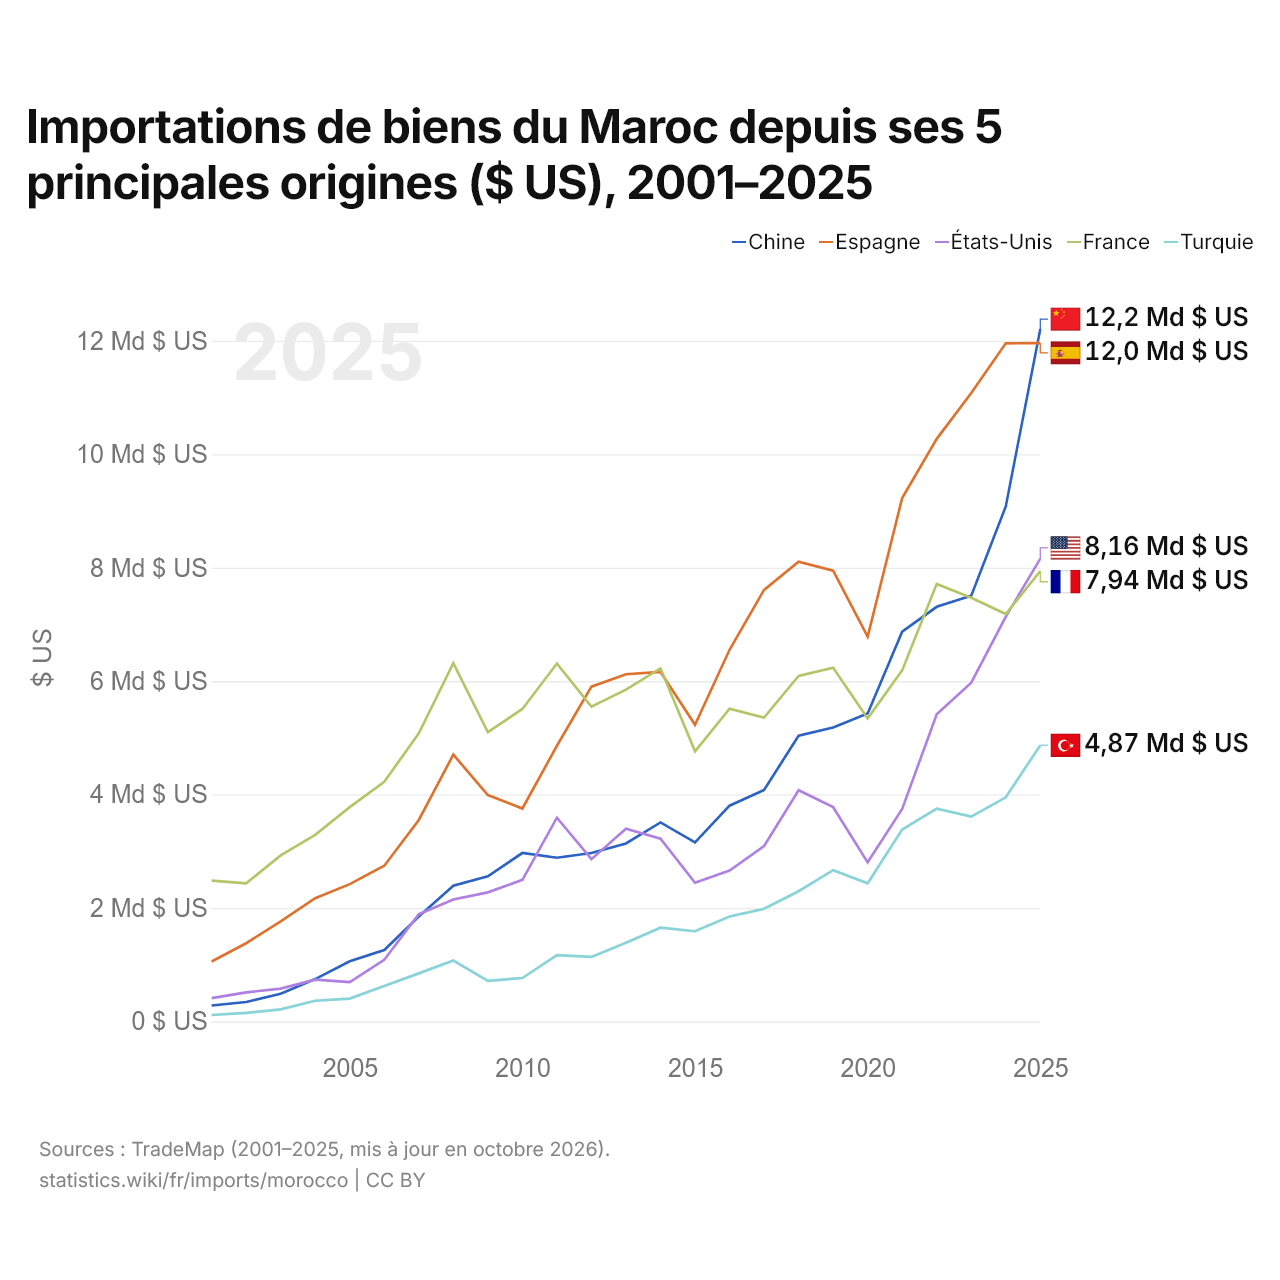
Importations de biens du Maroc depuis ses 5 principales origines ($ US), 2001–2025
| Année | $ US | ||||
|---|---|---|---|---|---|
| Chine | Espagne | États-Unis | France | Turquie | |
| 2025 | 12 208 421 000 $ US | 11 960 027 000 $ US | 8 158 365 000 $ US | 7 940 208 000 $ US | 4 868 958 000 $ US |
| 2024 | 9 079 598 000 $ US | 11 955 291 000 $ US | 7 133 251 000 $ US | 7 181 686 000 $ US | 3 949 791 000 $ US |
| 2023 | 7 505 898 000 $ US | 11 078 073 000 $ US | 5 970 402 000 $ US | 7 469 340 000 $ US | 3 610 532 000 $ US |
| 2022 | 7 309 266 000 $ US | 10 271 071 000 $ US | 5 414 058 000 $ US | 7 711 540 000 $ US | 3 751 028 000 $ US |
| 2021 | 6 870 479 000 $ US | 9 228 029 000 $ US | 3 745 619 000 $ US | 6 188 993 000 $ US | 3 381 864 000 $ US |
| 2020 | 5 428 752 000 $ US | 6 783 381 000 $ US | 2 803 125 000 $ US | 5 340 188 000 $ US | 2 433 128 000 $ US |
| 2019 | 5 181 673 000 $ US | 7 948 025 000 $ US | 3 776 676 000 $ US | 6 236 671 000 $ US | 2 665 874 000 $ US |
| 2018 | 5 037 380 000 $ US | 8 106 186 000 $ US | 4 075 179 000 $ US | 6 091 606 000 $ US | 2 293 732 000 $ US |
| 2017 | 4 078 630 000 $ US | 7 607 482 000 $ US | 3 090 912 000 $ US | 5 356 081 000 $ US | 1 984 845 000 $ US |
| 2016 | 3 802 775 000 $ US | 6 551 317 000 $ US | 2 658 373 000 $ US | 5 511 849 000 $ US | 1 848 730 000 $ US |
| 2015 | 3 155 693 000 $ US | 5 229 337 000 $ US | 2 443 021 000 $ US | 4 759 666 000 $ US | 1 589 001 000 $ US |
| 2014 | 3 507 532 000 $ US | 6 161 210 000 $ US | 3 219 824 000 $ US | 6 225 049 000 $ US | 1 651 925 000 $ US |
| 2013 | 3 136 793 000 $ US | 6 119 973 000 $ US | 3 396 954 000 $ US | 5 849 318 000 $ US | 1 387 349 000 $ US |
| 2012 | 2 967 814 000 $ US | 5 901 448 000 $ US | 2 858 984 000 $ US | 5 548 461 000 $ US | 1 136 434 000 $ US |
| 2011 | 2 884 588 000 $ US | 4 858 557 000 $ US | 3 591 265 000 $ US | 6 308 934 000 $ US | 1 168 590 000 $ US |
| 2010 | 2 968 060 000 $ US | 3 753 056 000 $ US | 2 494 766 000 $ US | 5 507 688 000 $ US | 762 977 000 $ US |
| 2009 | 2 558 024 000 $ US | 3 989 110 000 $ US | 2 273 869 000 $ US | 5 098 380 000 $ US | 714 434 000 $ US |
| 2008 | 2 391 949 000 $ US | 4 702 680 000 $ US | 2 149 436 000 $ US | 6 315 680 000 $ US | 1 072 369 000 $ US |
| 2007 | 1 848 823 000 $ US | 3 550 170 000 $ US | 1 889 484 000 $ US | 5 078 790 000 $ US | 845 581 000 $ US |
| 2006 | 1 258 430 000 $ US | 2 743 142 000 $ US | 1 083 946 000 $ US | 4 222 592 000 $ US | 624 038 000 $ US |
| 2005 | 1 060 269 000 $ US | 2 419 445 000 $ US | 690 099 000 $ US | 3 776 788 000 $ US | 401 356 000 $ US |
| 2004 | 744 978 000 $ US | 2 171 715 000 $ US | 735 050 000 $ US | 3 288 950 000 $ US | 363 449 000 $ US |
| 2003 | 486 822 000 $ US | 1 763 533 000 $ US | 577 861 000 $ US | 2 926 007 000 $ US | 210 088 000 $ US |
| 2002 | 341 180 000 $ US | 1 377 224 000 $ US | 510 405 000 $ US | 2 432 742 000 $ US | 150 234 000 $ US |
| 2001 | 278 724 000 $ US | 1 054 873 000 $ US | 408 256 000 $ US | 2 481 843 000 $ US | 112 317 000 $ US |
En 2025, les importations de biens s'élevaient à 12,2 milliards de dollars en provenance de la Chine, 12 milliards de dollars en provenance de l'Espagne, 8,16 milliards de dollars en provenance des États-Unis, 7,94 milliards de dollars en provenance de la France et 4,87 milliards de dollars en provenance de la Turquie. Le changement le plus récent dans leur ordre remonte à 2025, quand les importations du Maroc en provenance de la Chine ont dépassé celles en provenance de l'Espagne.
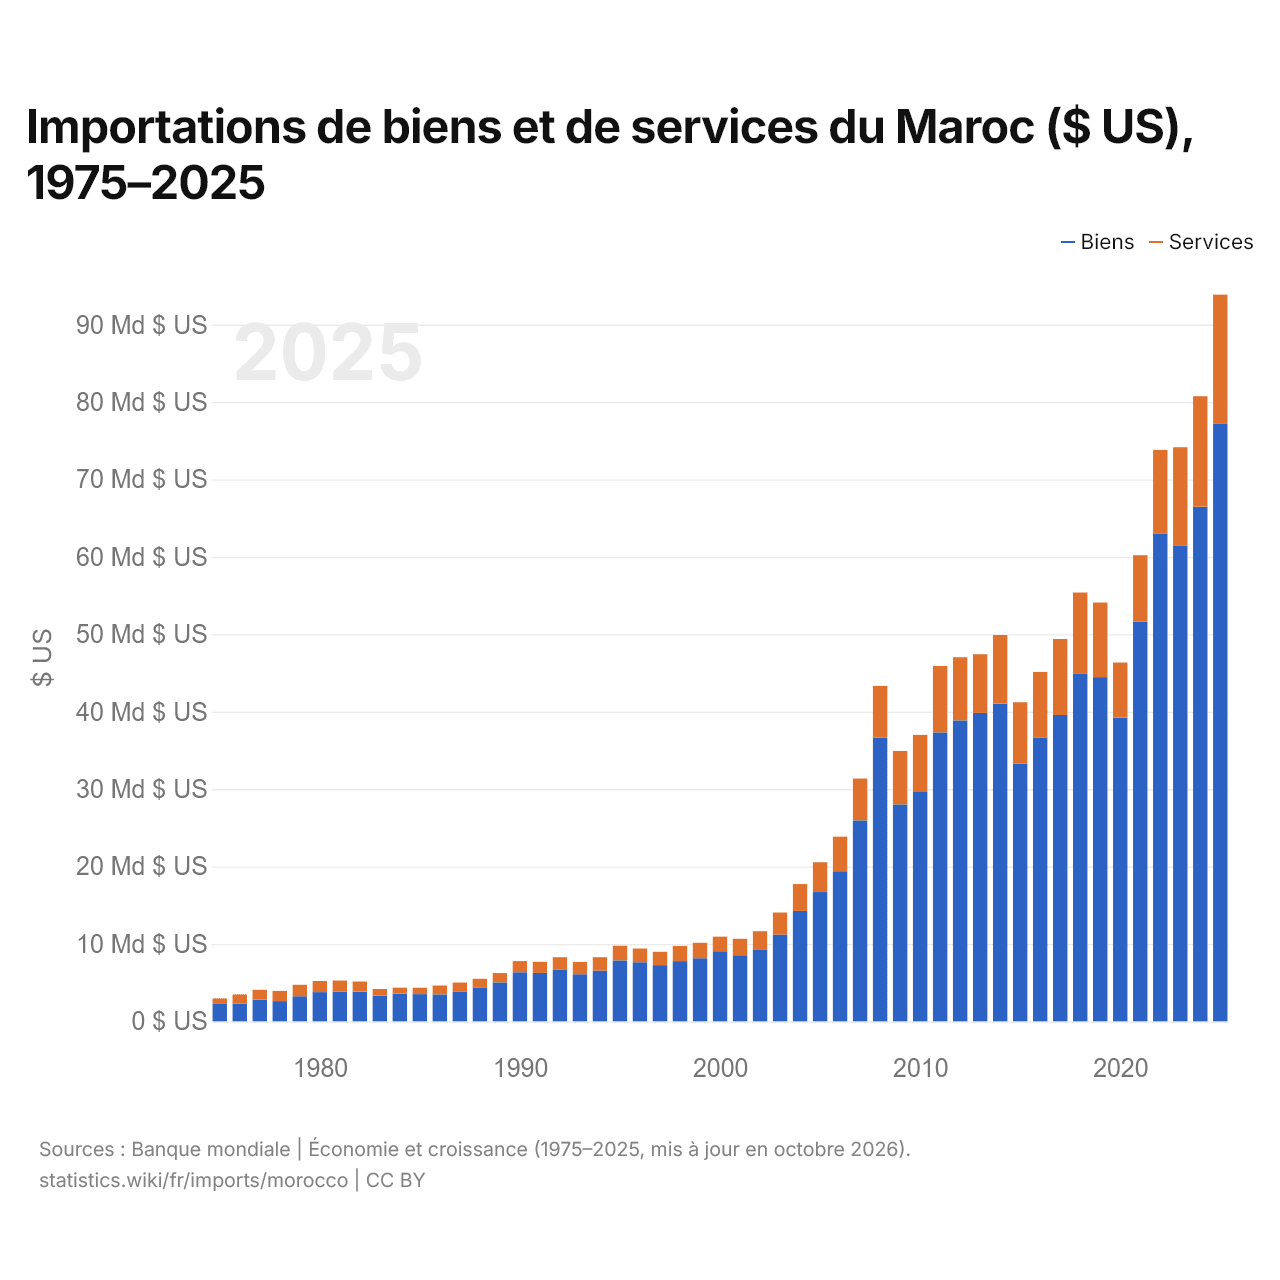
Importations de biens et de services du Maroc ($ US), 1975–2025
| Année | $ US | |
|---|---|---|
| Biens | Services | |
| 2025 | 77 179 503 997 $ US | 16 686 899 754 $ US |
| 2024 | 66 483 524 821 $ US | 14 251 328 298 $ US |
| 2023 | 61 407 709 697 $ US | 12 733 893 124 $ US |
| 2022 | 63 037 153 129 $ US | 10 772 570 751 $ US |
| 2021 | 51 641 946 065 $ US | 8 573 216 094 $ US |
| 2020 | 39 218 082 912 $ US | 7 140 183 107 $ US |
| 2019 | 44 465 870 446 $ US | 9 631 489 439 $ US |
| 2018 | 44 872 285 913 $ US | 10 512 614 579 $ US |
| 2017 | 39 570 959 762 $ US | 9 816 686 343 $ US |
| 2016 | 36 684 161 943 $ US | 8 449 440 405 $ US |
| 2015 | 33 307 158 475 $ US | 7 913 005 207 $ US |
| 2014 | 41 032 003 259 $ US | 8 871 785 474 $ US |
| 2013 | 39 853 614 197 $ US | 7 571 208 141 $ US |
| 2012 | 38 876 982 594 $ US | 8 136 421 399 $ US |
| 2011 | 37 333 019 633 $ US | 8 574 414 965 $ US |
| 2010 | 29 627 263 622 $ US | 7 371 474 421 $ US |
| 2009 | 28 027 355 464 $ US | 6 898 366 719 $ US |
| 2008 | 36 650 596 646 $ US | 6 678 068 156 $ US |
| 2007 | 25 954 017 475 $ US | 5 416 082 419 $ US |
| 2006 | 19 382 954 316 $ US | 4 472 851 168 $ US |
| 2005 | 16 697 907 013 $ US | 3 845 368 500 $ US |
| 2004 | 14 274 575 620 $ US | 3 451 371 593 $ US |
| 2003 | 11 200 871 256 $ US | 2 861 388 506 $ US |
| 2002 | 9 224 203 196 $ US | 2 413 338 677 $ US |
| 2001 | 8 540 592 189 $ US | 2 118 486 505 $ US |
| 2000 | 9 051 825 085 $ US | 1 892 281 995 $ US |
| 1999 | 8 150 100 342 $ US | 2 002 770 349 $ US |
| 1998 | 7 772 258 229 $ US | 1 962 847 124 $ US |
| 1997 | 7 255 927 998 $ US | 1 724 133 105 $ US |
| 1996 | 7 628 378 521 $ US | 1 782 264 949 $ US |
| 1995 | 7 874 841 083 $ US | 1 889 760 460 $ US |
| 1994 | 6 550 566 871 $ US | 1 729 706 940 $ US |
| 1993 | 6 082 242 060 $ US | 1 593 339 434 $ US |
| 1992 | 6 715 605 464 $ US | 1 570 648 434 $ US |
| 1991 | 6 263 560 193 $ US | 1 426 741 936 $ US |
| 1990 | 6 337 519 374 $ US | 1 445 018 153 $ US |
| 1989 | 5 027 467 640 $ US | 1 204 225 017 $ US |
| 1988 | 4 383 523 264 $ US | 1 106 326 477 $ US |
| 1987 | 3 864 473 082 $ US | 1 140 895 238 $ US |
| 1986 | 3 480 828 497 $ US | 1 156 285 439 $ US |
| 1985 | 3 515 033 094 $ US | 828 985 988 $ US |
| 1984 | 3 570 724 936 $ US | 780 694 099 $ US |
| 1983 | 3 302 057 705 $ US | 875 645 743 $ US |
| 1982 | 3 816 356 323 $ US | 1 333 051 637 $ US |
| 1981 | 3 840 460 918 $ US | 1 435 146 063 $ US |
| 1980 | 3 770 976 774 $ US | 1 436 332 750 $ US |
| 1979 | 3 243 797 075 $ US | 1 472 549 141 $ US |
| 1978 | 2 614 317 386 $ US | 1 322 478 678 $ US |
| 1977 | 2 799 696 152 $ US | 1 276 014 223 $ US |
| 1976 | 2 287 233 592 $ US | 1 191 814 338 $ US |
| 1975 | 2 251 703 430 $ US | 709 852 077 $ US |
En 2025, les importations de biens du Maroc s'élevaient à 77,2 milliards de dollars et celles de services à 16,7 milliards de dollars ; les services représentaient 17,8 % du total, contre 24,0 % en 1975.
Le Maroc dans le classement mondial des importations, 2025
| Rang | Pays | Importations | Part mondiale | |
|---|---|---|---|---|
| 48 |
 Chili |
109 Md $US | 0,32 % | |
| 49 |
 Argentine |
101 Md $US | 0,3 % | vs Argentine |
| 50 |
 Irak |
98,3 Md $US | 0,29 % | vs Irak |
| 51 |
 Maroc |
93,3 Md $US | 0,28 % | |
| 52 |
 Colombie |
93,2 Md $US | 0,28 % | vs Colombie |
| 53 |
 Kazakhstan |
80,3 Md $US | 0,24 % | vs Kazakhstan |
| 54 |
 Bangladesh |
76,8 Md $US | 0,23 % | vs Bangladesh |
Importations de biens et services du Maroc, % du PIB, 1960–2025
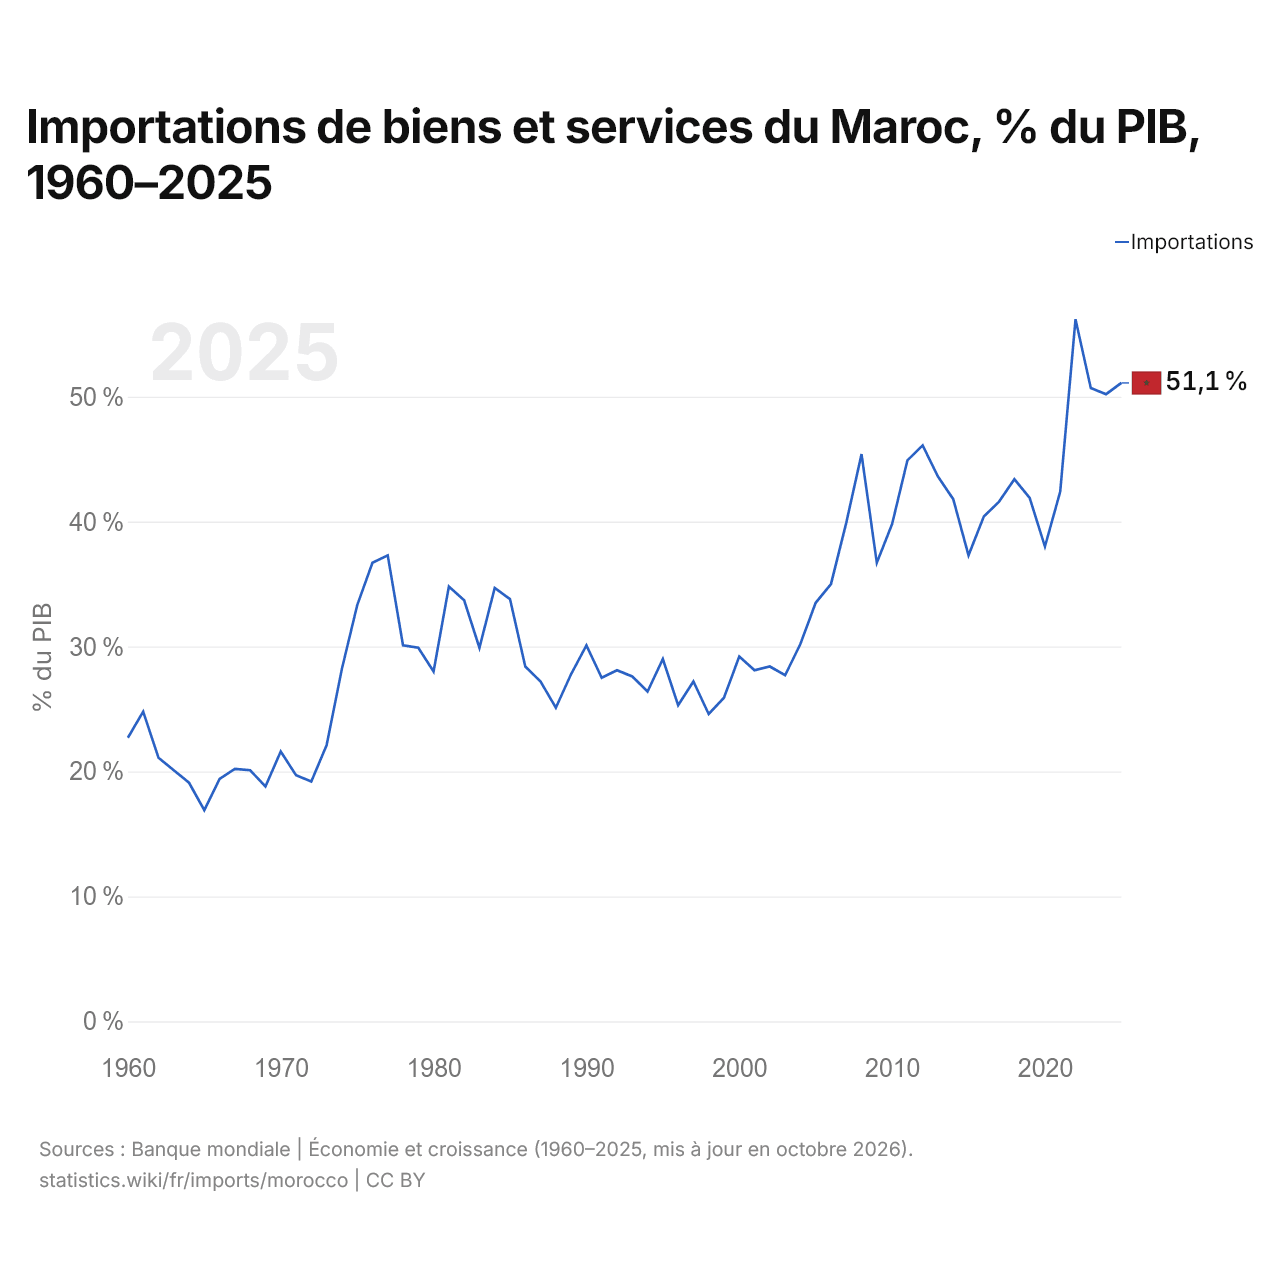
En 2025, les importations de biens et services du Maroc équivalaient à 51,1 % de son PIB, contre 22,7 % en 1960. La part la plus élevée a été de 56,2 %, en 2022.
Comparer les importations du Maroc avec celles d'autres pays
Sources :
- TradeMap (2001–2025, mis à jour en octobre 2026)
- Banque mondiale | Économie et croissance (1960–2025, mis à jour en octobre 2026)
Creative Commons Attribution (CC BY) : vous pouvez copier, partager, adapter et réutiliser ce contenu, y compris à des fins commerciales, à condition de citer statistics.wiki et d’indiquer les modifications apportées. Les sources citées ci-dessus peuvent avoir leurs propres conditions de licence.